 David Bailey, CEO of Bitcoin Magazine and crypto aide for the Trump campaign, believes that Trump’s victory in the upcoming election could trigger a bitcoin ‘space race,’ as countries rush to accommodate their policies to align with the U.S. Bailey also stated that they have secured several 7-figure commitments for Trump’s pro-crypto 0 million war […]
Bitcoin News
XRP Price Consolidates Below $0.530: What Could Trigger More Losses?
XRP price is consolidating losses above the .500 support. The price could extend losses if it fails to recover above the .530 resistance zone.
- XRP extended losses and traded below the .530 support.
- The price is now trading below .5250 and the 100-hourly Simple Moving Average.
- There was a break above a connecting bearish trend line with resistance at .5150 on the hourly chart of the XRP/USD pair (data source from Kraken).
- The pair could start another increase if the bulls push the price above .530.
XRP Price Stable Above .50
Recently, XRP price extended losses and traded below the .5250 support, like Bitcoin and Ethereum. There was a move toward the .5080 support. A low was formed at .5087 and the price is now consolidating losses.
There was a minor increase above the .5120 resistance. Besides, there was a break above a connecting bearish trend line with resistance at .5150 on the hourly chart of the XRP/USD pair. However, the pair is still trading below .5250 and the 100-hourly Simple Moving Average.
Immediate resistance is near the .5250 level. It is near the 23.6% Fib retracement level of the downward move from the .5699 swing high to the .5087 low. The first key resistance is near .530 and the 100-hourly Simple Moving Average.
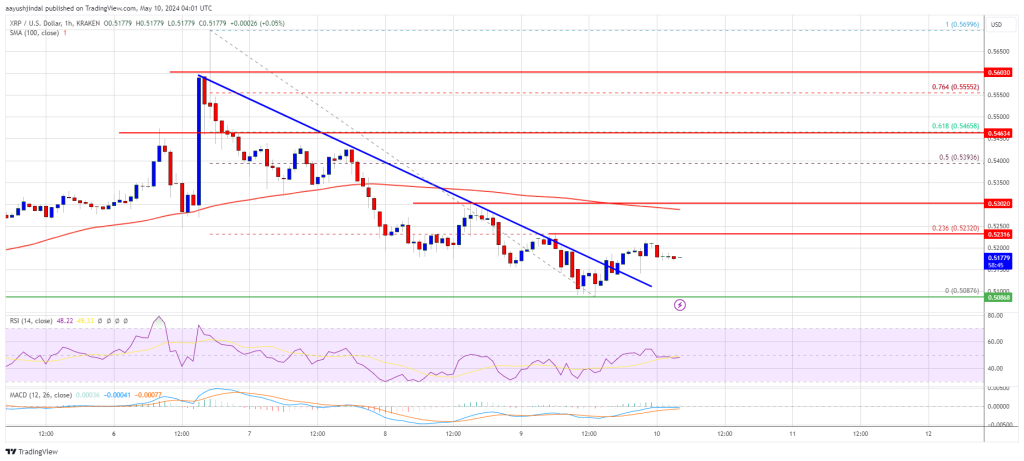
Source: XRPUSD on TradingView.com
A close above the .530 resistance zone could spark a strong increase. The next key resistance is near .5465. If the bulls remain in action above the .5465 resistance level, there could be a rally toward the .580 resistance. Any more gains might send the price toward the .600 resistance.
More Losses?
If XRP fails to clear the .530 resistance zone, it could start another decline. Initial support on the downside is near the .5150 level.
The next major support is at .5080. If there is a downside break and a close below the .5080 level, the price might accelerate lower. In the stated case, the price could retest the .4840 support zone.
Technical Indicators
Hourly MACD – The MACD for XRP/USD is now losing pace in the bearish zone.
Hourly RSI (Relative Strength Index) – The RSI for XRP/USD is now below the 50 level.
Major Support Levels – .5150 and .5080.
Major Resistance Levels – .5250 and .530.
XRP Price Prediction – Can 100 SMA Trigger Another Steady Increase
XRP price is correcting gains from the .570 resistance. The price is stable above the .5240 support and might aim for a fresh increase in the near term.
- XRP started a decent increase and climbed above the .550 resistance.
- The price is now trading above .5250 and the 100 simple moving average (4 hours).
- There is a key bullish trend line forming with support at .5320 on the 4-hour chart of the XRP/USD pair (data source from Kraken).
- The pair could start another increase if the bulls defend the .5240 support.
XRP Price Holds Support
Recently, XRP price started a decent increase above the .5250 resistance zone. The bulls even pushed the price above the .550 resistance zone before the bears appeared.
A high was formed at .5699 before there was a pullback like Bitcoin and Ethereum. The price dipped below the .550 support zone. The price declined below the 23.6% Fib retracement level of the upward move from the .4787 swing low to the .5699 high.
However, the price is now stable above .5250 and the 100 simple moving average (4 hours). There is also a key bullish trend line forming with support at .5320 on the 4-hour chart of the XRP/USD pair.
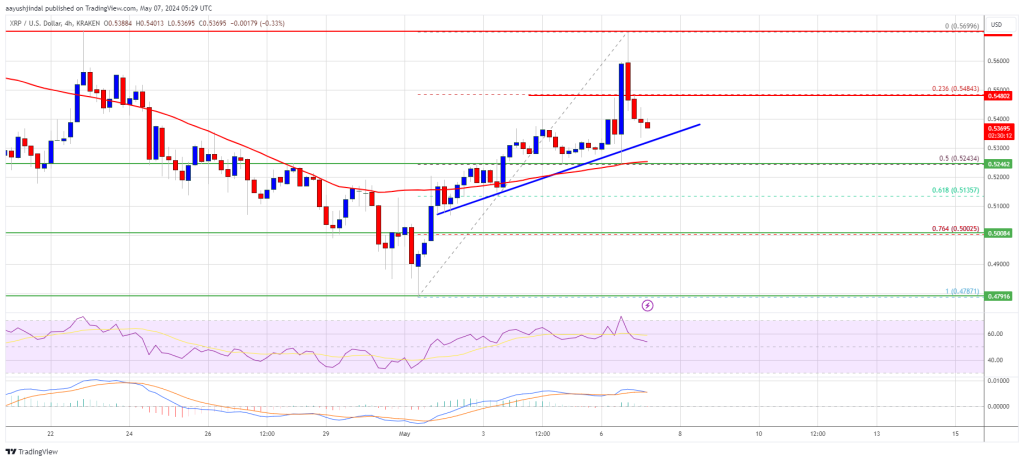
Source: XRPUSD on TradingView.com
Immediate resistance is near the .5480 level. The first key resistance is near .570. A close above the .570 resistance zone could spark a strong increase. The next key resistance is near .5850. If the bulls remain in action above the .5850 resistance level, there could be a rally toward the .620 resistance. Any more gains might send the price toward the .680 resistance.
More Losses?
If XRP fails to clear the .5480 resistance zone, it could start another decline. Initial support on the downside is near the .5320 level and the trend line.
The next major support is at .5240 and the 100 simple moving average (4 hours). If there is a downside break and a close below the .5240 level, the price might accelerate lower. In the stated case, the price could retest the .50 support zone.
Technical Indicators
4-Hours MACD – The MACD for XRP/USD is now losing pace in the bullish zone.
4-Hours RSI (Relative Strength Index) – The RSI for XRP/USD is now above the 50 level.
Major Support Levels – .5320, .5240, and .500.
Major Resistance Levels – .5480, .570, and .600.
Crypto Analyst Says Bitcoin Must Hold Above $51,800 As ETF Outflows Trigger Crash
The Bitcoin price continues to trend below ,000 as a 20% decline triggered a brutal market-wide crash. This has exposed multiple critical support points for the cryptocurrency, some of which the price has already fallen below. In light of this, a crypto analyst known as Norok has revealed the level the BTC price must not fall below to maintain its bullish trend.
Bitcoin Price Must Hold Above ,800
In an analysis posted on the TradingView website, crypto analyst Norok revealed that ,800 is now the most important support level for Bitcoin. Norok pointed out that Bitcoin has since returned to its last support level which was last seen in December 2023, making this a crucial support.
In the meantime, the support that had been built up by bulls at the ,000 level has since been broken by bears and has now been turned into resistance. Nevertheless, the crypto analyst does not believe that the Bitcoin price has turned bearish, despite the crash that has rocked the crypto market.
For Norok to turn bearish, he stated that the BTC price would have to break down below support at ,800. According to him, such a move will invalidate whatever bullish thesis is in play for Bitcoin, ending the bullish trend of 2023-2024.
In the short term, Norok identifies ,900 as a level that bulls must hold. He explains that this could help to reinforce the current bullish trend. “Price must hold here at this Support and then it can recapture the cloud to resume to Bullish Trend,” the crypto analyst said. “This is a highly decisive moment in Price action today.”
BTC Suffers As A Result Of ETF Outflows
One major driver of the Bitcoin price decline in the last few weeks has been a turn from inflows to outflows in Spot Bitcoin ETFs. Since these ETFs require the issuers to hold BTC to support the assets they are selling to investors, inflows are incredibly bullish as these issuers have taken to buying BTC to fulfill this requirement.
However, with investors beginning to withdraw their funds, the reverse has been the case, leading to a high selling pressure in the market. Spot Bitcoin ETFs have now recorded six consecutive trading days of outflows, reaching an all-time high outflow record 3.7 million on Wednesday, according to data from Coinglass.
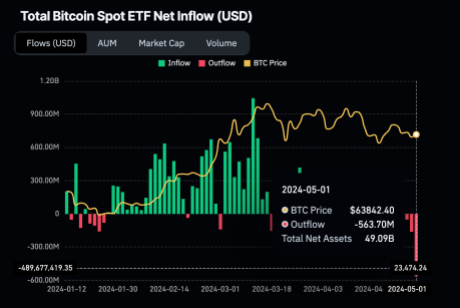
If these outflows continue, then the BTC price could continue to decline, and at the current rate, the pioneer cryptocurrency might be testing Norok’s ,800 soon enough. However, a turn toward inflows would mean issuers have to buy BTC and this can translate to a price recover.
A Look at How Bitcoin’s Halving Might Trigger ‘Sell the News’ or ‘Sell the Rumor’ Reactions
 With fewer than 300 blocks remaining until Bitcoin’s fourth halving, speculation has been rife, with many expecting a ‘sell the news’ scenario following an 11% drop in bitcoin prices. On the other hand, this downturn might just be the precursor to a shakeout and a subsequent significant uptick. Large holders, often known as ‘whales’, are […]
Bitcoin News
XRP Price Prediction: Bulls Take Hit But This Level Could Trigger Another Increase
XRP price started a downside correction from the .580 resistance. The price could start a fresh rally unless there is a close below the .535 support.
- XRP is struggling to clear the .5650 and .580 resistance levels.
- The price is now trading above .535 and the 100 simple moving average (4 hours).
- There is a key bullish trend line forming with support at .5350 on the 4-hour chart of the XRP/USD pair (data source from Kraken).
- The pair could start a fresh rally unless there is a close below the .535 support.
XRP Price Dips To Key Support
In the past few days, XRP price recovered higher from the .520 zone. There was a move above the .535 and .550 resistance levels. However, the bears remained active near the .580 resistance and protected more upsides, like Bitcoin and Ethereum.
The recent high was formed at .5792 before there was a downside correction. There was a move below the .550 level. The price even tested the .535 support. A low is formed near .5322 and the price is now consolidating losses.
Ripple’s token price is now trading above .535 and the 100 simple moving average (4 hours). There is also a key bullish trend line forming with support at .5350 on the 4-hour chart of the XRP/USD pair. On the upside, immediate resistance is near the .5550 zone. It is close to the 50% Fib retracement level of the downward move from the .5793 swing high to the .5322 low.
The first key resistance is near .5620 or the 61.8% Fib retracement level of the downward move from the .5793 swing high to the .5322 low, above which the price could rise toward the .580 resistance. A close above the .580 resistance zone could spark a strong increase.
Source: XRPUSD on TradingView.com
The next key resistance is near .600. If the bulls remain in action above the .600 resistance level, there could be a rally toward the .620 resistance. Any more gains might send the price toward the .650 resistance.
Another Decline?
If XRP fails to clear the .5550 resistance zone, it could start another decline. Initial support on the downside is near the .535 zone and the trend line.
The next major support is at .5220. If there is a downside break and a close below the .5220 level, the price might accelerate lower. In the stated case, the price could retest the .480 support zone.
Technical Indicators
4-Hours MACD – The MACD for XRP/USD is now losing pace in the bearish zone.
4-Hours RSI (Relative Strength Index) – The RSI for XRP/USD is now below the 50 level.
Major Support Levels – .535, .522, and .480.
Major Resistance Levels – .555, .565, and .580.
Analyst Reveals Potential Trigger For A 32% Cardano (ADA) Rally
An analyst has explained that based on a pattern forming in the Cardano price, a 32% rally could take place, if a close above this level can happen.
Cardano Has Been Forming A Descending Triangle Pattern Recently
In a new post on X, analyst Ali has talked about a Descending Triangle forming in the daily price of Cardano. The “Descending Triangle” refers to a pattern in technical analysis (TA) that, as its name suggests, looks like a triangle with a downward slope.
The pattern is made up of two lines, the first of which is a slopped line connecting lower highs in the price, while the second one is horizontal (that is, parallel to the time-axis) and joins together a series of lows.
The upper line of the pattern provides resistance to the price, so it can be a likely point of reversal for it. Similarly, the lower line may provide support, so bottoms can be probable at it.
A break out of either of these lines implies the continuation of the trend in that direction. This means that a breakout above the triangle can be bullish for the asset, while a drop under it can prove to be a bearish signal.
Like this pattern, there is also another pattern in TA called the Ascending Triangle. This pattern works similarly, except for the fact that the two lines are switched around (that is, the slopped line is the bottom line and connects together higher lows).
Now, here is the chart shared by Ali that shows the Descending Triangle pattern that has recently been forming for Cardano on its 1-day price:

From the graph, it’s visible that Cardano’s latest sharp upward surge means that cryptocurrency is now retesting the upper line of this Descending Triangle.
If the historical pattern is anything to go by, a break above could be a positive sign for the price. “A sustained daily close above .53 could lead to the start of a 32% rally, potentially pushing $ADA up to .68!” notes the analyst. Ali has chosen a target 32% higher as the height of the Descending Triangle was equal to a price swing of 32% as well.
Naturally, this bullish outlook would only be if a break can truly take place for the cryptocurrency. A rejection here is still a possibility, as it has already happened a few times over the course of this pattern’s duration.
ADA Price
The past 24 hours have been bullish for the cryptocurrency sector as a whole, but Cardano has clearly pulled ahead of the crowd as it has registered returns of almost 10%.
Following this surge, the coin has managed to break above the .53 level. The asset now has to hold above this mark if the Descending Triangle break has to register.
BNB Price Increase To Continue? This Resistance Could Trigger Fresh Rally
BNB price is attempting a fresh increase from the 8 zone. The price could start a fresh rally if there is a clear move above the 0 resistance.
- BNB price is showing bullish signs above the 0 pivot level.
- The price is now trading below 0 and the 100 simple moving average (4 hours).
- There is a key bearish trend line forming with resistance near 6 on the 4-hour chart of the BNB/USD pair (data source from Binance).
- The pair gather bullish momentum if there is a close above the 8-0 resistance zone.
BNB Price Eyes Fresh Rally
In the past few days, BNB price started a decent increase and cleared the 0 resistance zone, unlike Bitcoin and Ethereum. There was a move above the 5 level before the bears appeared.
A high was formed near 3 and the price recently started a downside correction. There was a move below the 8 level. The price declined below the 50% Fib retracement level of the upward move from the 7 swing low to the 3 high.
BNB is now consolidating near 5 and the 100 simple moving average (4 hours). Immediate resistance is near the 8 level. There is also a key bearish trend line forming with resistance near 6 on the 4-hour chart of the BNB/USD pair.
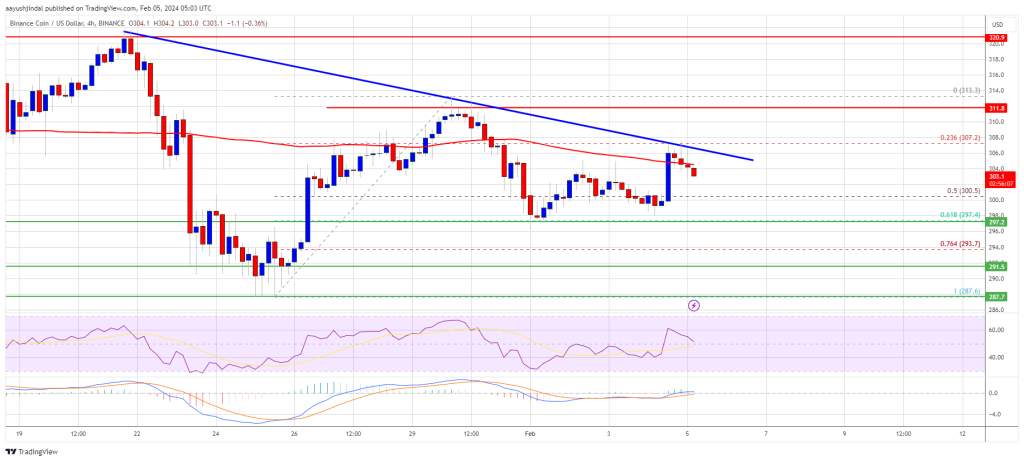
Source: BNBUSD on TradingView.com
The next resistance sits near the 0 level. A clear move above the 0 zone could send the price further higher. In the stated case, BNB price could test 0. A close above the 0 resistance might set the pace for a larger increase toward the 5 resistance. Any more gains might call for a test of the 0 level.
Another Decline?
If BNB fails to clear the 0 resistance, it could continue to move down. Initial support on the downside is near the 0 level. The next major support is near the 2 level or the 76.4% Fib retracement level of the upward move from the 7 swing low to the 3 high.
The main support sits at 8. If there is a downside break below the 8 support, the price could drop toward the 5 support. Any more losses could initiate a larger decline toward the 2 level.
Technical Indicators
4-Hours MACD – The MACD for BNB/USD is losing pace in the bullish zone.
4-Hours RSI (Relative Strength Index) – The RSI for BNB/USD is currently above the 50 level.
Major Support Levels – 0, 2, and 8.
Major Resistance Levels – 8, 0, and 0.
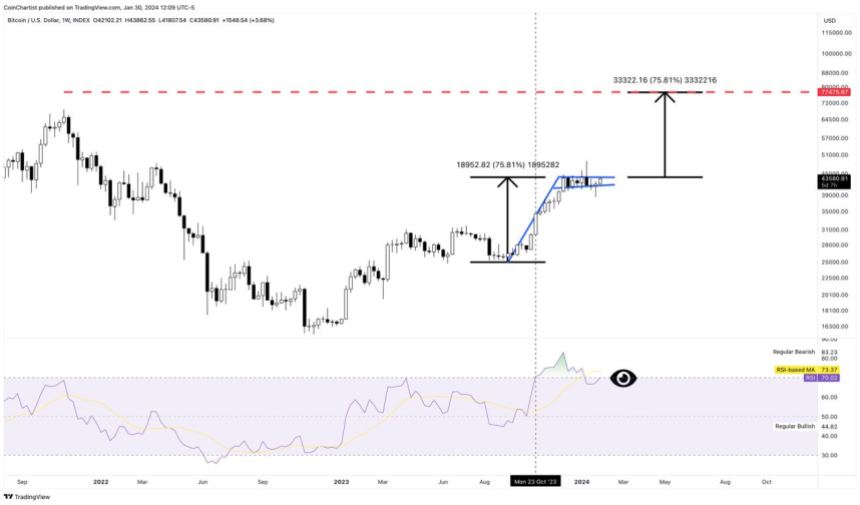
Why “Overbought” Bitcoin Could Trigger A 107% Rally
Bitcoin price had previously been showing extreme strength leading up until the debut of the first spot ETFs. That strength has since subsided, leading to a 20% correction in BTCUSD.
A popular technical indicator that measures momentum, however, could point to powerful continuation to the upside, but only if a certain level is breached. Keep reading to learn more about the Relative Strength Index and how the top cryptocurrency behaves once the market reaches an “overbought” level.
Bitcoin Approaches “Overbought” And Why This Isn’t A Bad Thing
The Relative Strength Index is a momentum-measuring tool that signals when a market is “overbought” or “oversold”. When a financial asset reaches such conditions, it often means the trend is about to change.
In Bitcoin and other cryptocurrencies, the weekly RSI is often a signal that the asset is moving into its most powerful phase. For example, Bitcoin made it above a reading of 70 in October 2023, and only weeks later saw an over 60% rally to local 2024 highs.
Now 1W BTCUSD charts are showing an RSI reading of just below 70, pointing to a possible close back above the overbought level. If bulls can keep the top cryptocurrency by market cap above ,650, the weekly RSI should close above the threshold.
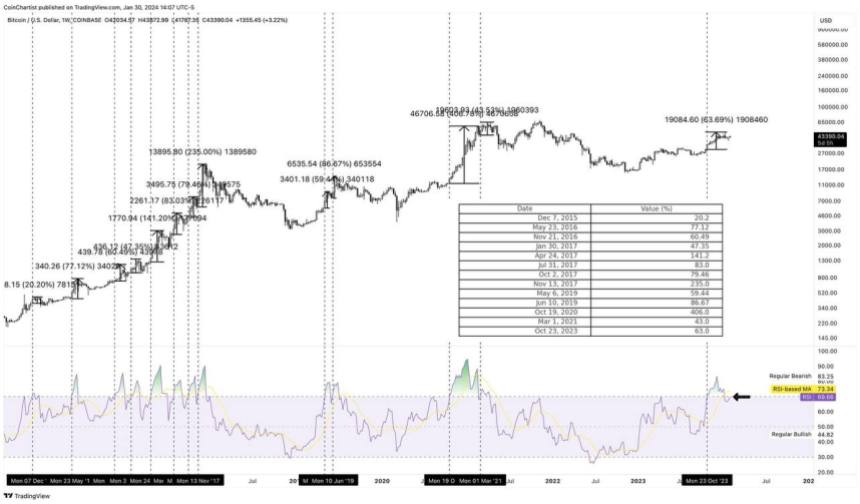
BTCUSD Historical 1W Relative Strength Data
Historical data could possibly shed some light on what might happen if the weekly Relative Strength Index gets the close above 70 as anticipated.
Over the last ten years, Bitcoin saw a 1W RSI close above 70 a total of 13 times. This happened 8 times in 2016 and 2017, twice in 2019, and once each in 2020 and 2021. One additional instance occurred in 2023.
Of the 13 times, the average gain after the RSI closed above 70 to the peak of the movement was 107%. The largest rally was in 2020, bringing over 400% returns. The smallest rally was in 2016 and saw only a 20% gain.
After removing the largest and smallest outliers, the average drops down to around 61%. This could mean that Bitcoin could produce on average a move between 61 and 107%.
A 61% gain takes BTCUSD back to just under ,000 and shy of a new all-time high, while a 107% move sets a new record closer to ,000 per coin. The cryptocurrency is also potentially working on a bull flag pattern, with a target of around ,000.
Ethereum Price Trims Gains But 100 SMA Could Trigger Fresh Increase
Ethereum price extended its increase above the ,320 resistance zone. ETH is correcting gains but the 100 hourly SMA might provide support and start a fresh increase.
- Ethereum started an extended recovery wave above the ,320 resistance zone.
- The price is trading above ,300 and the 100-hourly Simple Moving Average.
- There was a break below a key bullish trend lien with support at ,325 on the hourly chart of ETH/USD (data feed via Kraken).
- The pair might start a fresh increase if it manages to stay above the ,300 level.
Ethereum Price Holds Support
Ethereum price remained in a positive zone above the ,250 resistance zone. ETH cleared the ,320 resistance to move further into a positive zone, outperforming Bitcoin.
The price traded close to the ,400 level. A high was formed near ,390 and the price is now correcting gains. There was a move below the ,350 level. The price broke the 50% Fib retracement level of the upward move from the ,235 swing low to the ,390 high.
Besides, there was a break below a key bullish trend lien with support at ,325 on the hourly chart of ETH/USD. However, Ethereum is still above ,300 and the 100-hourly Simple Moving Average.
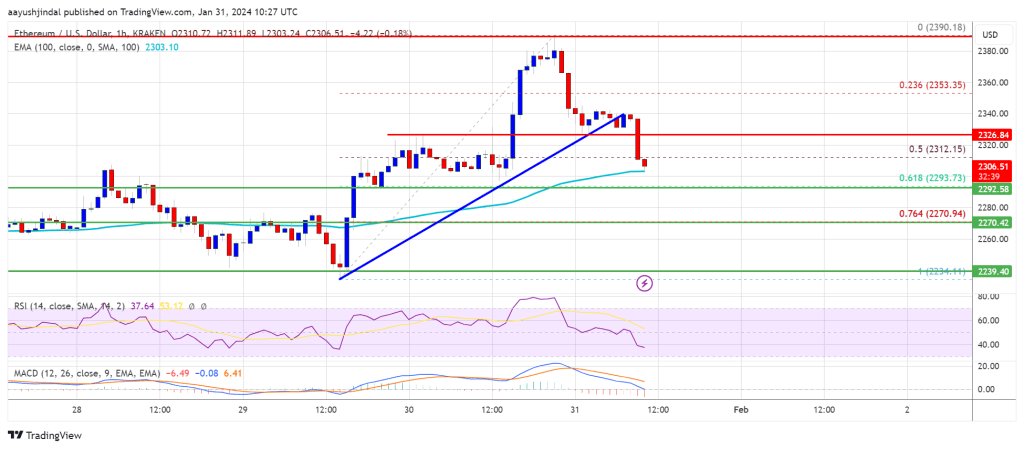
Source: ETHUSD on TradingView.com
On the upside, the first major resistance is near the ,325 level. The next major resistance is near ,350, above which the price might rise and test the ,400 resistance. If the bulls push the price above the ,400 resistance, they could aim for ,450. A clear move above the ,450 level might send the price further higher. In the stated case, the price could rise toward the ,550 level.
More Losses in ETH?
If Ethereum fails to clear the ,325 resistance, it could continue to move down. Initial support on the downside is near the ,300 level and the 100 hourly SMA.
The next key support could be the ,295 zone or the 61.8% Fib retracement level of the upward move from the ,235 swing low to the ,390 high. A daily close below the ,295 support might start another steady decline. In the stated case, Ether could test the ,200 support. Any more losses might send the price toward the ,120 level.
Technical Indicators
Hourly MACD – The MACD for ETH/USD is gaining momentum in the bearish zone.
Hourly RSI – The RSI for ETH/USD is now below the 50 level.
Major Support Level – ,300
Major Resistance Level – ,325