 The Director General of Nigeria’s Securities Regulator has announced plans to delist the local currency from peer-to-peer cryptocurrency trading platforms in the coming days. He insisted that the decision to delist the naira aims to eliminate the manipulation of the local currency by P2P cryptocurrency traders. P2P Crypto Transactions Ban The Nigerian Securities and Exchange […]
Bitcoin News
DOT Price (Polkadot) Reaches Key Juncture, Is This Bulls Trap or Correction?
Polkadot (DOT) is correcting gains from the .5 resistance against the US Dollar. The price could start another increase if it stays above the .75 support.
- DOT gained pace and tested the .5 resistance level against the US Dollar.
- The price is trading above the .00 zone and the 100 simple moving average (4 hours).
- There is a short-term expanding triangle forming with resistance at .50 on the 4-hour chart of the DOT/USD pair (data source from Kraken).
- The pair could continue to decline if it fails to stay above the .75 support.
Polkadot Price Holds Support
After forming a base above the .00 level, DOT price started a decent increase. It broke many hurdles near .75 and even spiked above .25. A high was formed at .46 and the price is now correcting gains, like Ethereum and Bitcoin.
There was a move below the .25 support zone. The price declined below the 23.6% Fib retracement level of the upward move from the .03 swing low to the .46 high.
DOT is now trading above the .00 zone and the 100 simple moving average (4 hours). Immediate resistance is near the .25 level. The next major resistance is near .50. There is also a short-term expanding triangle forming with resistance at .50 on the 4-hour chart of the DOT/USD pair.
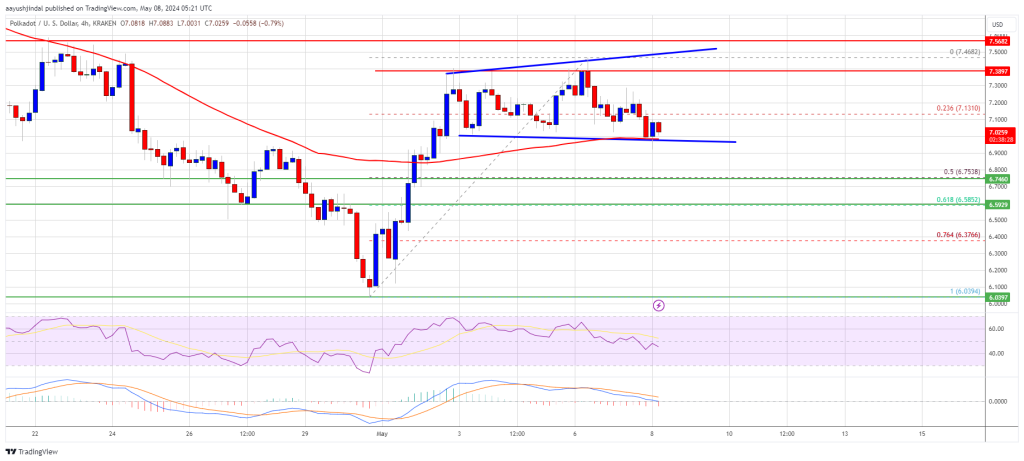
Source: DOTUSD on TradingView.com
A successful break above .50 could start another strong rally. In the stated case, the price could easily rally toward .00 in the near term. The next major resistance is seen near the .80 zone.
More Downsides in DOT?
If DOT price fails to start a fresh increase above .25, it could continue to move down. The first key support is near the .00 level and the 100 simple moving average (4 hours).
The next major support is near the .75 level or the 50% Fib retracement level of the upward move from the .03 swing low to the .46 high, below which the price might decline to .50. Any more losses may perhaps open the doors for a move toward the .10 support zone or .00.
Technical Indicators
4-Hours MACD – The MACD for DOT/USD is now losing momentum in the bearish zone.
4-Hours RSI (Relative Strength Index) – The RSI for DOT/USD is now below the 50 level.
Major Support Levels – .00, .75 and .50.
Major Resistance Levels – .25, .50, and .00.
P2P XMR Exchange Localmonero/Agoradesk Announces Closure After Seven Years of Operation
 In a recent announcement, Localmonero/Agoradesk, a popular platform for trading monero (XMR), has decided to wind down its operations after nearly seven years. The decision, influenced by a mix of internal and external factors, initiates a six-month winding-down process starting from May 7, 2024. Effective immediately, all new signups and ad postings are disabled, and […]
Bitcoin News
Ethereum Price May Have Another Chance For A Bullish Streak: Here’s How
Ethereum price is correcting gains from the ,220 resistance. ETH could start a fresh increase if it clears the ,055 and ,080 resistance levels.
- Ethereum started a fresh decline after it faced resistance near ,220.
- The price is trading below ,100 and the 100-hourly Simple Moving Average.
- There is a key bearish trend line forming with resistance at ,055 on the hourly chart of ETH/USD (data feed via Kraken).
- The pair must stay above the ,000 support to start another increase toward ,220.
Ethereum Price Revisits K
Ethereum price faced resistance at ,220 and started a downside correction, like Bitcoin. ETH declined below the ,120 and ,080 levels. It even tested the ,000 support.
A low was formed at ,005 and the price is now consolidating losses. Ethereum is trading below ,100 and the 100-hourly Simple Moving Average. Immediate resistance is near the ,050 level or the 23.6% Fib retracement level of the recent drop from the ,217 swing high to the ,005 low.
There is also a key bearish trend line forming with resistance at ,055 on the hourly chart of ETH/USD. The first major resistance is near the ,080 level or the 100-hourly Simple Moving Average.
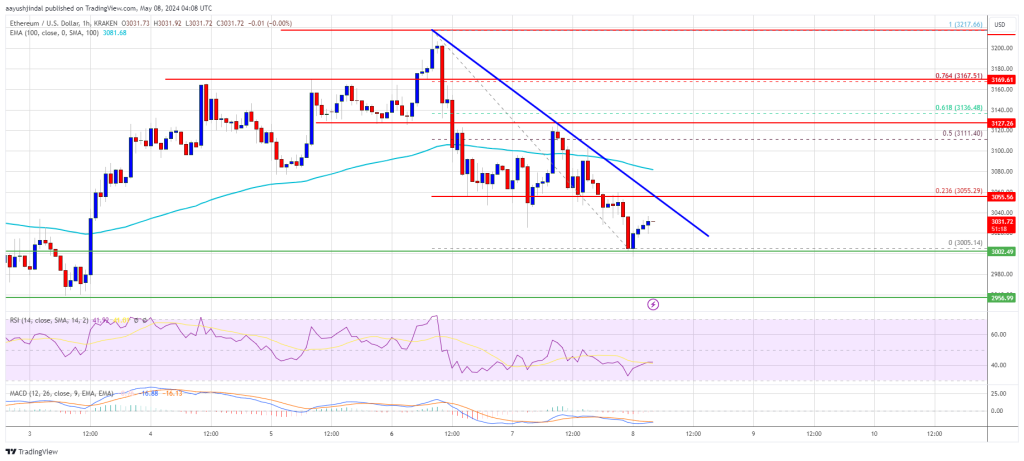
Source: ETHUSD on TradingView.com
The next key resistance sits at ,120 or the 61.8% Fib retracement level of the recent drop from the ,217 swing high to the ,005 low, above which the price might gain traction and rise toward the ,200 level. If there is a clear move above the ,200 level, the price might rise and test the ,350 resistance. Any more gains could send Ether toward the ,500 resistance zone.
More Losses In ETH?
If Ethereum fails to clear the ,055 resistance, it could start another decline. Initial support on the downside is near the ,000 level. The first major support is near the ,950 zone.
The next support is near the ,920 level. A clear move below the ,920 support might push the price toward ,840. Any more losses might send the price toward the ,720 level in the near term.
Technical Indicators
Hourly MACD – The MACD for ETH/USD is losing momentum in the bearish zone.
Hourly RSI – The RSI for ETH/USD is now below the 50 level.
Major Support Level – ,000
Major Resistance Level – ,080
Cryptocurrency Imports in Brazil Break Records and Begin to Affect Trade Balances
 Purchases from foreign cryptocurrency exchanges, considered imports, have broken records in Brazil, putting some weight into the nation’s trade balance. During the last 12 months, cryptocurrency purchases reached .84 billion, after reaching .3 billion last year. Likewise, crypto imports reached .69 billion in Q1 2024, rising by 118% compared to the numbers registered in Q1 […]
Bitcoin News
Bitcoin Price Dips Again, Is This A Fresh Bearish Signal?
Bitcoin price failed to clear the ,500 resistance. BTC is now moving lower and there are a few bearish signs emerging below the ,500 level.
- Bitcoin started a fresh downside correction and traded below ,500.
- The price is trading below ,350 and the 100 hourly Simple moving average.
- There was a break below a major bullish trend line with support at ,700 on the hourly chart of the BTC/USD pair (data feed from Kraken).
- The pair could extend losses and revisit the ,000 support zone in the near term.
Bitcoin Price Rejects ,500
Bitcoin price extended its increase above the ,500 level. However, BTC struggled to clear the ,500 resistance zone. A high was formed at ,550 and the price is now correcting gains.
There was a move below the ,000 level. The price declined below the 23.6% Fib retracement level of the upward wave from the ,380 swing low to the ,550 high. Besides, there was a break below a major bullish trend line with support at ,700 on the hourly chart of the BTC/USD pair.
Bitcoin is now trading below ,500 and the 100 hourly Simple moving average. Immediate resistance is near the ,350 level. The first major resistance could be ,000. The next key resistance could be ,000.
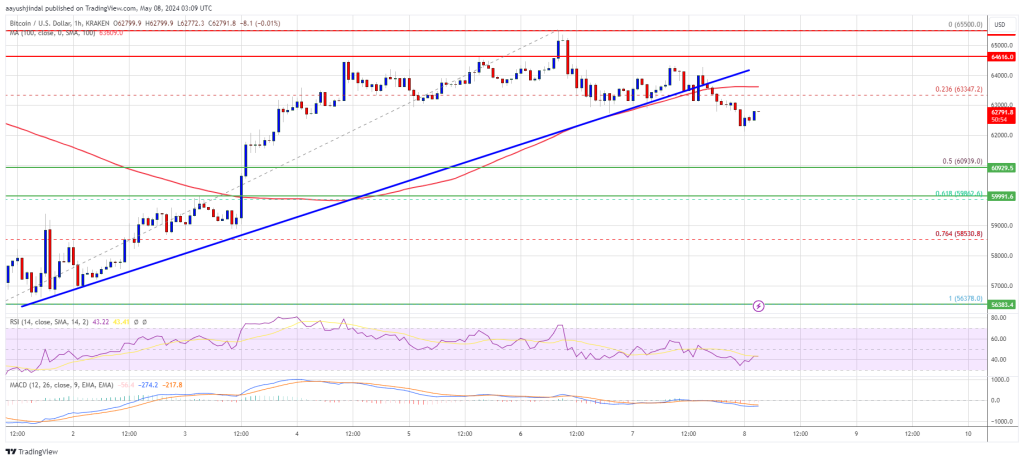
Source: BTCUSD on TradingView.com
The main hurdle is now at ,500. A clear move above the ,500 resistance might send the price higher. The next resistance now sits at ,650. If there is a close above the ,650 resistance zone, the price could continue to move up. In the stated case, the price could rise toward ,000.
More Losses In BTC?
If Bitcoin fails to climb above the ,500 resistance zone, it could continue to move down. Immediate support on the downside is near the ,000 level.
The first major support is ,000 or the 50% Fib retracement level of the upward wave from the ,380 swing low to the ,550 high. If there is a close below ,000, the price could start to drop toward ,000. Any more losses might send the price toward the ,000 support zone in the near term.
Technical indicators:
Hourly MACD – The MACD is now gaining pace in the bearish zone.
Hourly RSI (Relative Strength Index) – The RSI for BTC/USD is now below the 50 level.
Major Support Levels – ,000, followed by ,000.
Major Resistance Levels – ,500, ,000, and ,500.
Bitcoin ETF Issuer Franklin Templeton Bullish On Solana (SOL), Foresees It As 3rd Largest Crypto
In the wake of the November 2022 crypto market crash, which saw the bankruptcy and collapse of FTX and other firms, Solana (SOL) has emerged as a standout performer, experiencing a year-to-date price increase of over 560%.
With a market capitalization of billion, Solana has secured its place as the fifth largest cryptocurrency, trailing only Bitcoin (BTC), Ethereum (ETH), Binance Coin (BNB), and Tether’s USDT stablecoin.
Despite its substantial growth, asset management giant and Bitcoin exchange-traded fund (ETF) issuer Franklin Templeton anticipates further expansion for Solana as the emerging bull market takes shape.
Solana Poised For Continued Growth
A recent report released by the firm highlights Solana’s strong position to capture the next wave of crypto adoption, solidifying itself as a major crypto asset alongside Bitcoin and Ethereum.
The report emphasizes that Solana’s growth will continue due to several key factors. Notably, the crypto industry witnessed accelerated activity during Q4 2023, with Solana as a focal point for major airdrops within its ecosystem, such as Jito and Pyth.
According to the report, these airdrops generated a wealth effect of over a billion dollars, driving up the value of SOL and other Solana ecosystem tokens, particularly meme coins. This surge occurred concurrently with Bitcoin’s upward trend, providing additional momentum to the Solana ecosystem.
Since then, meme coins have gained significant attention, with a substantial portion of activity occurring on Solana. The network has witnessed the creation and trading of numerous meme coins, with some attaining multi-billion-dollar market caps, including Bonk (BONK) and Dogwifhat (WIF).
The Crypto Industry’s Next Big Breakthrough?
According to the asset manager, Solana has demonstrated significant growth over the past year, which is evident in the network’s increased total fees and decentralized exchange (DEX) volumes. The network’s low fees, transaction latency, and high data throughput relative to other networks have contributed to its success.
Solana’s network effects are expected to strengthen further as its performance improves, positioning it to capture upcoming trends in the crypto space.
The future remains uncertain as crypto enthusiasts ponder the next big thing in the industry. However, Franklin Templeton suggests that there is a strong possibility that Solana could play a pivotal role.
According to the report, the Solana ecosystem anticipates additional airdrops in the coming months, which will continue to enhance the ecosystem’s wealth effect.
Moreover, meme coin activity shows no signs of slowing down on the Solana network, further adding to the bullish sentiment surrounding the cryptocurrency and its ecosystem.
SOL is now attempting to consolidate above the 0 level and has seen a significant 21% increase in the last seven days alone.
Featured image from Shutterstock, chart from TradingView.com
India Working on Offline Transferability of Digital Rupee, Says Central Bank Governor
 India’s central bank, the Reserve Bank of India (RBI), is in the process of making its central bank digital currency (CBDC) available without relying on internet access. RBI Governor Shaktikanta Das has emphasized the importance of ensuring the digital rupee’s ease of use. RBI Governor Updates Digital Rupee Progress During an event hosted by the […]
Bitcoin News
Bitcoin’s Bold Bet: Options Traders Eye $100K Surge By September
The crypto market is currently buzzing with anticipation as Bitcoin options traders position themselves for what they foresee as a “substantial price rally” in September.
Particularly, the derivatives market is expressing confidence, with a significant number of traders betting on Bitcoin surpassing the 0,000 mark.
Bitcoin Market Optimism Amidst Whale Movements
Recent analysis from industry experts highlights a significant trend in Bitcoin options that points to growing optimism among traders. According to insights from QCP Capital, a noticeable shift has occurred in the risk reversals landscape, with calls (options to buy) now priced higher than puts (options to sell).
QCP Capital noted that this change underscores a “stronger demand” for potential price increases rather than hedges against declines.
The preference for call options, particularly those pegged at ambitious strike prices of ,000 and 0,000 for September, underscores the bullish sentiment permeating through the market.
Data from the Deribit derivatives exchange corroborates this trend, revealing that call options with a strike price of 0,000 for the end of September are currently seeing the highest volume.
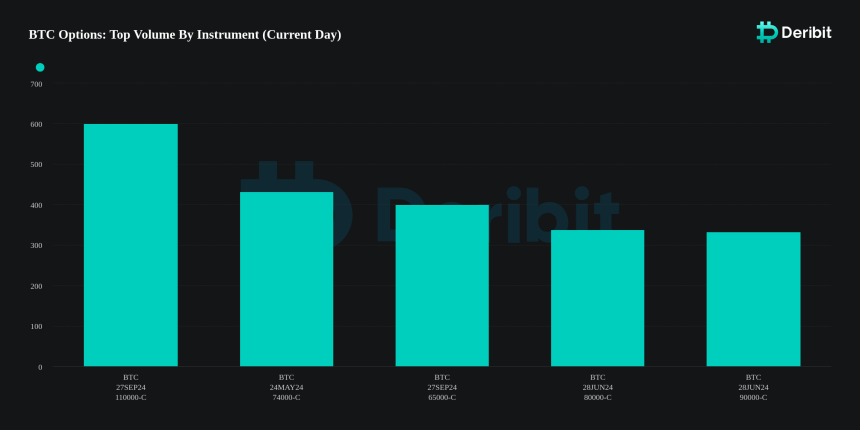
This enthusiasm in the options market is a strong indicator of the traders’ bullish outlook for Bitcoin, suggesting that many are betting on a significant price uptick by the end of the third quarter.
However, the skies are not clear. Bitfinex analysts have pointed out actions by Bitcoin whales that might signal potential short-term volatility. The whale ratio on exchanges—a metric indicating the amount of Bitcoin large holders are moving to exchanges—has seen an uptick.
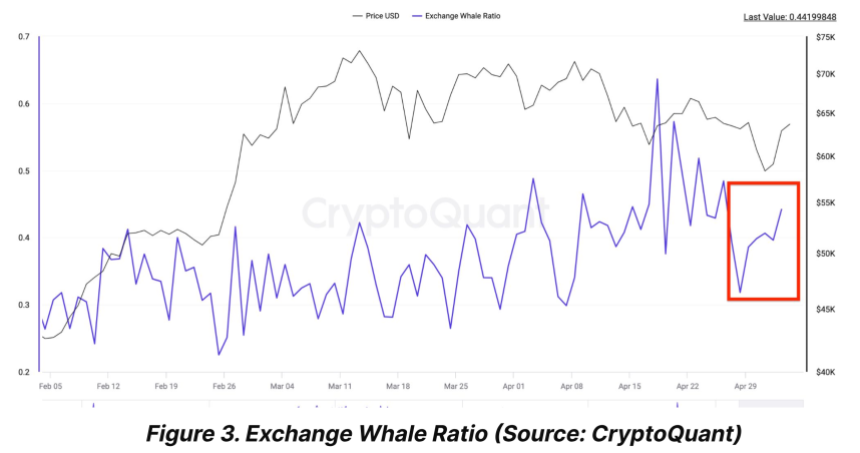
This could typically suggest that these major players are considering selling, which could introduce increased sell pressure in the market.
Bitfinex’s recent Alpha report revealed that while the short-term holders of Bitcoin seem to be at a pivot point with a realized price of ,700 acting as an “important support level,” the increased activity by whales on exchanges might lead to heightened price fluctuations.
Long-Term Perspectives And Market Recoveries
Despite these potential short-term pressures, the broader Bitcoin market has shown signs of recovery. After a drop from its peak above ,000 in March, Bitcoin has demonstrated resilience with a 5.8% increase over the past week and a 2.8% rise in the last 24 hours alone. This recovery has brought its trading price to around ,791 at the time of writing.
Adding to the long-term confidence in Bitcoin, Michael Saylor of MicroStrategy shared his views on the future catalysts for Bitcoin’s price.
In his perspective, regulatory decisions, particularly those rejecting spot exchange-traded funds (ETF) applications for other cryptocurrencies, will further solidify Bitcoin’s standing as an unmatched digital asset.
Saylor disclosed that this regulatory moat could potentially steer more institutional investments towards Bitcoin, as it remains the ‘steel’ of the cryptocurrency world—unparalleled and indispensable.
Featured image from Unsplash, Chart from TradingView
Fantom (FTM) Bull Run: 8% Price Surge And Robust Double-Digit Growth In Key Metrics
Fantom (FTM), a Layer-1 (L1) protocol, and its native token, FTM, have experienced significant gains and notable achievements in the first quarter (Q1) of 2024.
According to a comprehensive performance analysis conducted by Messari, amid the emerging crypto bull market, Fantom has emerged as one of the major beneficiaries, showing significant growth in key metrics and market capitalization.
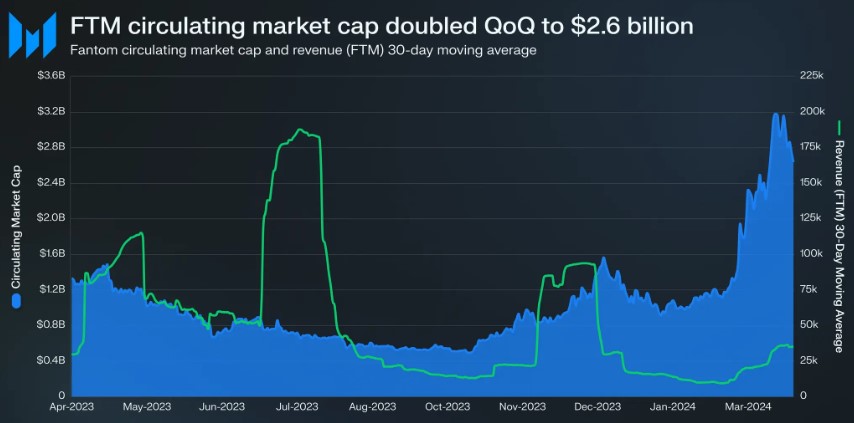
FTM Market Cap Soars 101% QoQ
By the numbers, FTM’s circulating market capitalization saw a substantial 101% quarter-over-quarter (QoQ) increase, jumping from .3 billion to .6 billion, vaulting it up ten spots to 48th among all tokens (currently 58th). The token’s rally extended for two consecutive quarters, resulting in a fourfold increase since the end of Q3 2023.
Although Fantom experienced a decrease of 53% QoQ in revenue measured in FTM, amounting to 1.8 million FTM, revenue denominated in USD exhibited a 4% QoQ increase, reaching .2 million.
According to Messari, the revenue decline was primarily due to reduced inscription activity across all smart contract platforms in Q1.
Despite this, Fantom maintained an upward trend in average daily transactions, excluding inscription-related activity, surpassing the Q3 average and reaching 247,000 daily transactions. Daily active addresses also rebounded, rising by 24% QoQ to 40,500.
In Q1, the staking requirement for Fantom validators was significantly reduced from 500,000 FTM to 50,000 FTM, aiming to increase accessibility. However, the number of active validators remained unchanged at 55.
Notably, the total amount of FTM staked increased by 17% QoQ, from 1.1 billion to 1.3 billion FTM, resulting in a 135% QoQ surge in the total dollar value of staked FTM, reaching .2 billion. Among proof-of-stake (PoS) networks, Fantom ranked 22nd in the dollar value of funds staked by the end of Q1.
Memecoin Mania Boosts Fantom On-Chain Activity
During the year’s first quarter, Total Value Locked (TVL) denominated in USD experienced a substantial 59% QoQ increase, rising from 0.8 million in Q4 to .28 billion.
Conversely, TVL-denominated in FTM decreased by 21% QoQ, indicating that the surge in USD-denominated TVL was partly attributed to FTM’s price appreciation.
Fantom’s average daily decentralized exchange (DEX) volume surged by 64% QoQ, from .2 million to nearly 6.8 million. In Q1, the “Memecoin Mania” trend contributed to elevated on-chain activity across various networks, including Fantom.
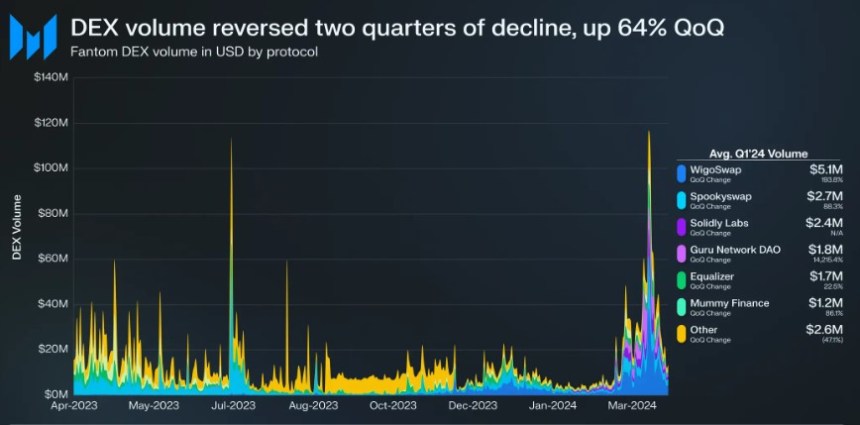
Fantom’s monthly DEX volume surpassed billion in March, marking the first time since March 2023. The number of DEXs on Fantom increased to 31 by the end of Q1, with no single DEX dominating more than 30% of the market share.
Lastly, following an exploit in the Multichain: Fantom Bridge, which affected stablecoins on Fantom in Q3 2023, the Fantom Foundation took steps to increase the liquidity of stablecoins.
As of Q1 2024, two independent third-party bridging solutions, Axelar (axlUSDC and axlUSDT) and LayerZero (lzUSDC and lzUSDT), have emerged. USDC remains the predominant stablecoin on Fantom, accounting for 98% of the stablecoin market cap. USDT also experienced considerable growth, with an 86% QoQ increase.
The FTM token is currently trading at .7037, reflecting an 8.7% increase in price over the past seven days. However, it has experienced a decline of nearly 20% in the monthly time frame.
Featured image from Shutterstock, chart from TradingView.com