 As ethereum continues its price fluctuations, technical indicators on the 1-hour, 4-hour, and daily charts suggest a bearish outlook with mixed trading signals. Despite some bullish undercurrents, the predominant sentiment remains cautious. Ethereum Ethereum’s (ETH) price action has shown a downward trend on the 1-hour chart, marked by a series of lower highs and lower […]
Bitcoin News
Bitcoin’s Bullish Trajectory Should Resume After the Halving, Analysts Say
 Global asset management firm Alliance Bernstein has explained that bitcoin’s bullish trajectory should resume after the upcoming halving event. The firm’s analysts described: “We believe it is always new demand catalysts that lead to bitcoin price appreciation in every cycle.” Bernstein’s Analysts on Bitcoin’s Price Post-Halving Global asset management firm Alliance Bernstein’s analysts Gautam Chhugani […]
Bitcoin News
From $90 To $400 Litecoin: Analysts Bullish On LTC Soaring Trajectory
Litecoin (LTC), the silver to Bitcoin’s gold, has enjoyed a recent price surge, leaving investors cautiously optimistic about its future trajectory.
Over the past week, LTC has seen a 13% increase, with its value hovering nearly at the time of writing.
This bullish run has been accompanied by technical indicators suggesting a potential continuation of the uptrend, but some analysts warn of lurking risks.
Potential Litecoin Price Bump In The Offing
One key driver of optimism is the apparent breakout from a bullish triangle pattern. This technical indicator, identified by popular analyst World of Charts, suggests a potential price surge in the coming months, with some analysts even predicting a climb to 0.
$Ltc #Ltc Breakout & Retest Has Already Confirmed Send It Towards 400$ Now https://t.co/6ZJxAgZjVJ pic.twitter.com/xW3xDrgHAZ
— World Of Charts (@WorldOfCharts1) March 26, 2024
Further fueling the bullish sentiment are on-chain metrics like the MVRV ratio, which suggests the coin might not be overvalued yet.
Additionally, a rise in Daily Active Addresses and transaction volume indicates increased investor activity and trading.
This is further corroborated by a bullish crossover on the MACD indicator and a rising Money Flow Index (MFI), both suggesting potential for further price hikes.
However, not all signals are green. The Network-to-Value (NVT) ratio, which indicates potential overvaluation, has also spiked alongside the price increase. This raises concerns about a possible price correction if the market deems LTC to be overvalued.
While the recent price action for Litecoin is encouraging, it’s crucial to maintain a balanced perspective, analysts caution. Technical indicators can be helpful, but they shouldn’t be the sole decision-making factors, they said.
LTC Hashrate Remains Stable
Meanwhile, the hashrate, a measure of computing power dedicated to mining LTC, has remained stable, suggesting no significant changes in miner activity. However, some analysts worry that a potential drop in hashrate could hinder future growth.
The overall picture for Litecoin presents both opportunities and challenges. The recent price surge and positive on-chain metrics are encouraging signs.
However, potential overvaluation concerns and conflicting technical signals urge caution. Investors should closely monitor both technical and fundamental factors before making any investment decisions.
The coming weeks will be crucial for LTC. If the uptrend continues and the price breaks through key resistance levels, a significant rally could be on the horizon.
If overvaluation concerns materialize or the broader market takes a downturn, a price correction could occur.
Featured image from Pexels, chart from TradingView
$1 Million per BTC by 2033: Predicting Bitcoin’s Price Trajectory Using the Power Law Model
 In an era where bitcoin’s value fluctuates wildly, a price model has emerged, offering a mathematical glimpse into its future price. The “Bitcoin Power Law,” suggests an interesting path for bitcoin’s price, rooted in the principles of algebra and natural laws. The model, representing a blend of science and finance, forecasts bitcoin’s journey to unprecedented […]
Bitcoin News
Optimism Price To Resume Bullish Trajectory To $3? Here’s How
The Optimism price appears to have struggled over the past week, with its recent bullish momentum seemingly waning. During the altcoin rally, the price of Optimism’s native token OP went from a low of .2 to a high of nearly .5 before experiencing a pullback.
While OP has managed to preserve a majority of its recently accrued profit, the cryptocurrency seems to be finding it challenging to continue its bullish trajectory. And the latest on-chain revelation suggests that there might be only one thing in the way of the Optimism price rise to a new high.
OP Price To Soar By 26% To .70, Crypto Analyst Projects
Popular crypto analyst Ali Martinez, in a recent post on the X platform, disclosed his bullish projection for the price of Optimism over the next few weeks. This prediction revolves around on-chain data from IntoTheBlock, which is based on the density of investors who purchased the OP token at certain price zones.
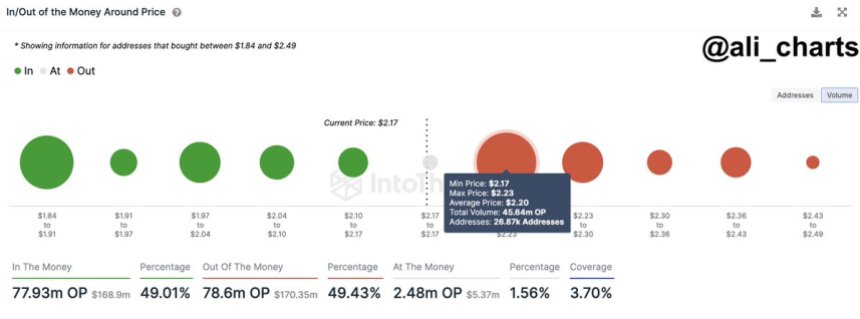
The chart above displays how the Optimism price zones around the current value look in terms of investor density. The size of the dot indicates the number of investors who bought the OP coin at each price range. Notably, the resistance or support at a price zone is more significant the larger the dot size of that price zone.
In his post, Martinez pointed out that the Optimism price is currently bouncing off a major resistance zone between .17 and .30. According to data from the analytics platform, roughly 27,000 addresses purchased a massive 45 million tokens within this range.
Martinez posited that the zone between .17 and .30 is one to watch out for, given the substantial buying activity within the price range. “A sustained close above could signal a bullish breakout, potentially propelling OP toward .70,” the crypto analyst said. This represents a more than 26% price growth from the cryptocurrency’s current value.
Optimism Price Overview
As of this writing, the Optimism price stands at .11, reflecting a 2.4% price decline in the past 24 hours. OP’s sluggish performance in the past day underscores the altcoin’s struggles over the past week.
According to data from CoinGecko, the Optimism price has barely changed in the past seven days. Although the cryptocurrency surged to a multi-month high of .46 earlier in the previous week, it has since faced some level of correction to trade around .10.
Nevertheless, Optimism still ranks amongst the top 40 cryptocurrencies in the sector, with a market capitalization of roughly .94 billion.
Bitcoin Still Stuck At $16,700, Why This Indicator Points To New Trajectory
Bitcoin has seen little to no action in its first two days of 2023; the cryptocurrency is bound for a spike in volatility, but in which direction? After experiencing months of downside pressure, there seems to be no room for further losses.
As of this writing, Bitcoin trades at ,700 with sideways movement in the last 24 hours. On higher timeframes, BTC’s price records similar price action. Other cryptocurrencies in the top 10 by market capitalization follow this trajectory.

Will History Repeat For Bitcoin? Pain Levels Max Out
According to analyst Will Clement from Reflexivity Research, the price of Bitcoin is approaching critical levels on its Net Realized Profit and Loss Over Market Cap. This indicator measures the capital gain or loss for the cryptocurrency.
As seen in the chart below, the metric is nearing levels of absolute capitulation when the crypto market and its participants are at their lowest. The industry approached a similar level in 2018 when BTC crashed from ,000 and Ethereum from ,400.
In 2014 and 2015, the metric dropped into this territory following the collapse of the biggest Bitcoin exchange in the world, Mt. Gox. Today, with the collapse of prominent crypto companies, such as FTX and Three Arrows Capital, the market is close to previous cycle bottoms.
Clemente said the following about this metric and its implication for the price of Bitcoin:
Capitulation, represented by net realized losses adjusted for market cap, is on-par with any prior macro Bitcoin bottom. Major pain is being felt in this market.

January Is The Worst Month To Expect Profits?
Despite the metrics and indicators pointing towards extreme market sentiment and capitulation levels, the timing might remain unfavorable for Bitcoin. The cryptocurrency might see further sideways price action and additional losses until there is a change in macroeconomic conditions.
Additional data from a pseudonym analyst indicates that January is historically a red month for the cryptocurrency. In the past two years, the returns for BTC in January were a historical exception.
Since 2015, the cryptocurrency has been trading in the red during January, recording some of its worst losses. 2023 could see BTC return to that dynamic, but this period of losses might precede two months of gains.

In February and March, Bitcoin saw its best performance, as seen in the chart. These historical gains might finally align with the extreme sentiment in the market and macroconditions.
Why EOS Downward Trajectory In Last 30 Days May Not Hurt Its Coin
Since its all-time high on August 22, EOS has been steadily declining. The crypto market had crashed from March to June, but has since recovered. The market crisis has a lingering impact on modern investing.
Coingecko reports that the token’s value has increased by 0.2% in the last 24 hours. Even on shorter time intervals, like the week or the biweek, the currency rose in value.
Nonetheless, these changes have done little to slow the downward trend. Investors and traders in EOS, though, may have reason to be optimistic.
The Stress Of September
As this is being written, EOS is being propped up by the .0055 area, which has slowed its decline since last month. The current price movement of the token is being influenced by the ongoing downturn.
The right side of the right triangle acts as a liquidity pool, and this is reflected in the coin’s price action as a XABCD harmonic pattern. As investors and traders buy the dip, demand is introduced, and the trend may turn bullish as a result.

Chart: TradingView
Meanwhile, the technicals also appear to be lacking. The CMF is currently negative, indicating that bears are in control of the market. This provides an undeniably formidable counterbalance to the potential bullish movement.
Immediate resistance at the 61.80 Fibonacci retracement level will be a challenging barrier to overcome.
Not Looking Good?
EOS’s predicament does not bode favorably for the alternative cryptocurrency. However, investors and traders can leverage a rising RSI, which indicates increased investor optimism.
Chaikin’s money flow index indicates that the token is gaining ground. The bears were rejected at the .9422 price range, which fits with the emerging upswing.
As of the time of writing, the Stoch RSI is on the overbought side of the indicator, indicating that the developing rally will be met by a market correction.
The EOS token is an excellent investment for traders and investors seeking to diversify their portfolios. Just last month, the cryptocurrency exchange PayBito added EOS to its list of tradable tokens, expanding EOS’s reach.
Investors should also be aware of the impact of macroeconomic conditions on EOS prices. The correlation between EOS and Bitcoin is 0.77, indicating a significant effect on EOS price fluctuations.
EOS total market cap at .15 billion on the daily chart | Featured image from Investment U, Chart: TradingView.com
Disclaimer: The analysis is based on the author’s personal knowledge and should not be construed as investment advice.
NewsBTC
Uniswap Coin’s Bullish Trajectory Sets UNI To Breach $7 Level – Time To Buy?
Upward trends in price charts bode well for Uniswap. CoinGecko reports that over the past 30 days, the token’s value has increased by 17.6 percent. The currency appreciated by 6.5% in value throughout the course of the week.
As of this writing, UNI is still in an uptrend, and there are indications that the bullish momentum will continue, pushing the price of UNI into or over the barrier mark.
UNI’s gains are only one example of the several cryptocurrencies that took advantage of the market turmoil caused by the recent CPI report.
Is the market getting carried away with its optimism, or can UNI’s positive momentum continue to the resistance level?
The Unicorn Spell
CryptoQuant reports that the token’s exchange reserve numbers are on the rise. That people are getting ready to sell again is a gloomy sign.
During the September 21st UNI rally, the coin was rejected at the price resistance level, providing evidence of this phenomenon.
Currently, the momentum indicator is at 0.062. This is barely above the 0 line of neutrality. The RSI indicator currently rests at 52.61 and 50.24 correspondingly, indicating a deceleration.
Even though the token’s movement is slowing, its predominant adherence to the XABCD shape may indicate more bullishness. However, the token has met a roadblock in its quest towards the price area.
The recent rejection of the token at .774 will present a difficulty in the coming days.
Has The Adjustment Phase Begun?
Chaikin’s money flow indicator shows that the bulls continue to control the market. At a value of 0.02, the bulls can use this to generate more momentum and eventually push the price towards .
However, if bears seize control of the market, the .993 support line is their greatest defense against a possible reversal.
Market corrections are typical for both stocks and cryptocurrencies. As a result of the rising level of foreign exchange reserves, investors and traders should be prepared for potential volatility in the next days or weeks.
UNI market cap at .8 billion on the daily chart | Featured image from Forkast, Chart: TradingView.com
Disclaimer: The analysis represents the author’s personal views and should not be construed as investment advice.
NewsBTC
Ethereum Marks Three Consecutive Red Weekly Closes, Will Uptober Change Its Trajectory?
Ethereum has been one of the cryptocurrencies that have received major support from the crypto community regardless of how the price performs in the market. Since the Ethereum Merge was completed, though, the digital asset has not performed as well as expected. ETH’s price has continuously bled out, which has led to its price relegating to the low ,000s. As the new month begins, speculations abound on whether the cryptocurrency has what it takes to recover.
Three Red Weekly Closes
Along with the rest of the crypto market, Ethereum’s price has suffered bitterly at the hands of the bulls. Once again, the curse of September reared its ugly head, and digital assets across the space saw more red than green during this time period. Ethereum itself had closed out the month with three consecutive red weekly closes, which has greatly impacted its performance in the market.
Over the last few weeks, the resistance to the digital asset has been mounting, and the bears have made a solid stand just above the ,400 level. This is evidenced by ETH’s inability to beat this point, even with some rise in momentum.
ETH sees three consecutive red weekly closes | Source: ETHUSD on TradingView.com
Interestingly, Ethereum’s chart looks eerily similar to the same trend that was recorded back in September of 2021. This had been in the middle of the bull market right before ETH had hit its all-time high above ,900. The digital asset had recorded three consecutive red closes, followed by a green close. What followed would be two months of weekly green closes that saw the cryptocurrency surge by more than 48%.
If this trend holds and Ethereum is able to successfully break through the ,400 resistance point this week, then ETH’s price could rally to ,800 over the next two months before eventually losing steam.
Can Ethereum Hold Up?
The weakness of ETH following the Merge has done a number on not only the digital asset but on investor sentiment. The majority of investors still opt to hold their coins for the long term. However, the sell-offs continue to wax stronger at this time.
Mainly, all eyes are on the Ethereum staking contract, where more and more of the supply are being sent each day. The contract currently sits at more than 14.1 million ETH are already staked, accounting for about 12% of the total supply. And since there is presently no way to withdraw these ETH, they are temporarily taken out of circulation, causing a significant drop in supply.
Nevertheless, the majority of ETH investors are still in profit despite the current low prices. This 53% of investors who have mostly held their coins for longer than a year remains in the green. However, profit-taking continues with exchange inflows reaching .49 billion for the last 7 days compared to outflows of .44 billion.
Featured image from El Cronista, chart from TradingView.com
Follow Best Owie on Twitter for market insights, updates, and the occasional funny tweet…
Polygon (MATIC) Downward Trajectory Faces Resistance At $0.94 Level
Even with the encouraging reports of Polygon closing agreements and becoming one of the most acquired tokens by ETH whales, the future of its native token, MATIC, is not looking very bright.
From September 13 onward, it fell in line with the rest of the cryptocurrency market. The 7–12 September rise was ultimately denied by bears at the .9403 resistance area.
With the same 5-day time frame since then, the token’s value has plummeted by a staggering 20.65 percent. At the time of writing, the token’s price was hovering around the 78.60 Fibonacci retracement level, between .6898 and .7770.
Traders should keep an eye on both the 61.80 Fib level (now at .6989) and the 0.7185 support level. These two factors have counteracted the downward trend and given the upward momentum at the hourly marks some much-needed support.
Chart: TradingView.com
Polygon Bullish Momentum Hints At Demand
Also, bullish momentum appears to be building around the 1-hour time frame. Increases in the Stoch RSI value indicate that demand for the cryptocurrency is increasing.
In addition, the momentum indicator shows that the trend is rising. A larger amount of momentum produced here, though, can have a major impact on the wider picture.
This minor rising trend may be attributable to the expanding development activities in the Polygon chain. This increase in development activity may indicate that the team is integrating new features or patching existing ones, according to a recent analysis.
This further increases investor and trader confidence. As the crypto market recovers after the 13 September sell-off, however, the recently announced partnership between Polygon and Flipkart may accelerate the acceptance of MATIC and contribute to the expansion of the Polygon ecosystem.
MATIC Price: Potential Buy Pressure
In light of this, might recent advancements at Polygon inspire confidence? Indeed, it accomplished exactly that. However, recent advancements were not the primary cause of the price increase.
As the price declined, the indications also pointed to a strong buy signal. The bull-bear indicator reveals the same information. As bulls gain momentum, the Stoch RSI will also rise, indicating a major increase in buy pressure.
This may have an effect on MATIC’s total recuperation. If the bulls are able to stabilize at the 71.80 Fibonacci level, another bullish rise may be conceivable to support the price’s upward momentum.
The price range of .7395 represents the primary level of resistance on this chart. If the bulls gain pace and break through this level of resistance, the MATIC token could be on the verge of a recovery.
MATIC total market cap at .9 billion on the daily chart | Source: TradingView.com
Featured image from Coincu News, Chart: TradingView.com
NewsBTC