 Recent figures show that over a span of 44 consecutive days, 76,179 bitcoins, worth .41 billion, have been moved out of Coinbase and Binance, the two leading cryptocurrency exchange and custodial firms by reserve size and total trade volume. Robinhood Bucks Trend With Bitcoin Inflows as Coinbase and Binance Face Outflows A significant volume of […]
Bitcoin News
Cardano To Shed Its Gains? Profit-Taking Spikes To High Levels
On-chain data shows the profit-taking among Cardano investors has spiked to high levels, a sign that the asset may register a decline in the coming days.
Cardano Has Observed High Profit-Taking After The Rally
According to data from the on-chain analytics firm Santiment, AAVE, ADA, and CRV are among the altcoins that have recently observed the most extreme profit-taking.
The relevant indicator here is the “ratio of daily on-chain transaction volume in profit to loss,” which, as its name suggests, tells us about how the profit-taking volume of any cryptocurrency compares with its loss-taking volume.
This indicator works by going through the on-chain history of each sold coin to see what price it was last moved at. If the previous selling price for any coin was more than the current value it’s being moved at, then its sale contributes to the loss volume. Similarly, the sale would count under the profit volume if it were otherwise.
When the value of this metric is positive, it means that the profit-taking volume is more than the loss-taking volume right now. On the other hand, negative values suggest the dominance of the loss-taking volume.
Now, here is a chart that shows the trend in this indicator for Cardano, Aave, and Curve over the past month or so:
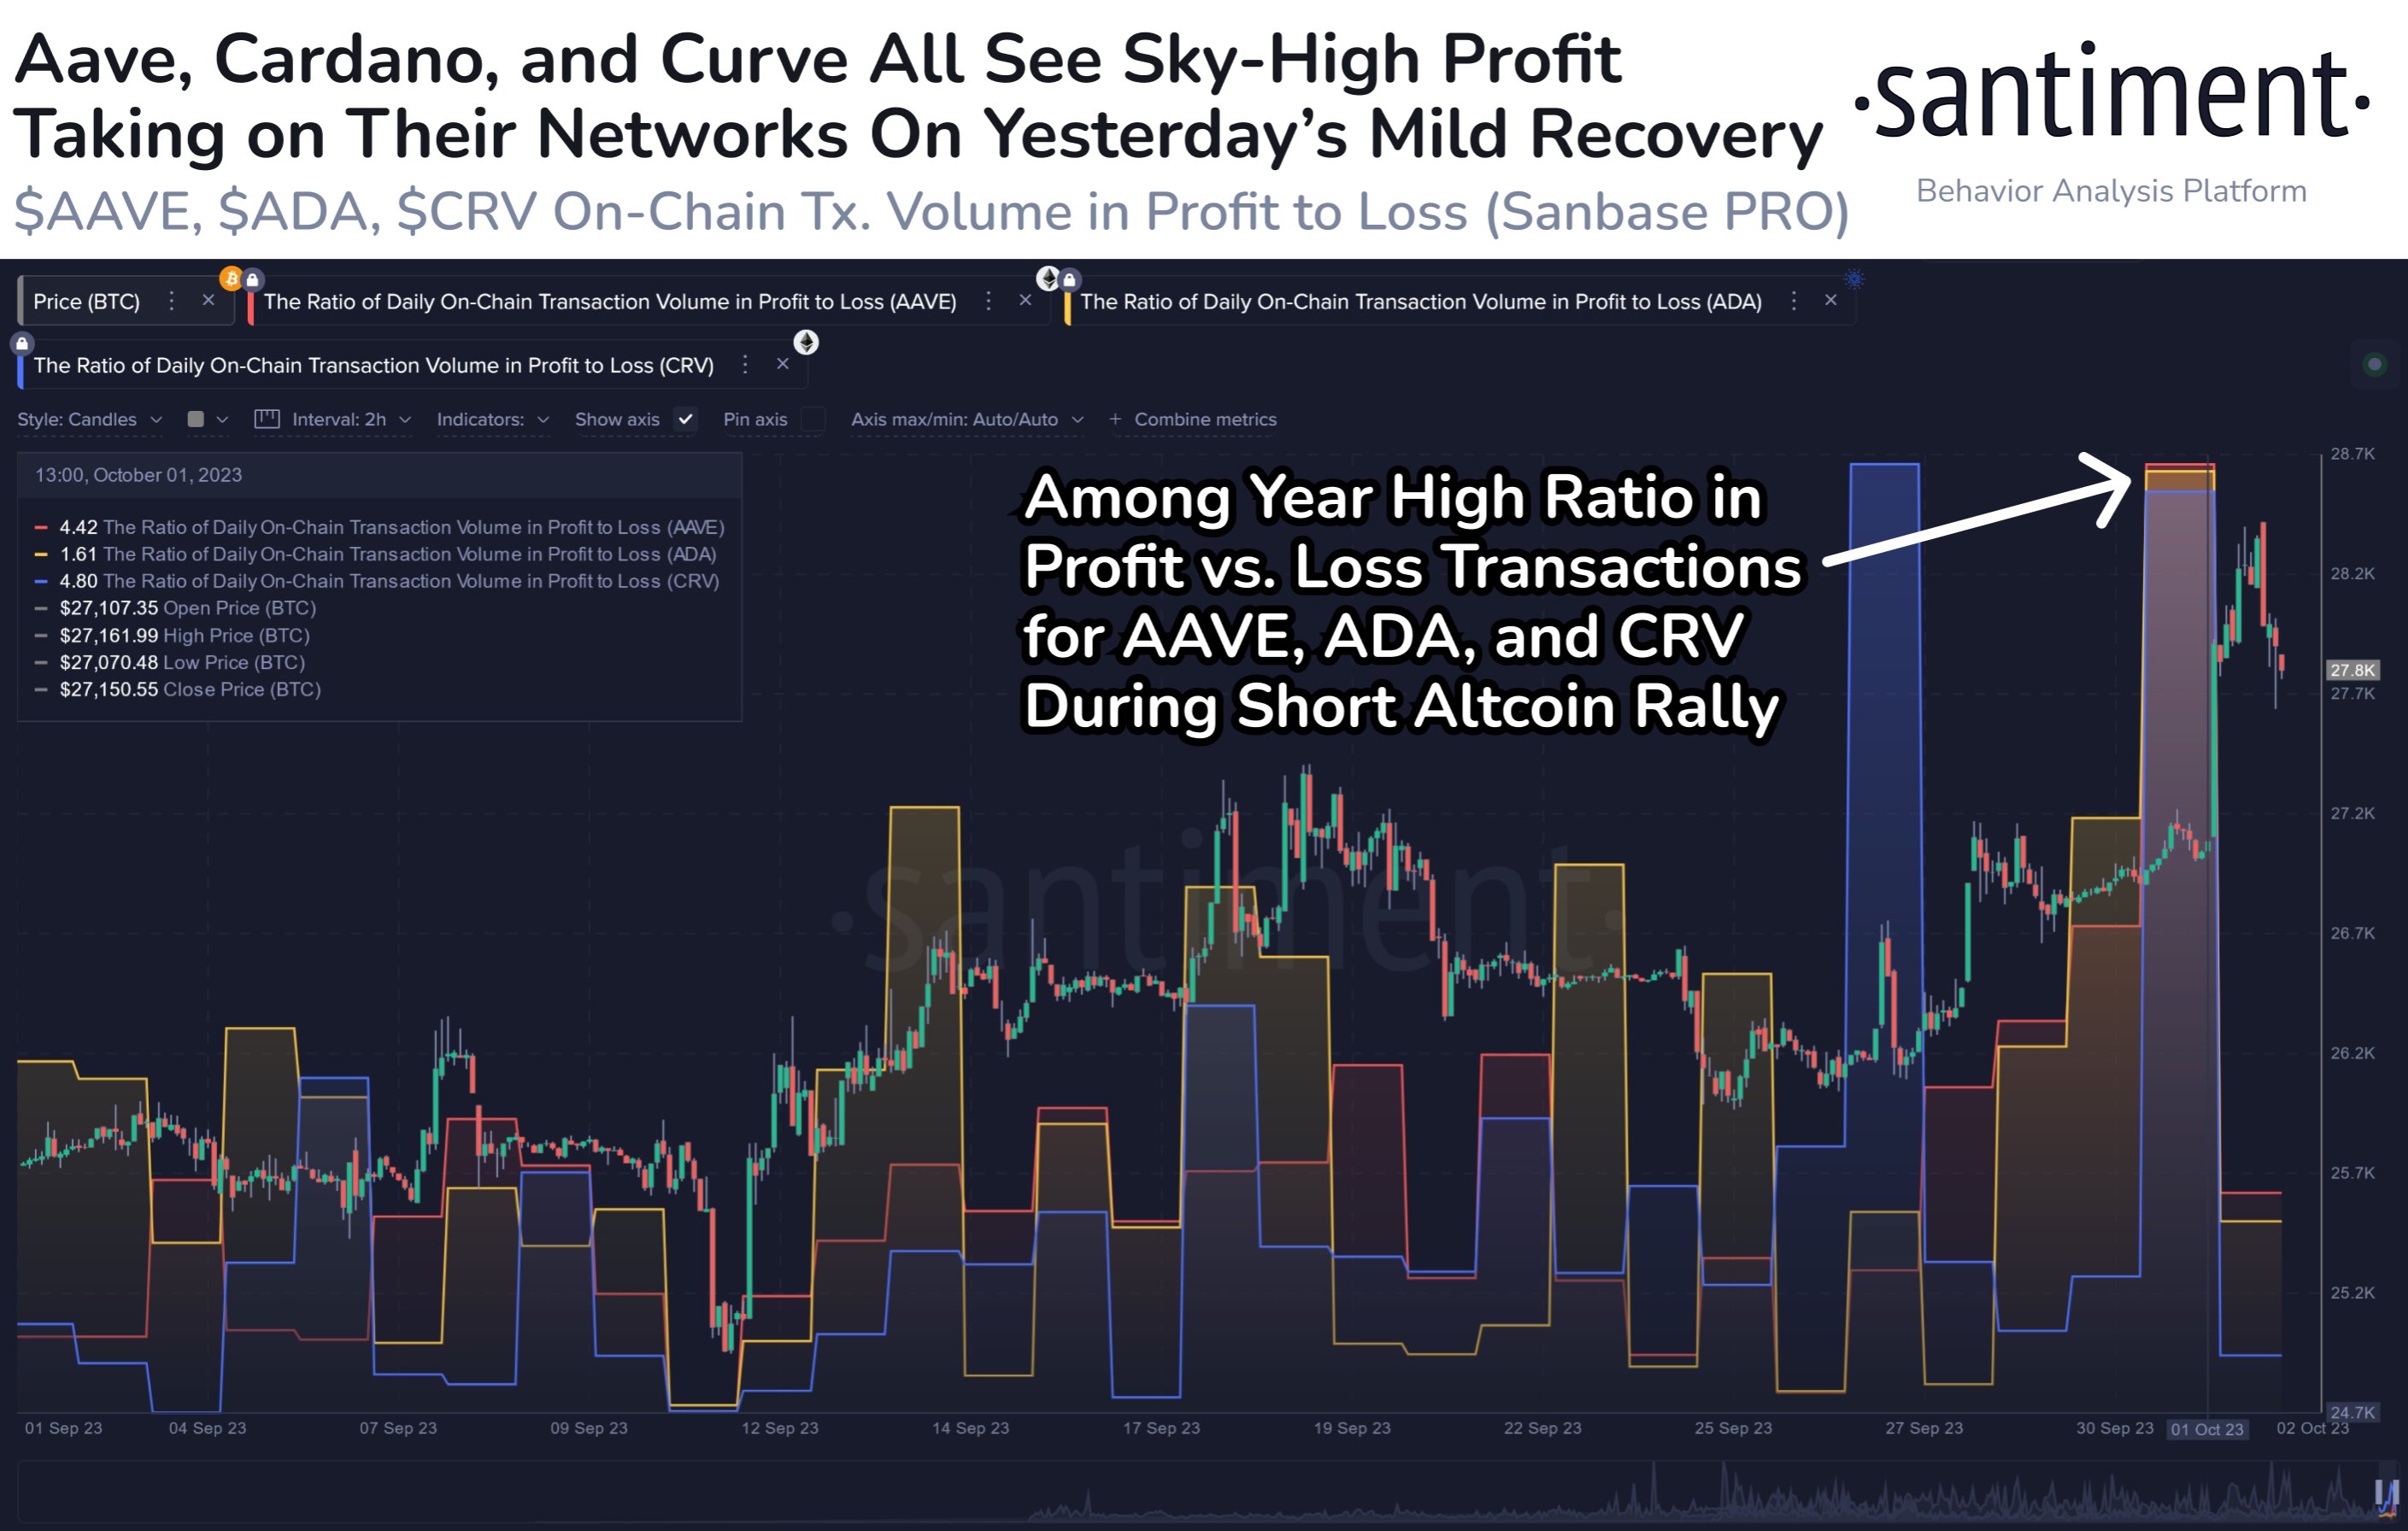
As displayed in the above graph, the indicator appears to have observed a large spike recently for all three of these altcoins. During the peak of this surge, the metric’s value had been among the highest levels observed in the year so far.
This interest in profit-taking occurred after these cryptocurrencies had observed their respective rallies, following Bitcoin’s surge beyond the ,000 mark.
This extreme profit-taking spree has hit Curve the hardest, as the cryptocurrency has plunged almost 7% during the past day. Cardano has held onto some of its recoveries, as the decline has only been about 2%.
Aave has not felt any negative effects from this profit-taking, as the cryptocurrency price has mostly continued to move sideways in the past day.
While ADA has shown some strength against the profit-taking, it’s still a concerning sign for the asset that its modest recovery rally has instigated such an extreme reaction from the market.
It would seem possible that some of the investors had been waiting for an exit opportunity, however small, and once they got it in the form of this surge, they swiftly sold their coins. If the profit-taking continues in the coming days, Cardano may retrace more of its recovery.
ADA Price
Cardano had approached the .27 level at the peak of this rally, but since then, the asset has slumped back toward the .26 mark.
Bitcoin Whales Continue To Shed Holdings, Prices Not Attractive Enough?
On-chain data shows Bitcoin whales have continued to shave off their holdings in recent weeks, suggesting that the current lows may not be attractive enough to them.
Bitcoin Whales Continue To Sell Despite The Recent Deep Lows
As pointed out by an analyst in a CryptoQuant post, the number of investors with balances in the 1k to 10k BTC range have continued to decline recently.
The relevant indicator here is the “UTXO Count – Value Bands,” which tells us about the number of UTXOs (or wallets) that are currently in each Bitcoin value band.
These value bands are groups that define ranges between which the balances of UTXOs falling into said bands lie. For example, the 100-1k BTC value band includes all UTXOs (or wallets) that currently have between 100 and 1,000 coins.
The value band of interest in the current context is the “1k-10k BTC” group. Here is a chart that shows how the UTXO Count of this value band has changed over the last several months:
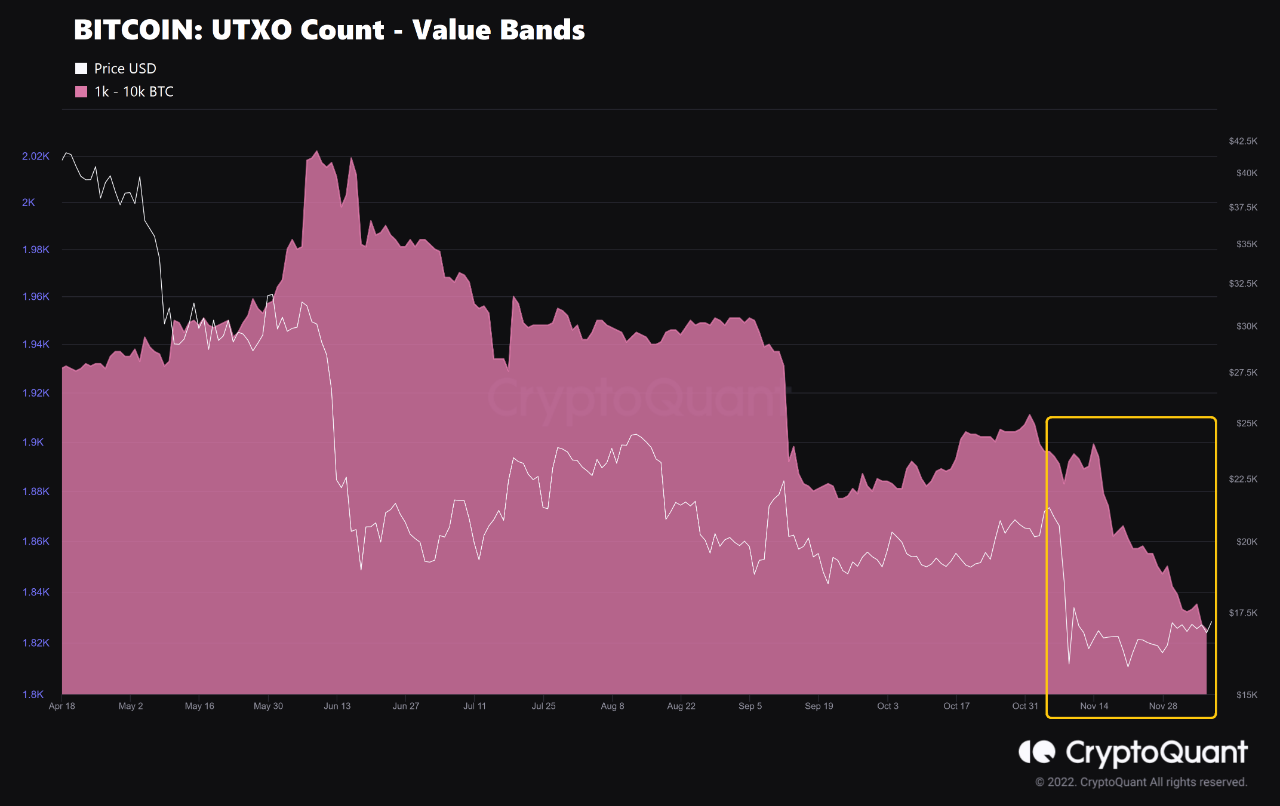
As you can see in the above graph, the Bitcoin UTXO Count for the 1k-10k BTC value band has observed some steep decline over the past month.
Wallets with such large balances usually belong to the whales. This means that the holdings of these humongous holders have gone down in this period.
This entire latest decline has come following the crash caused by crypto exchange’s FTX collapse, which means whales have sold their coins while the prices have been hitting lows.
Historically, whales have shown accumulation behavior as bear markets have bottomed out. But recently instead of seeing an increase or even sideways movement, the UTXO Count of this whale value band has been strangely decreasing.
This trend could be a sign that whales are still not finding the current lows attractive enough to buy more, and that they may rather be selling off their reserves as they expect the bearish winds to continue further.
BTC Price
At the time of writing, Bitcoin’s price floats around .2k, up 1% in the last week. Over the past month, the crypto has lost 7% in value.
Below is a chart that shows the trend in the price of the coin over the last five days.

Bitcoin has been stuck moving sideways around the k level recently, but at the moment it’s unclear when some real volatility may return to the crypto.
Bitcoin Price Threatened By Sticky Inflation, CPI Print To Shed More Light
Hovering at a range between ,800 and ,500, the Bitcoin price is chopping out short and long positions. The current dynamics in the market have been determined by macro forces leading BTC to extreme as it approaches a major economic event.
The Consumer Price Index (CPI) for September is poised to operate as one of these events. In the past months, these reports, used by the U.S. Federal Reserve (Fed) to benchmark inflation, have been followed by spikes in volatility.
At the time of writing, the Bitcoin price trades at ,100 with sideways movement in the last 24 hours and a 6% loss in the past week. BTC’s price action has been dragging the crypto market down with it as market participants for digital and traditional assets brace for volatility.
BTC’s price compressing as volatility declines on the daily chart. Source: BTCUSDT Tradingview
Bitcoin Price Squeeze Incoming? CPI Print Will Be Decisive
Senior market analyst at Cubic Analytics, Caleb Franzen, shared his thoughts on the upcoming CPI report. Today, the U.S. government published its Producer Price Index, one of the most important inflation benchmarks in this country.
The PPI has been accelerating, Franzen said, from 6.5% in August to 6.8% in September, beating expectations and hinting at higher inflation reflected by the upcoming CPI print. The PPI is far from its yearly low at 9.2%, but as the analyst said, the upside trend reflects the “stickiness” in inflation and might signal the U.S. Fed to adopt a more aggressive monetary policy.
PPI Final Demand Services accelerated on a YoY basis in the latest producer price index data.
For Aug.’22, the YoY change was +6.5%
For Sept.’22, the YoY change was +6.8%It’s down considerably from the March 2022 peak of +9.2%, but highlights the stickiness & impact of wages. pic.twitter.com/zrlzfS3SNT
— Caleb Franzen (@CalebFranzen) October 12, 2022
In that sense and taking a deeper look into the factors contributing to high inflation, Franzen notes a “tug-of-war” between inflationary and deflationary forces. Overall, the reduction in energy prices, and the dropped in the price of oil and fossil fuels, might turn the tide in favor of mitigating inflation.
But this scenario is currently uncertain, thus influencing the decision of the Fed, which in turn negatively impact the Bitcoin price and the performance of legacy financial assets. This upcoming CPI might reflect this uncertainty, the analyst argued:
I expect to see month-over-month CPI be relatively unchanged, almost certainly ±0.2%. On a YoY basis, I think +8.0% or greater is near certain; though I expect to see core CPI, median CPI, & trimmed-mean CPI accelerate relative to their August results.
Will High Inflation Become The New Normal?
This could allow the Bitcoin price to experience a relief rally on low timeframes dissipating the current uncertainty in the nascent asset class. If this happens ,500 is bound to continue operating as critical resistance and short-term headwind.
After the CPI Print, the upcoming Federal Open Market Committee is bound to bring more volatility to the market. As noted by the trading desk QCP Capital, these events have led the Bitcoin price to positive performance.
In the chart below for the BTC/USD trading pair during the FOMC, there has been a short-term rally followed by major crashes. However, as the market prices in a more hawkish Fed and more inflation, these sudden price action become less powerful.
Will BTC finally be able to break out of its current range or will simply see another short-lived rally?
Source: QCP Capital via Twitter
NewsBTC
Cardano (ADA) Could Shed Another 14% Off Its Price – Here’s Why
Cardano (ADA) declined significantly over the past few days, resulting in a price drop of 22.6%.
- ADA price seen losing another 14% in the coming days
- Cardano buyers drop support at the 20-day EMA
- ADA intraday trading volume registers a 104.6% gain
The expanded selling activity results in the offshoot of the critical supporting EMAs that are attempting to break the support zone of .45. So, this provides an opportunity for buyers to take advantage of price drops.
Cardano Shows Bullish Reversal
The ADA/USD price shows a bullish reversal swinging from .4 forming a rising channel pattern with a price spike of 47.5%. On the other hand, the price rejection presents at the $.595 level support the 22.6% price decline; that shreds below the support trendline.
As of this writing, ADA price shows a bearish movement as it trades at .4551 or a decline of 3.07%, according to CoinMarketCap.
On the daily chart, the ADA price demonstrates the formation of a triple black crow pattern that shows some significant struggle with hedging on support .45.
Chart from TradingView.com
More so, the intensified selling pressure is apparent especially with the sudden surge in intraday trading volume plus the appearance of long-wick candles.
The bearish continuance seen over the daily chart strengthens the possibility of ADA having a downtrend or falling below the key support zone of .45.
With that in mind, a short-selling opportunity could arise with the shackling of the key support zone with the opportunity of a 13% decline to revert to July’s low that registered at .4.
ADA Price Remains Bearish
On the other hand, if there is a price rejection that coincides with the bullish reversal on the .45 support zone, then this could trigger a price increase that hovers above the 50-day EMA.
RSI for ADA shows a dramatic increase in the coin’s bearish character as it plunges below the 14-day half line or average line.
A few days ago, ADA created this fake breakout that caused confusion for market participants. It was observed that ADA price rose to .55 and then dipped below in a few days time registering a week’s loss of 12.9%. With these figures, ADA is seen to fall below the mark especially this August.
General outlook for Cardano remains extremely bearish. The MACD signals also show that ADA price may revisit its lows seen on mid-July with the ongoing correction.
BTC total market cap at .25 billion on the daily chart | Source: TradingView.com
Featured image from Freepik, Chart from TradingView.com
NewsBTC
Not-So-Diamond-Hands: Bitcoin Long-Term Holders Have Shed 150k BTC Since LUNA Crash
Data shows the total supply held by the Bitcoin long-term holders has decreased by 150k BTC since the LUNA crash.
Bitcoin Long-Term Holders Have Dumped A Noticeable Amount In The Last Few Months
According to the latest weekly report from Glassnode, the BTC LTHs have observed a sustained decrease of 150k BTC since the crash in May.
The “long-term holder” (or LTH in brief) group is the Bitcoin cohort that includes all those investors who have been holding onto their coins since at least 155 days ago, without selling or moving them. The holders who sell earlier than this threshold are called the short-term holders (STHs).
LTHs are generally the most resolute investors in the market and thus large selling from them doesn’t happen too often. Generally, the more amount of time a holder has held their coins for (that is, the more aged the LTH has become), the less likelier they become to sell at any point.
Here is a chart that shows the trend in the total Bitcoin supply held by these LTHs during the past year:
The value of the metric seems to have been trending downwards in recent months | Source: Glassnode’s The Week Onchain – Week 33, 2022
As you can see in the above graph, the Bitcoin supply owned by LTHs seems to have been mostly moving sideways since around November of last year.
The indicator set a high during the month of May of this year, but since then the metric’s value has been on a steady decline.
The beginning of this sell-off from the LTHs seems to have been around the LUNA and UST collapse, an event that triggered a market-wide crash in crypto.
The report notes that the current 155-day long-term holder threshold lies in March, when the price of Bitcoin observed its first relief rally to k since the decline from the all-time high.
While the latest selling from the LTHs amounts to just 150k BTC, which is quite small compared to their total supply of around 13.4 million BTC, the report explains that the LTH reserve doesn’t have to significantly decrease for the cohort to go through a capitulation event.
Related Reading: Flippening Forewarning? Ether Options Overtake Bitcoin As The Top Crypto To Trade
In past such capitulations, the LTH supply has only slightly decreased with the weakest investors being eliminated, and stronger accumulation filling up for them.
BTC Price
At the time of writing, Bitcoin’s price floats around .4k, down 4% in the past week.
Looks like the value of the crypto has been going down in the last few days | Source: BTCUSD on TradingView
Featured image from Dmitry Demidko on Unsplash.com, charts from TradingView.com, Glassnode.com
NewsBTC
ApeCoin Shed $2.5 Billion From Its Market Cap In May – Investor Appetite Fading?
The month of May’s crypto market disaster did not fail to bring down along with it one of the “rising stars” in the crypto space, ApeCoin.
ApeCoin price has shown a robust performance in the face of the crippling crypto market crash. However, the bulls were still able to lift APE by about 50% higher from the coin’s low at .11.
As of this writing, APE was trading at .25, up 4.1% in the last seven days, and selling just below the newly established swing high at .35.
Suggested Reading | Bitcoin Steady Above K After Drop To K – A Slow Climb To Green?
ApeCoin Market Cap Down By Half
Thursday’s data from Coingecko indicates that ApeCoin is among the top 50 crypto assets by market capitalization, having closed May with a market value of around .27 billion.
As a result of the decline in the value of other digital currencies, this amount appears large, but it reflects a 56 percent decline from its market value. APE’s high trading volume of .37 billion as of May 1 translated to a market value in excess of .55 billion.
A high volume of liquidation by coin holders rose on May 1 and accelerated from May 9 to 13, contributing significantly to the decrease in APE’s market value.
Experts say this is because of the broader geopolitical and global climate, including uncertainties in the ongoing war in Ukraine, among other factors.
Factors Contributing To APE Price Decline
It’s not just in the crypto field that things are not looking bright. Living expenses are growing, interest rates are rising, a recession is approaching, and inflation is skyrocketing. The US S&P 500 is currently in a bear market, and stock markets are shaky as well.
APE total market cap at .27 billion on the daily chart | Source: TradingView.com
According to a number of market analysts, these are some of the causes chipping away at the value of APE.
On May 1, APE began at .02, achieved an intraday high of .04, dropped 21 percent to an intraday low of .69, and ended at .97.
As a result of losing more than one-fifth of its value on the first trading day of the month, APE was unable to recover and continued to fall throughout the rest of May, reaching new lows.
Suggested Reading | Dogecoin Price Jumps As Elon Musk Reiterates Support For Meme Crypto At Qatar Forum
APE began trading on May 1 at .02, achieved a monthly top of .04 on the same day, hit a monthly low of .25 on May 11, and finished the month at .76.
This represents a 66 percent decline between the opening and closing prices of APE in May.
Featured image from Gravitate.news, chart from TradingView.com
NewsBTC
Dogecoin Shed 91% Of Its Value Since 2021 High – A Musk Tweet To Pump DOGE?
The Dogecoin army has been closely monitoring the meme coin’s depreciating value week by week. DOGE has lost an enormous amount of value from its all-time high on May 8, 2017, despite the fact that it remains one of the top 12 cryptocurrencies.
Monday’s Coingecko statistics reveals that DOGE is trading at .054143, a decrease of 34% over the previous week. More than a year ago on this date, DOGE was trading at .739 per unit. Today, the 24-hour price range for this cryptocurrency asset is between .064 and .07 per coin.
Dogecoin is widely regarded as the first “meme coin,” having been founded as a joke by Jackson Palmer and Billy Marcus in 2013 to poke fun at the abundance of altcoins flooding the market.
Suggested Reading | Ether Drops Below ,400, Pummeled By US Inflation And Difficulty Bomb Setback
Dogecoin And Its Lost Glory
As of this writing, the market capitalization of Dogecoin is .68 billion, which represents 0.755% of the .15 trillion crypto economy. DOGE is ranked below Solana (SOL) and Polkadot (DOT) in terms of market position, despite having the 11th biggest market capitalization (based on Monday’s Coingecko chart)
DOGE is down over 91% since Elon Musk’s performance on Saturday Night Live on May 8, 2021. That evening, Musk delivered a series of monologues and skits that frequently mocked Dogecoin.
The price of Dogecoin has continuously risen as a result of Musk’s amusing tweets. Image source: Complex.
The dog-themed coin then quickly drew the attention of the billionaire Musk who, ironically, began tweeting about it. Throughout 2020 and the first few months of last year, Musk’s humorous tweets regarding Dogecoin consistently caused its price to increase.
During this period, the coin attracted a group of ardent supporters known as the “Dogecoin Army,” whose declared objective was to bring the coin’s price above or, as Musk touted it, “over the moon.”
Many believed Musk’s debut on SNL would be effective. Regrettably, it did not.
Can A Musk Tweet Give DOGE A Shot In The Arm This Time?
Even though DOGE is down 91 percent from its all-time high, it is still up an amazing 75,260 percent since the asset’s all-time low on May 6, 2015. At that time, one DOGE was worth .00000869 cents. Recent market performance for the coin has not been encouraging, as the DOGE price has decreased by 79.4 percent over the past year.
DOGE total market cap at .20 billion on the weekend chart | Source: TradingView.com
After a massive bull run in 2020 and 2021, the crypto market has been volatile all year, but “Crypto Winter” would soon set in during the first week of May, when major currencies plummeted alongside the stock market.
Suggested Reading | Bitcoin Takes A Beating At K As Crypto Economy Settles Just Above Trillion
Along with the U.S. Consumer Price Index report for the month of May, which showed consumer goods prices climbing 8.6 percent compared to May 2021, the drop continued this past week. This is the biggest year-over-year inflation figure since 1981.
Meanwhile, some are wondering if the “Musk influence” is still there to lift DOGE out of the doldrums and let it make noise again like it did during its heydeys.
Featured image from Chain Debrief, chart from TradingView.com
NewsBTC
Dogecoin Market Cap Shed $6-B Last Month – Will Bearish Pressure Continue The Pulldown?
Dogecoin was one of the cryptocurrencies that took a heavy blow from a market crisis that broke out in March, resulting in a precipitous decline in its market capitalization.
According to a chart by Coingecko on Friday, Dogecoin (DOGE) is trading at .079378, a decrease of 4.1% over the past week. Its most recent price activity resulted in a market cap of ,637,807,407 USD.
The popular cryptocurrency inspired by memes finished the month of May with a market cap of approximately .4 billion.
Dogecoin Market Cap Down 35%
Dogecoin’s market capitalization decreased from May 9 to May 13 as a result of a general bearish market that intensified throughout this period. Increasing interest rates, inflation, and the preference for less volatile assets such as metals were among the economic variables that led to a major selloff of DOGE.
Suggested Reading | Axie Infinity Revenue Continues To Collapse – Here’s Why
Meanwhile, recent attention has been drawn to Dogecoin as a result of Elon Musk’s potential purchase of Twitter.
Reportedly, the social media platform is providing the billionaire with data that covers the more than 500 million tweets posted each day, potentially putting closure to the Tesla CEO’s contention.
After Musk first said that he would spend billion to buy Twitter, the market value of Dogecoin went up by about billion, from .45 billion to .35 billion in 10 days (Financial Times).
This week, Musk cast more doubts on whether he will complete a billion agreement to acquire the social network.
The closing market cap for Dogecoin in May was 35 percent lower compared to the opening day market value for the month. DOGE saw a robust trading volume of 1 million which corresponded to a market cap of roughly billion.
Nearly two weeks later, DOGE started at .08464 and closed at .07004. The trading volume of the memecoin was roughly .63 billion, which amounted to a market capitalization of approximately .97 billion. Since May 1, DOGE’s market value has decreased by 37 percent.
DOGE total market cap at .5 billion on the weekend chart | Source: TradingView.com
Musk’s Twitter Reveal Boosts DOGE Market Cap
Following Musk’s initial reveal of his billion Twitter acquisition, Dogecoin’s market valuation jumped by about billion, from .45 billion to .35 billion, in 10 days.
Suggested Reading | Bitcoin Market Cap Shed Over 0-B Last Month – How Much More Can It Lose?
Since then, however, the price of DOGE has decreased alongside the broader cryptocurrency market, particularly as Bitcoin plummeted below ,000, dragging the bulk of altcoins down with it.
Dogecoin began May at .1276, reached a monthly high of .1373 four days later, touched a monthly low of .07004 on May 12, and ended the month at .08586.
Featured image from The Motley Fool, chart from TradingView.com
NewsBTC
Bitcoin Market Cap Shed Over $120-B Last Month – How Much More Can It Lose?
The market value of Bitcoin dropped and was at roughly 5 billion at the end of May. BTC is currently trading below the ,000 mark because of the bearish stance of the market.
Last month, Bitcoin was beaten to a bloody pulp with the crypto market crash, triggering the top crypto’s market value drop. And it’s not just the crypto that bore the brunt of the pounding. Other popular cryptocurrencies had the same fate.
But if you look at the good parts of a bad situation, BTC remains the king in terms of market cap in June 2022. The coin has concluded May with a market cap of 5.8 billion.
If you compare June stats with BTC’s May 1 opening day market value, you’ll see how it has declined by 17%. The May 1 trading value had a market cap of 2 billion and a trading volume commensurate to billion.
Suggested Reading | Crypto Community Sees Nearly 80% Upside For Ethereum By End Of June
Bitcoin Remains Bullish
Bitcoin had shed more than 50% of its value, which was seen at its all-time high in November 2021 before the crypto market spiraled downwards. Its fall was then followed by the fall of Terra, which has further maimed the crypto industry.
The bullish or weakened sentiment has spread fear and uncertainty among investors. A lot of investors panicked and withdrew their money.
Both BTC and Ethereum, the two leading digital assets in the crypto market, have slumped by more than 40% since November of 2021. BTC price has been highly volatile over the past couple of months, and investors feel the agitation.
On the brighter side, with crypto set at ,000, investor confidence has been restored with the consolation that crypto has somehow stabilized.
More Fluctuations In The Coming Months?
On the other hand, experts believe that Bitcoin will face more fluctuations in the coming months. Sadly, the entire crypto market cap has been down by as much as 43% over the past two months. But, there is hope for the market to reclaim lost glory when specific metrics are met.
A bearish crypto market is not one that investors would like to venture into, but you have to take the good with the bad in the crypto space. A bearish stance has its benefits because it gives investors more time to assess their investments and check other projects that can go up once the prices climb again.
Suggested Reading | Bitcoin Records 1st Weekly Green Candle In 3 Months – A Start Of A Bull Run?
Bitcoin’s opening on May 1 bolstered to ,713 and went further up with a monthly high of ,789. It, however, tested low on May 12 at ,350 on May 12, before it closed the month of May with a trading price of ,792.
This gives BTC a 15% reduction between the opening and closing stats for the BTC price in May.
Featured image from Nairametrics, chart from TradingView.com
NewsBTC