 Makerdao, a leading decentralized finance (defi) protocol, has revealed new concepts to its Endgame plan, introducing two new stablecoins: newstable and puredai. This strategic initiative aims to replace the existing DAI stablecoin and bolster the Makerdao ecosystem. Maker’s Endgame Plan Brings Newstable and Puredai to Replace DAI Makerdao, a decentralized autonomous organization (DAO) known for […]
Bitcoin News
Tens of Thousands Show Overwhelming Support for Abolishing the Fed, US Policymaker’s Poll Reveals
 On May 15, Thomas Massie, a Republican member of the United States House of Representatives, posted on X, inquiring whether he should introduce legislation to abolish the U.S. Federal Reserve. The poll garnered over 115,000 votes, with a significant 86% majority opting to “end the Fed.” Rep. Thomas Massie Questions Introducing Bill to Abolish U.S. […]
Bitcoin News
Bitcoin Analyst Reveals Why $57,938 Is The Level To Watch This Week
Crypto analyst CryptoCon has revealed a key level to watch out for as Bitcoin attempts to break critical resistance levels. The analyst suggested that a drop to this price level may not be bad for Bitcoin and could instead be necessary for it to finally make that price rally.
,938 Is The Price Level To Keep An Eye On
CryptoCon mentioned in an X (formerly Twitter) post that ,938 is the “new price to watch for the 20-week EMA (Exponential Moving Average).” He noted that such a price drop might be necessary, stating that “boredom and sideways price action allow room for growth.” Based on his analysis, any potential price decline that Bitcoin experiences is a healthy correction and shouldn’t be considered a bearish reversal.
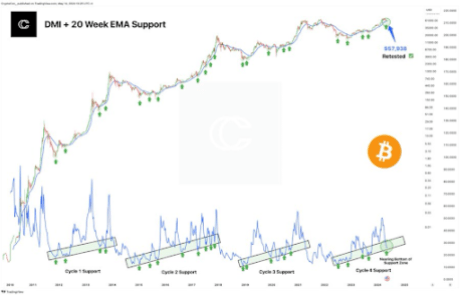
Meanwhile, Bitcoin is showing impressive strength on the charts, with CryptoCon stating that the flagship crypto “continues to hold the 20-week EMA as support while visiting the almost absolute bottom of the cycle 4 DMI support zone.” CryptoCon’s positive outlook for Bitcoin provides assurance that a parabolic move is still on the horizon.
Crypto analyst Rekt Capital also recently shared a positive outlook for Bitcoin. He revealed that Bitcoin was out of the “Danger Zone,” suggesting that the flagship crypto was primed for a move to the upside. The analyst also remarked that Bitcoin was running out of unremarkable months before it began its parabolic phase.
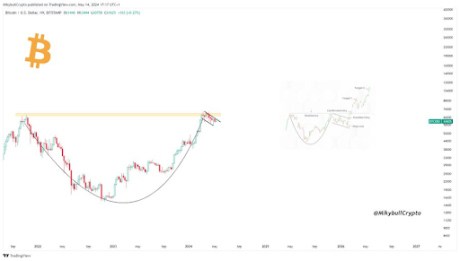
Crypto analyst Mikybull Crypto hinted that Bitcoin was already showing signs of this imminent parabolic phase. In an X post, he mentioned that Bitcoin was displaying a cup and handle reversal pattern on the weekly chart and that the “breakout will be explosive and will send it to a cycle top.”
While agreeing with Mikybull Crypto’s analysis, Crypto analyst BitQuant mentioned that ,000 will be “achieved in one move, and that is quite obvious.” He, however, noted that it remains uncertain when this move will happen and called for patience as everyone waits for Bitcoin “to perform as expected.”
BitQuant further advised that it might be better to leave the market for those who can’t “avoid the torture,” claiming that there “will be a lot of pain for those with weak nerves” in the coming months. Based on Arthur Hayes’s prediction, investors might have to wait until August for that big move from the flagship crypto.
Bitcoin Is Still Far From Its Market Top
In a recent X post, Rekt Capital suggested that Bitcoin was still far from its market top. He highlighted past cycles, which show that the bull market peak usually occurs between 518 and 546 days after the halving. Based on this, the analyst predicts that the flagship crypto will likely peak in September or October 2025.
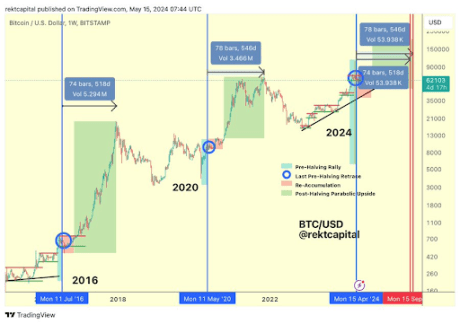
The crypto analyst also acknowledged that Bitcoin has been accelerating in this cycle by over 200 days. However, he remarked that Bitcoin could resynchronize with past halving cycles if it continues to consolidate for longer.
Bitcoin Price Linked To Binance Vs Coinbase Battle, Quant Reveals
A quant has explained how there appears to be a relationship between Coinbase’s spot volume dominance vs. Binance’s and the Bitcoin price.
Bitcoin Has Been Reacting To Binance/Coinbase Volume Changes
In a CryptoQuant Quicktake post, an analyst discussed the dynamics in the cryptocurrency market that arise out of the battle happening between Binance and Coinbase for spot volume dominance.
The quant shared a chart below that shows how this war for dominance has played out over the past decade.

As the graph shows, Binance has been the much more dominant of the two platforms when considering the spot volume. The exchange is hosting five times as much volume as Coinbase.
The analyst notes that the difference between the two would be even higher when considering the BTC-FDUSD pair, which isn’t included in the data depicted in the above chart.
Despite the much lower spot volume, Coinbase still hasn’t been irrelevant in the market. For example, the platform is the custodian for Bitcoin spot exchange-traded funds (ETFs) like BlackRock’s IBIT and Grayscale’s GBTC.
There also appears to be an interesting pattern between the dominance of the American exchange and the Bitcoin spot price. The quant has highlighted this trend in the graph.
There have been a few instances where a rise in the spot trading volume of Coinbase against Binance has preceded surges in the value of cryptocurrency. Similarly, declines in the platform’s dominance have seemingly led to drawdowns in the Bitcoin price.
The analyst has also discussed the trend in the volumes of the two exchanges more closely, using the spot volume ratio for them, as shown below.

The chart shows that the spot volume ratio between Binance and Coinbase had spiked to very high levels in 2023, with the former’s volume being 53 times the latter’s. The reason behind this was the zero-fee scheme that Binance had introduced for the Bitcoin trading pairs.
However, Coinbase’s volume has recently risen, although the ratio remains notably in favor of Binance. This shift in the market emerged as the Bitcoin spot ETF-related news started to intensify.
The quant concludes:
The dynamics between these exchanges are complex, but the graphs show that each exchange’s dominance at specific times has a direct impact on the price of Bitcoin. It’s a true battle between the market’s biggest players, where competition is constant, and the outcome is reflected in cryptocurrency movements.
BTC Price
At the time of writing, Bitcoin is trading at around ,800, down 3% over the past week.
XRP Set For Major Upswing: Top Analyst Reveals Timing For $10-$20 Price Milestone
XRP, the cryptocurrency associated with Ripple, has been locked in a lengthy period of consolidation, trading between .300 and .600 for the past seven years.
Despite a brief surge during the 2021 bull run that saw XRP reach a three-year high of .9 in April, the token has since returned to its range, lacking the bullish momentum to overcome upper resistance levels.
However, some crypto analysts are now predicting a major uptrend for XRP in the coming months, potentially propelling it to new heights.
Analysts Anticipate XRP Breakout
A technical analyst using the pseudonym “U-COPY” on the social media site X (formerly Twitter) suggests that XRP could experience significant movement between May 15 and August.
U-COPY points out that XRP has been slowly moving up from its previous low at .46 and is nearing the end of a long triangle formation, which has been in accumulation since 2018.
The analyst believes that XRP’s real potential will be revealed in the fully formed bull cycle, with the token possibly experiencing substantial growth by the end of the year.
Supporting this bullish outlook, another analyst, Armando Pantoja, proposes that the crypto bull run could begin in September or October 2025, with XRP potentially reaching a price of .75.
Pantoja further suggests that if former US President Trump wins the election and the Securities and Exchange Commission (SEC) eases its stance on cryptocurrencies, XRP could be propelled to higher levels.
This change in regulatory dynamics, combined with the ongoing legal battle between Ripple and the SEC, may increase the likelihood of XRP gaining approval for an exchange-traded fund (ETF) similar to Bitcoin.
Pantoja outlines a price range of -2 for an XRP ETF announcement in early 2025. If interest rates are cut multiple times during the same period, XRP could potentially reach -10. Ultimately, Pantoja predicts the possibility of XRP hitting – by the fourth quarter of 2025 or the first quarter of 2026.
‘Buy the Dip’ Opportunity?
According to market intelligence platform Santiment, The XRP Ledger (XRPL) has recently witnessed a notable increase in the movement of dormant tokens, signaling a potential shift in market dynamics for the token.
Coinciding with the opening of May, the company’s Token Age Consumed metric reveals a spike in the transfer of old coins, reminiscent of a similar occurrence in April, just before a significant downturn in the market. During that period, XRP experienced a sharp decline in value, dropping by 16%.
However, in contrast to the previous event, Santiment suggests that there is a “compelling argument” that this current surge in old coin movement might be attributed to the interest of key stakeholders looking to “buy the dip.”
Furthermore, it is worth noting the growing open interest in exchanges, which has recently reached a three-week high. This uptick in open interest indicates increased active positions in XRP, potentially reflecting growing market participation and heightened trading activity.
Considering these factors together—the surge in dormant token activity, the potential buy-the-dip interest from key stakeholders, and the rising open interest on exchanges—there appears to be a shift in sentiment surrounding XRP.
At press time, the seventh-largest cryptocurrency trades at .5020, down over 7% in the past week alone and 1% in the past 24 hours.
Featured image from Shutterstock, chart from TradingView.com
Buy Or Sell Bitcoin? Quant Reveals What Leading Metric Says
A quant has explained what a potential leading Bitcoin indicator could say about what’s next for the cryptocurrency’s price.
Bitcoin Coinbase Premium May Hold The Answer To Where BTC Goes Next
In a CryptoQuant Quicktake post, an analyst has talked about the trend currently taking place in the Bitcoin Coinbase Premium. “We can use the trend of Coinbase Premium as a leading indicator of the future direction of BTC price,” notes the quant.
The “Coinbase Premium” is a metric that keeps track of the difference between the Bitcoin price listed on the cryptocurrency exchanges Coinbase (USD pair) and Binance (USDT pair).
When the value of this indicator is positive, it means that the price listed on Coinbase is higher than on Binance right now. Such a trend suggests the buying pressure is higher (or the selling pressure is lower) on the former platform than on the latter.
On the other hand, the negative premium implies Coinbase might be observing a higher amount of selling than Binance, as the asset is currently trading at a lower price there.
Now, here is a chart that shows the trend in the 30-day moving average (MA) of the Bitcoin Coinbase Premium over the last couple of years:

As displayed in the above graph, the 30-day MA Bitcoin Coinbase Premium has been positive recently, suggesting that Coinbase users have supported the asset through the rally.
Coinbase is popularly known as the preferred platform of the US-based institutional entities, while Binance has a more global user base. As such, the premium’s value can provide hints about how the behavior of the American whales differs from that of the rest of the world.
From the chart, it’s visible that the buying pressure from these institutional traders peaked alongside the price top but has since been declining. The metric continues to be positive overall, although it’s now quite close to the neutral zero mark.
In the graph, the quant has highlighted an interesting pattern that the cryptocurrency has followed regarding the Coinbase Premium during the last two years. It would appear that whenever the indicator has hit bottom in negative territory and reversed back to an uptrend, the coin’s price has observed a rebound.
An example of this trend also played out just earlier in the year, when a reversal in the indicator led to Bitcoin observing a rally in which the asset would eventually break its all-time high.
The Coinbase Premium is currently riding a downtrend, but it’s yet to dip into negative territory. The analyst explains that BTC is in a “wait and see” phase, where a rebound might be a bit longer out. The metric has to first decline more and reach a reversal point, at least if the historical pattern has to repeat.
BTC Price
Bitcoin had slipped under ,000 earlier, but the asset has found a slight rebound in the past day, returning above ,700.
Gaming The System: Pundit Reveals Why XRP Price Will Reach $33
A crypto analyst has predicted a substantial bullish surge for the the XRP price in the future. According to the analyst, XRP is gearing up for a substantial increase to .5 from an initial price of .50. He expects the price of the cryptocurrency to explode by 6600% in this current market cycle.
Analyst Forecasts Exponential Rise In XRP Price
In a recent X (formerly Twitter) post, a crypto analyst identified as ‘Egrag Crypto,’ revealed a series of bullish price targets for XRP in the near future. The analyst focused his predictions on a technical analysis called “the Line of Hestia.”
Related Reading: US Mega Banks JP Morgan And Wells Fargo Unveil Bitcoin Exposure As BTC Drops To ,000
Egrag Crypto’s latest findings suggest that XRP could rise to .5 if it touches the Line of Hestia, a technical indicator featuring an ascending trend line which signals a potential upsurge for the price of a cryptocurrency. According to the analyst, “Historical data indicates that every time the XRP price touches the “Line of Hestia,” it experiences significant price pumps.”
This implies that there may be a correlation between XRP’s bullish price movements and the ascending trend line. Egrag Crypto also revealed that following this historical pattern, XRP has witnessed pumps ranging from 6600%,1444%, 100%, 80%, and 171%.
Given the established trend, Egrag Crypto predicts XRP’s ascent to new all-time highs. He calculated the average percentage increase of XRP’s price each time it touched the Line of Hestia, dividing the sum by the total number of occurrences, which is five.
Using this data, the crypto analyst estimates that if XRP were to experience a 6600% increase, its future price would be .50. Similarly, he calculated new prices for XRP based on the previous percentages.
It’s important to note that the price of XRP, at the time of writing, is trading at .5. The cryptocurrency has been recording considerable declines over the past year, consolidating around the .5 price mark for months. According to CoinMarketCap, XRP has also recorded a 7.35% decrease over the past seven days and a 0.08% decline in the last 24 hours.
Although Egrag Crypto has remained optimistic about XRP’s future price, other crypto community members have expressed skepticism over the analyst’s ambitious forecast. A few community members have denied the prediction, emphasizing that the cryptocurrency’s surge to .5 during this cycle was highly unlikely.
Possible Price Correction Ahead Of Projected Surge
In one of his most recent X posts, Egrag Crypto disclosed that XRP could witness a major price correction before experiencing a significant rally. The analyst has urged crypto investors to remain cautious of the cryptocurrency unless the XRP/BTC ratio closes above the .00010 threshold.
Related Reading: Is The Bitcoin Bottom In? Buy The Dip Sentiment Erodes Amid Drop Toward ,000
Egrag Crypto anticipates a potential 45% decline for XRP/BTC, emphasizing that this substantial price drop could indicate a bottom between .0000055 and .0000077. However, he also disclosed that overcoming resistance at .00001 would be crucial for a rebound in XRP.
Analyst Who Predicted Solana’s 1,100% Move Reveals Where The Altcoin Is Headed Next
Crypto analyst Javon Marks has provided insights into the future trajectory of Solana (SOL) after it hit a 1,100% return. The analyst is known to have called the crypto token’s previous high correctly, which is one reason his latest prediction is worth keeping an eye on.
Solana Could Rise To As High As 3
Marks mentioned in an X (formerly Twitter) post that despite its recent pullback, Solana’s price may be getting ready for another price rally. He noted that a move of over 54% may already be in the pipeline and that such a price move could open up room for another run of over 93%, which would send Solana to 3.
Related Reading: Cardano Ready For 15x Move, Crypto Analyst Reveals The Major Drivers

Marks predicted last year that Solana would climb above 0, which it eventually did this year, peaking at a year-to-date (YTD) high of 2. Although the crypto token has dropped significantly from that price level, Marks’ recent prediction confirms that Solana’s run isn’t done yet and will still surpass its current all-time high (ATH) of 0.
Solana rising to 3 looks more feasible considering that crypto analysts like Altcoin Sherpa have predicted that the crypto token could rise above 0 by year-end. Crypto analyst Hansolar also predicted that Solana could climb to 0 in this market cycle. Meanwhile, Crypto YouTuber Jake Gagain predicted that Solana will rise to 0, although he mentioned that it will likely happen in 2025.
SOL Could Become The Third-Largest Crypto Token
Solana’s rise to as high as 0 could lead to the crypto token becoming the third largest crypto asset by market cap, only behind Bitcoin and Ethereum. This is possible, as a rise to 0 is almost double Solana’s current ATH. Crypto analyst Chris O also previously predicted that this would likely happen as he predicted Solana and ADA would battle for the position.
Meanwhile, asset manager Franklin Templeton also sounded confident in Solana’s potential to become the third-largest cryptocurrency. In a recent analysis, the asset manager highlighted the factors that could lead to this development. One is Solana’s technology, which they think will be perfect for the sectors that will drive the next wave of crypto adoption.
Franklin Templeton also alluded to the upcoming airdrops on the Solana network, which could bring more liquidity into the ecosystem and possibly cause a surge in Solana’s price, just like when the Jito and Pyth airdrops occurred. The asset manager also noted that meme coin activity on the network isn’t slowing, which could contribute to Solana’s rise to becoming the third-largest cryptocurrency.
Solana has become the foremost network for trading meme coins, which has led to an influx of new investors into the ecosystem. Therefore, a sustained network expansion will likely reflect positively on Solana’s price sooner or later.
At the time of writing, Solana is trading at around 4, up in the last 24 hours, according to data from CoinMarketCap.
Is The Bitcoin Bottom In? Analyst Reveals Key Price Levels To Watch
In his latest technical analysis, veteran crypto analyst Christopher Inks offers a detailed look at the current Bitcoin market structure through a comprehensive chart analysis. The chart, recently shared on X, shows Bitcoin’s price movements alongside several key technical indicators and levels that could signal a potential reversal from its bearish trend.
The analyst illustrates Bitcoin’s price action with daily candlesticks over the past few months, pinpointing significant support (S1, S2) and resistance (R1, R2) levels. As of press time, Bitcoin traded at around the ,000 mark, encapsulated by two descending trend lines which represent a bearish market structure.
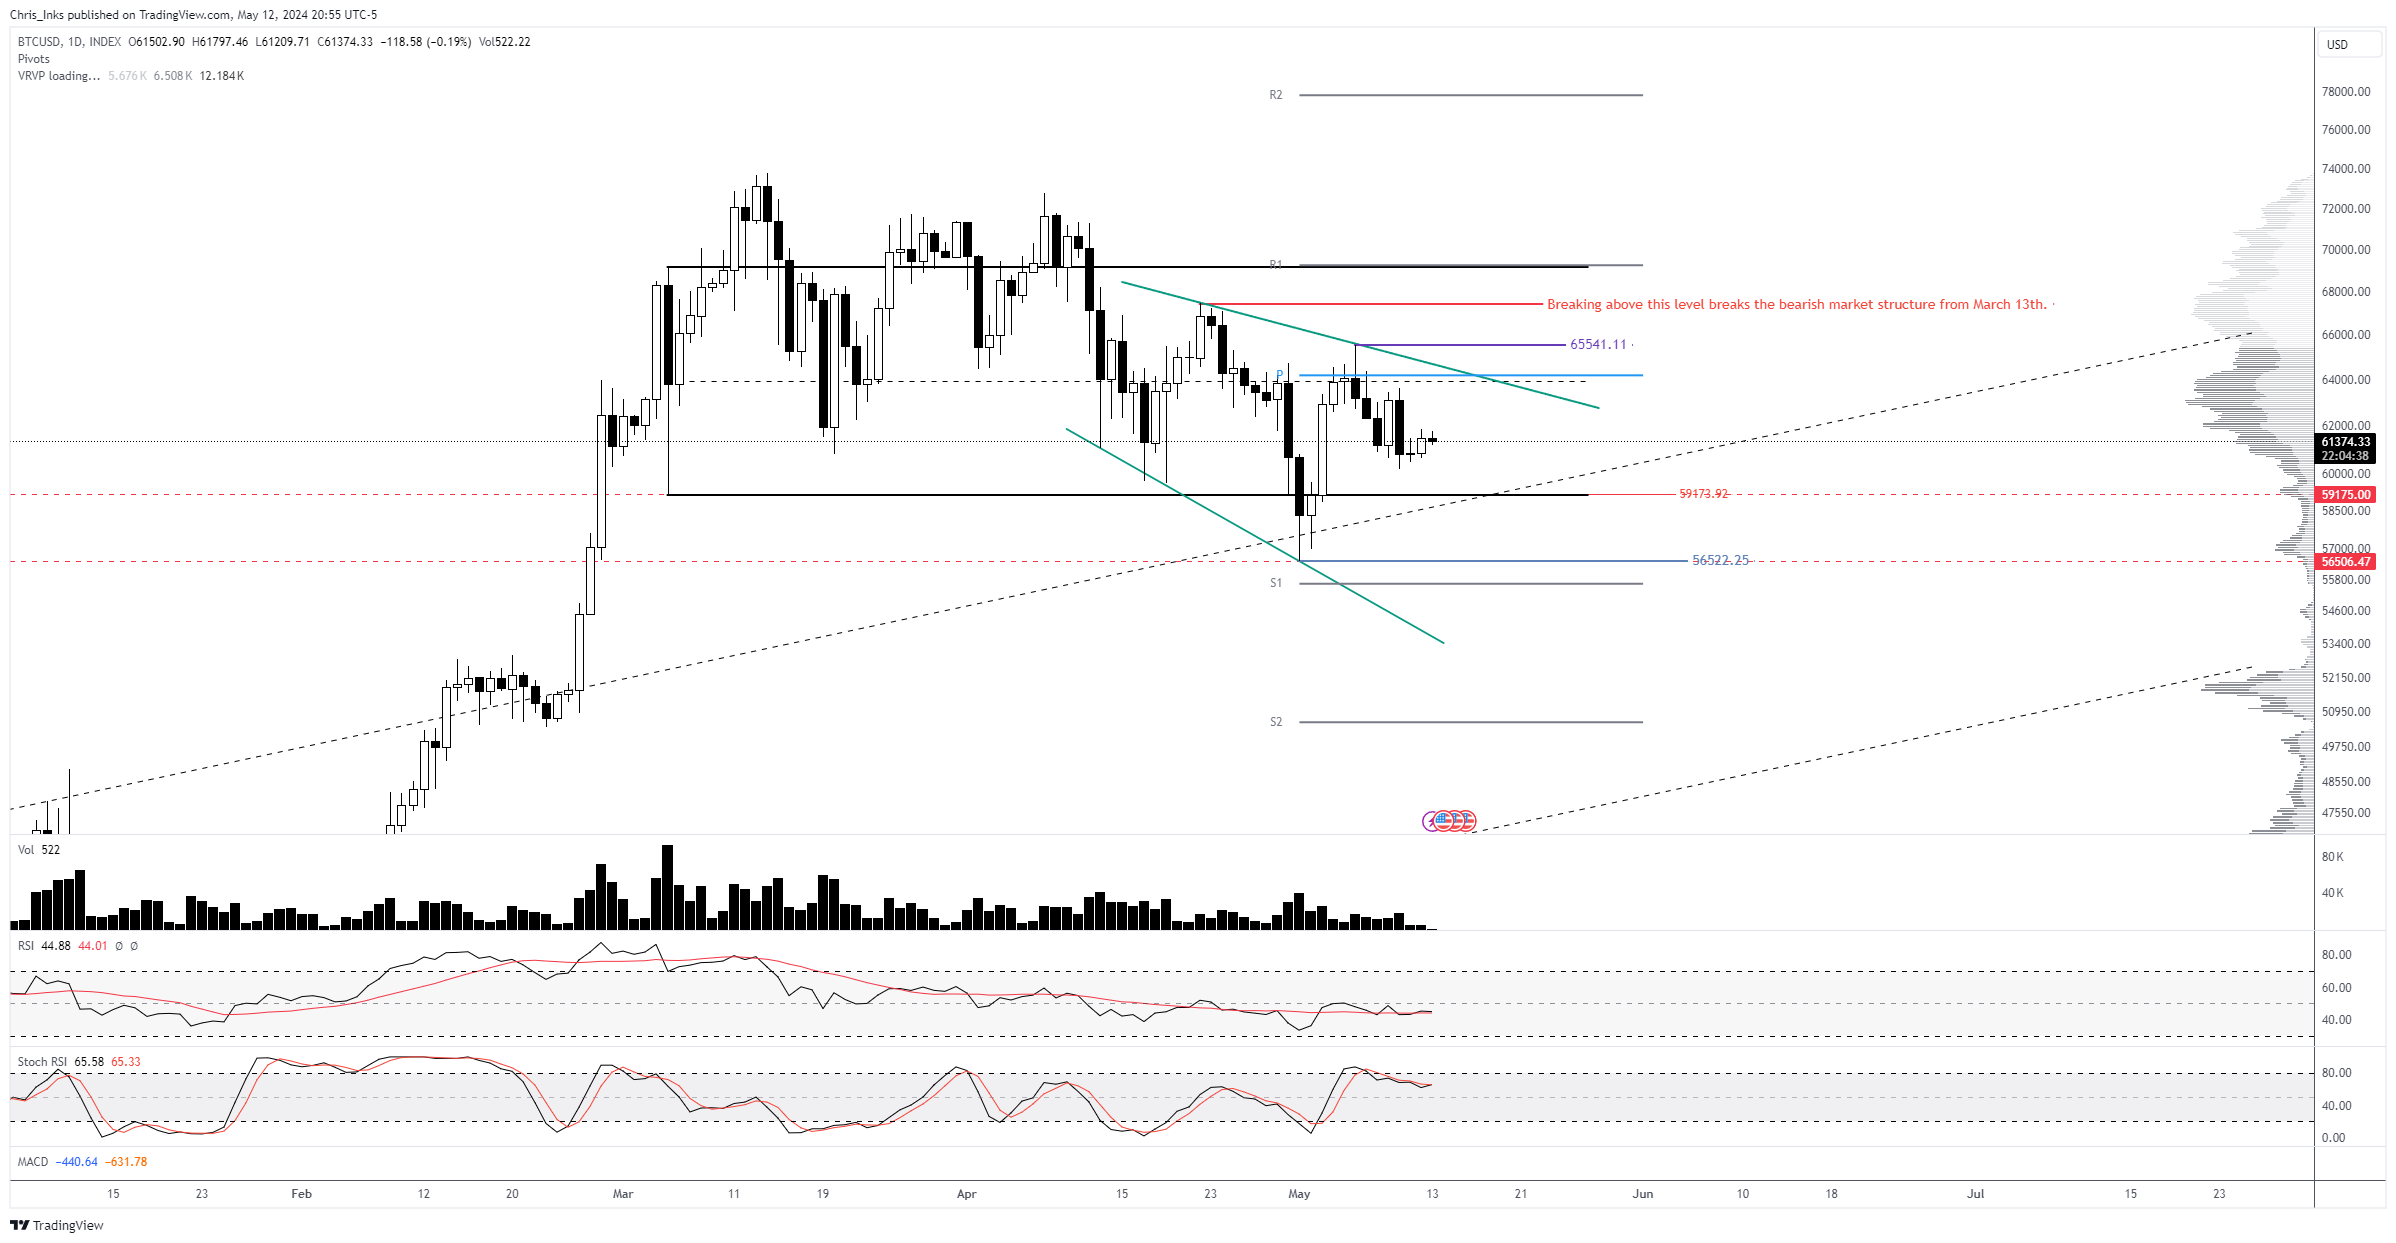
The Bottom Signal For Bitcoin
“We still want to see a breakout above the noted level to signal a break in the bearish market structure that began at the ATH,” Inks stated. This level is of paramount importance because it serves as a junction of multiple technical elements: the daily pivot point, the upper descending green resistance line, and the two-month range equilibrium.
According to Inks, “an impulsive breakout and close above the daily pivot/descending green resistance/2-month range EQ confluence area will signal that the low is likely in.” This suggests that overcoming this barrier could herald the end of the bearish market structure that commenced from the all-time high.
If this resistance breaks, the next major resistance is located at ,541. Afterwards, ,000 could be on the cards. “Breaking above this level breaks the bearish market structure from March 13th,” according to Inks. Then, R1 at ,000 and R2 at around ,000 could be the next targets.
On the downside, the most crucial support is at ,522. It represents the lower boundary that Bitcoin needs to maintain to prevent a new low, which would exacerbate the bearish sentiment.
Inks articulates the importance of this support, noting, “If we can print a higher low now, which would require a breakout above the .541 level without printing a new low below ,522, then that would really add support for the idea that the bottom is in and a new ATH is incoming.”
This statement underlines the necessity for Bitcoin to hold above this support to avoid further declines and stabilize within its current range. If BTC breaks below the pivotal support, the price could be headed below ,000 (S1) and ,90 (S2).
Notably, the analysis is supported by a variety of technical indicators. The Relative Strength Index (RSI), hovering around the neutral 50 mark, suggests a balancing act between bullish and bearish forces. The RSI’s position indicates that the market is neither overbought nor oversold, leaving room for potential upward movement if bullish signals strengthen.
The Moving Average Convergence Divergence (MACD) currently shows that the MACD line is below the signal line, a traditional bearish sign. However, the proximity of these lines also hints at a possible upcoming bullish crossover, should the momentum shift.
The Stochastic RSI also indicates potential for movement in either direction but is particularly useful for identifying when Bitcoin might be entering overbought or oversold territories, which are critical for predicting short-term price reversals.
Inks also commented on the market’s dynamics, stating, “The positives of the range are that supply has continued to decrease throughout the bearish market structure.” This observation suggests that diminishing supply, paired with maintaining key support levels, could help stabilize and potentially increase Bitcoin’s price.
At press time, BTC traded at ,902.
Cardano Ready For 15x Move, Crypto Analyst Reveals The Major Drivers
Cardano (ADA) looks primed to make that move to the upside, with crypto analyst Javon Marks revealing what could make the crypto token see a 15x increase in its price. Marks’ analysis comes amidst recent price predictions, which paint a bullish outlook for Cardano.
How Cardano Could See A 15x Increase In Its Price
Marks mentioned in an X (formerly Twitter) post that ADA has shown “major progress since breaking the resisting trend.” The crypto analyst also noted that the crypto token attempted to move over 200% toward the first target at .77709 and claimed that the recent pullback Cardano faced could strengthen it to achieve an even more parabolic rise.
This development is why Marks believes Cardano could rise to as high as .80 from its current price, representing a 1,500% increase for the crypto token. A rise to that level looks more feasible, considering that crypto analyst Altcoin Daily also recently predicted that Cardano will rise to in this bull run.
Meanwhile, crypto analyst Ali Martinez made an ultra-bullish case for Cardano, noting that the crypto token was currently mirroring its price action from 2019, when it made a price gain of over 4,000%. While Martinez acknowledged that history might not repeat itself, he suggested that Cardano could still make an impressive move similar to 2019.
For Cardano to experience such parabolic moves, the crypto token needs to see a reversal in its current downtrend. Crypto analyst Trend Rider hinted that could happen soon, noting that ADA was still holding its support level. According to him, if Cardano can hold on to this support for 1 to 2 weeks, the bears will tire, and the crypto token will bounce from its current price level.
Analyzing Cardano’s Bull Run
Dan Gambardello, the founder of Crypto Capital Venture, again suggested that Cardano’s price action in this bull run will likely mirror Ethereum’s in the last bull run. He noted that the former is currently around the level that Ethereum was at around the 2020 Bitcoin halving. As such, he expects Cardano to enjoy a similar success to the one Ethereum enjoyed in the last bull run.
The crypto analyst also assured that Cardano was still on track for its bull run, stating that it was also down over 90% from its all-time high (ATH) months after Bitcoin halved in the last bull run. As such, he still expects Cardano to make a run soon enough, just like it did in 2021.
The crypto analyst hinted that Cardano’s bull run would likely begin during the Altcoin Season. However, he wasn’t sure when this Altcoin season would likely start since Bitcoin hit a new ATH before the halving (which has never happened before). He added that this Altcoin season might not come until December. For now, the analyst noted that patience is the name of the game.