 Skybridge Capital founder Anthony Scaramucci remains bullish on bitcoin, dismissing the notion that the potential benefits of the upcoming halving are already priced in. He emphasized that bitcoin has significant room for further growth, noting that the crypto could “trade to half of the valuation of gold,” which translates to a potential six to tenfold […]
Bitcoin News
Former FTX Associates Enter Crosshairs, Bitcoin Halving Inches Closer, and More — Week in Review
 After the sentencing of Sam Bankman-Fried to nearly 25 years in prison for his role in FTX’s financial mismanagement, attention shifts to his former associates. The cryptocurrency world eyes the upcoming Bitcoin halving, expected between April 18 to April 22, 2024. Blackrock’s Ishares Bitcoin Trust (IBIT) sees its holdings skyrocket past 252,011 BTC. Ethena announces […]
Bitcoin News
Xuirin Finance Set to Revolutionize DeFi With KYC-Free Debit Cards, P2P Lending and Much More
 Looking to get involved with a platform that can change the face of decentralized finance forever? Xuirin Finance is revolutionizing the DeFi landscape through its innovative offerings like KYC-free debit cards, P2P lending, and so much more. Supporters can take part in the first stage of its presale right now. Xuirin Finance to Offer Futuristic […]
Bitcoin News
Ethereum Price Fails Again, Signs Of More Losses Below $3,300
Ethereum price is struggling to recover above the ,360 resistance zone. ETH is now showing signs of more losses below the ,300 and ,250 levels.
- Ethereum is facing many hurdles near the ,350 and ,360 levels.
- The price is trading below ,350 and the 100-hourly Simple Moving Average.
- There was a break below a rising channel with support at ,320 on the hourly chart of ETH/USD (data feed via Kraken).
- The pair could extend losses if there is a close below the ,200 support zone.
Ethereum Price Signals Downside
Ethereum price traded below the ,300 level before the bulls appeared. ETH traded as low as ,215 before there was a minor recovery wave, like Bitcoin. The price climbed above the ,250 and ,280 levels.
There was a move above the 23.6% Fib retracement level of the downward wave from the ,655 swing high to the ,215 low. However, the bears were active near the ,360 resistance. The bulls struggled and the price reacted to the downside.
There was a break below a rising channel with support at ,320 on the hourly chart of ETH/USD. Ethereum is now trading below ,300 and the 100-hourly Simple Moving Average.
Immediate resistance is near the ,300 level. The first major resistance is near the ,360 level. The next key resistance sits at ,435 or the 50% Fib retracement level of the downward wave from the ,655 swing high to the ,215 low, above which the price might test the ,500 level.
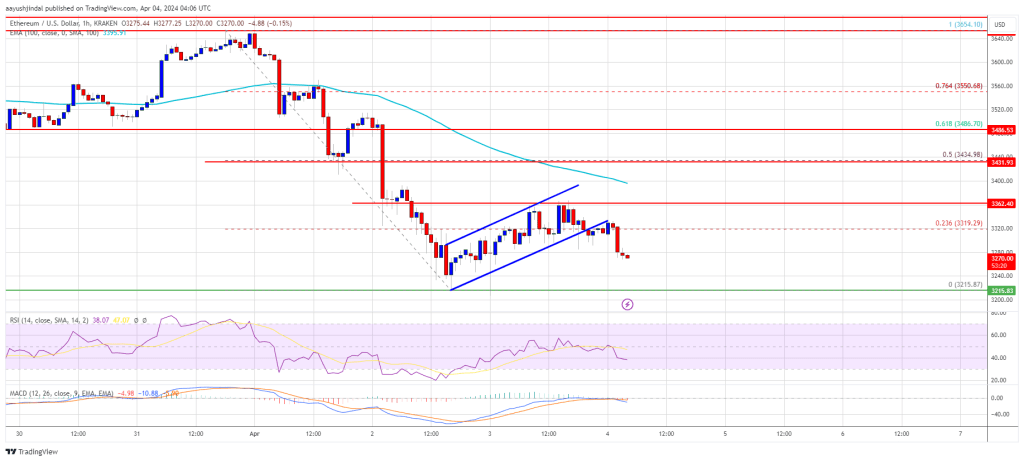
Source: ETHUSD on TradingView.com
The next key resistance is seen near the ,550 level, above which Ether could gain bullish momentum. In the stated case, the price could rise toward the ,650 zone. If there is a move above the ,650 resistance, Ethereum could even rise toward the ,750 resistance. Any more gains might call for a test of ,800.
More Losses In ETH?
If Ethereum fails to clear the ,360 resistance, it could continue to move down. Initial support on the downside is near the ,240 level.
The first major support is near the ,215 zone. The next key support could be the ,200 zone. A clear move below the ,200 support might send the price toward ,120. Any more losses might send the price toward the ,040 level.
Technical Indicators
Hourly MACD – The MACD for ETH/USD is gaining momentum in the bearish zone.
Hourly RSI – The RSI for ETH/USD is now below the 50 level.
Major Support Level – ,215
Major Resistance Level – ,360
Defi Platforms Lose More Than $336 Million in Digital Funds in Q1 of 2024, Study Finds
 In the first quarter of 2024, more than 6 million in digital assets were stolen from decentralized finance platforms across 61 incidents of hacking and fraud. During this period, criminals made off with digital assets valued at 4.48 million in two major hacking incidents. In contrast, centralized finance platforms reported no incidents of hacking or […]
Bitcoin News
Reality Check: MATIC Investors Count Losses – More Headaches Ahead?
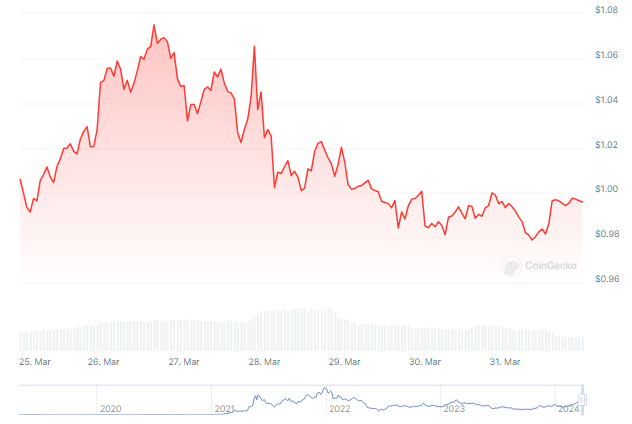
Polygon’s native token, MATIC, finds itself at a crossroads as it grapples with price volatility amidst an impending network upgrade and challenges surrounding Total Value Locked (TVL). In the past week, MATIC has witnessed a notable downturn in price, slipping by 4.44% according to data from CoinMarketCap. Despite earlier optimism that drove MATIC close to the mark, the token has encountered resistance at the level, with bullish momentum struggling to gain traction amidst prevailing market conditions.
MATIC Investors Feel The Pinch
Data analysis from IntoTheBlock paints a mixed picture for MATIC holders, revealing that 51% are currently facing losses, while 43% are enjoying profits, leaving a mere 5% at the break-even point. This volatility serves as a stark reminder of the inherent risks associated with investments in the cryptocurrency market.
However, amidst the market turbulence, a ray of hope emerges for MATIC holders in the form of Polygon’s recently announced “Napoli upgrade.” This upgrade, designed to bolster the network’s consensus mechanisms, is set to introduce enhancements in parallel execution and incorporate novel operational codes for the Ethereum Virtual Machine (EVM). Analysts speculate that the Napoli upgrade could inject renewed buying pressure into the market, with projections hinting at a potential price rise towards .30 if bullish sentiment prevails.
Despite the anticipation surrounding the Napoli upgrade, Polygon faces challenges on other fronts, notably concerning its Total Value Locked (TVL). In a remarkable turnaround from its peak in 2021, TVL has plummeted to billion, according to data from DeFiLlama. This decline reflects a waning participation in liquidity provision, raising concerns about the protocol’s health and resilience.
The Road Ahead For Polygon
Polygon’s leadership remains optimistic about the project’s future, emphasizing its resilience amidst market fluctuations. They believe that the Napoli upgrade, coupled with strategic initiatives aimed at addressing challenges such as TVL, will fortify Polygon’s position for sustained success in the dynamic cryptocurrency landscape.
As investors and industry observers closely monitor developments within the Polygon ecosystem, navigating the delicate balance between the potential catalyst of the Napoli upgrade and the headwinds posed by declining TVL, the road ahead for MATIC remains uncertain. The cryptocurrency’s ability to weather market volatility and regain momentum in the face of recent setbacks will be pivotal in shaping its trajectory in the coming weeks and months.
MATIC’s recent price gyrations, punctuated by the announcement of the Napoli upgrade and challenges surrounding TVL, underscore the complexities inherent in navigating the cryptocurrency market. As Polygon continues to chart its course, adaptation and innovation will be key drivers in determining its long-term viability amidst an ever-evolving landscape.
Featured image from Andrea Piacquadio/Pexels, chart from TradingView
Convicted UK Woman Found With $4B in BTC, the SEC Seeks $2B Fine From Ripple, and More — Week in Review
 A London woman has been convicted for money laundering, having been found with over .3 billion in bitcoin, which she converted into physical assets. The SEC is seeking a nearly billion fine from Ripple Labs in a landmark XRP lawsuit, a move Ripple’s CEO deems unprecedented. The activation of a dormant bitcoin wallet, known […]
Bitcoin News
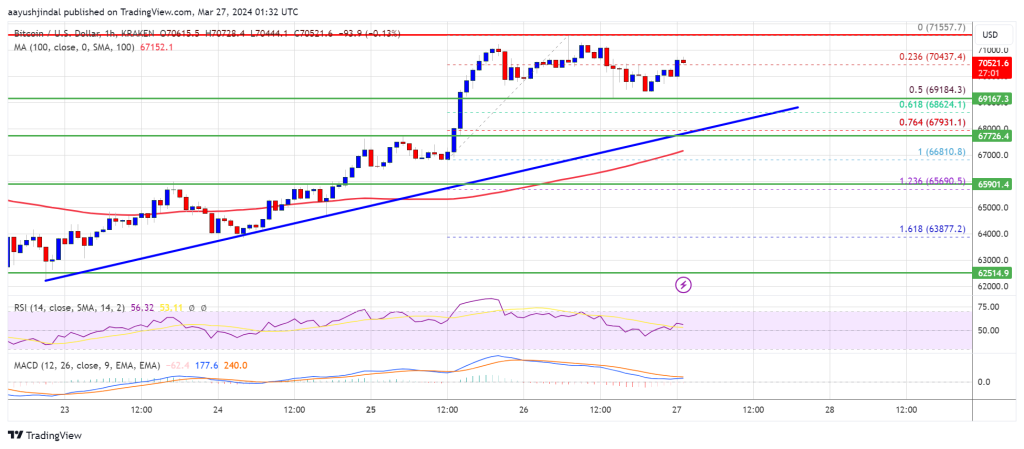
Bitcoin Price Faces Uphill Task But Indicators Signal More Upsides
Bitcoin price is consolidating gains above the ,000 support zone. BTC must clear the ,500 resistance zone to start a steady increase.
- Bitcoin price is still showing positive signs and facing resistance near ,500.
- The price is trading above ,000 and the 100 hourly Simple moving average.
- There is a major bullish trend line forming with support at ,120 on the hourly chart of the BTC/USD pair (data feed from Kraken).
- The pair could start another increase if it clears the ,500 resistance zone.
Bitcoin Price Holds Support
Bitcoin price remained in a positive zone above the ,800 resistance zone. BTC climbed higher the ,000 resistance zone, but the bears were active near the ,500 level.
There were more than two attempts to clear the ,500 level but the bulls failed. There was a downside correction, and the price tested the ,400 support. A low was formed at ,366 and the price is now starting a decent increase.
There was a move above the 23.6% Fib retracement level of the downward move from the ,746 swing high to the ,366 low. Bitcoin is now trading above ,000 and the 100 hourly Simple moving average. There is also a major bullish trend line forming with support at ,120 on the hourly chart of the BTC/USD pair.
Immediate resistance is near the ,000 level or the 50% Fib retracement level of the downward move from the ,746 swing high to the ,366 low. The first major resistance could be ,200.
Source: BTCUSD on TradingView.com
The main resistance is still near ,500. If there is a clear move above the ,500 resistance zone, the price could continue to gain strength. In the stated case, the price could even clear the ,500 resistance zone in the near term.
More Losses In BTC?
If Bitcoin fails to rise above the ,200 resistance zone, it could start another decline. Immediate support on the downside is near the ,200 level and the trend line.
The first major support is ,400. The next support sits at ,500. If there is a close below ,500, the price could start a drop toward the ,000 level. Any more losses might send the price toward the ,000 support zone in the near term.
Technical indicators:
Hourly MACD – The MACD is now losing pace in the bearish zone.
Hourly RSI (Relative Strength Index) – The RSI for BTC/USD is now above the 50 level.
Major Support Levels – ,400, followed by ,000.
Major Resistance Levels – ,000, ,500, and ,500.
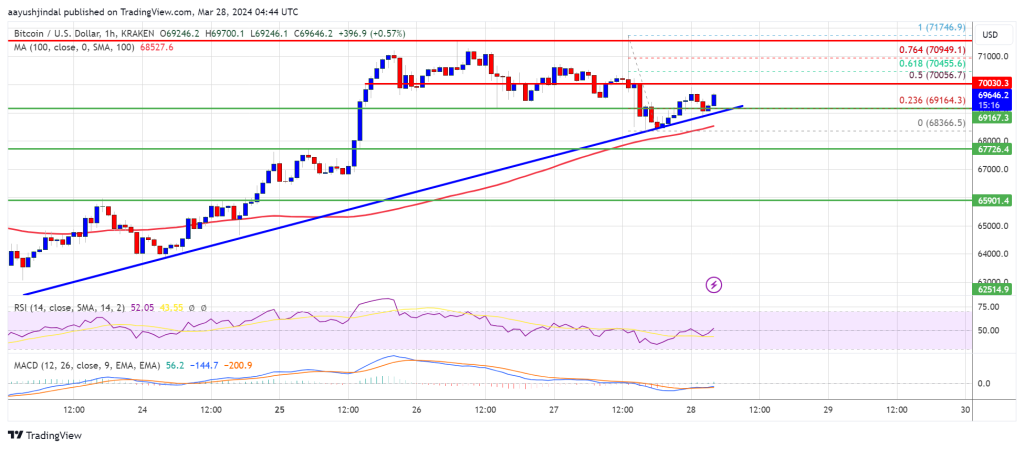
Bitcoin Price Consolidates Above $70K As Bulls Prepare For More Gains
Bitcoin price is consolidating gains above the ,000 resistance zone. BTC could rally again if there is a move above the ,500 resistance in the near term.
- Bitcoin price moved in a positive zone above the ,500 level.
- The price is trading above ,000 and the 100 hourly Simple moving average.
- There is a key bullish trend line forming with support at ,500 on the hourly chart of the BTC/USD pair (data feed from Kraken).
- The pair could start another increase if it clears the ,500 resistance zone.
Bitcoin Price Regains Strength
Bitcoin price started a decent increase above the ,800 resistance zone. BTC climbed higher above the ,500 and ,000 resistance levels. Finally, the price tested the ,500 resistance zone.
A new weekly high was formed near ,557 and the price is now consolidating gains. There was a minor decline below the 23.6% Fib retracement level of the upward move from the ,811 swing low to the ,557 high. However, the price remained stable above ,000.
Bitcoin is now trading above ,000 and the 100 hourly Simple moving average. There is also a key bullish trend line forming with support at ,500 on the hourly chart of the BTC/USD pair. The trend line is close to the 61.8%% Fib retracement level of the upward move from the ,811 swing low to the ,557 high.
Source: BTCUSD on TradingView.com
Immediate resistance is near the ,800 level. The first major resistance could be ,500. If there is a clear move above the ,500 resistance zone, the price could continue to gain strength. In the stated case, the price could even clear the ,500 resistance zone in the near term. The next key resistance sits at ,500.
Another Decline In BTC?
If Bitcoin fails to rise above the ,500 resistance zone, it could start another decline. Immediate support on the downside is near the ,000 level.
The first major support is ,000. The next support sits at ,500 and the trend line. If there is a close below ,500, the price could start a drop toward the ,000 level and the 100 hourly SMA. Any more losses might send the price toward the ,000 support zone in the near term.
Technical indicators:
Hourly MACD – The MACD is now losing pace in the bullish zone.
Hourly RSI (Relative Strength Index) – The RSI for BTC/USD is now above the 50 level.
Major Support Levels – ,500, followed by ,000.
Major Resistance Levels – ,500, ,500, and ,500.
El Salvador Keeps Buying BTC, Top BTC Mining Rigs, Blackrock’s New ‘BUIDL’ Fund, and More — Week in Review
 El Salvador continues its daily bitcoin purchases, aiming to keep buying until the cryptocurrency becomes too expensive. The top 10 bitcoin mining rigs of 2024 show significant profit margins due to recent value increases. Blackrock, has submitted a form to the SEC for the initiation of a tokenized investment fund called “BUIDL.” “Rich Dad Poor […]
Bitcoin News