 The United States witnessed its first banking failure of 2024 with the closure of Philadelphia-based Republic First Bank, creating ripples within the cryptocurrency community as Bitcoin, Ether, and various altcoins experienced slight price drops following the announcement. This event has spurred discussions among crypto enthusiasts and investors, with some seeing bank failures as a compelling […]
Bitcoin News
Crypto Markets Experience Minor Setback as Major Coins Dip, While Select Tokens Buck the Trend
 On Wednesday, the crypto market experienced a modest downturn, with a 1% decrease in its overall value across the board, as bitcoin and ethereum saw declines of 0.51% and 0.45%, respectively. Bitcoin momentarily reached the ,000 mark the day prior, while ether soared past the ,000 threshold on Tuesday, though both cryptocurrencies traded significantly lower […]
Bitcoin News
Weekly NFT Sales Record Minor Ebb While Bitcoin Maintains Dominance

According to recent data, sales of non-fungible tokens (NFTs) over the last week declined by 1.31% to 8.23 million, a decrease of .09 million from the prior week’s 2.32 million. NFTs centered around Bitcoin remained at the forefront among 21 distinct blockchain networks, experiencing a 4.10% uptick in sales this week.
RBX Voucher Sale Leads the Pack in Priciest NFTs, as Uncategorized Ordinals Compilation Dominates This Week’s Collections
This week saw 873,268 NFT buyers and 619,949 sellers engaging in transactions worth 8.23 million in NFT sales. Despite the buyer and seller counts each surging over 20%, sales dipped slightly by 1.31% over the course of the week.
The priciest NFT, an Ethereum-based “RBX Vesting Voucher #42,” fetched 1,910, equivalent to over 328 ether, four days ago. Following closely, the second-highest valued sale was an “ORDI BRC-20 NFT,” which changed hands for approximately 9.72 BTC or 8,277 two days ago, according to cryptoslam.io statistics.
Bitcoin secured the leading spot among 21 different blockchains with 8.58 million in sales, marking a 4.10% increase from the previous week. Ethereum claimed the second rank with NFT sales amounting to .51 million, a slight 0.88% decrease compared to the week prior.
Meanwhile, Solana secured third place with million in sales, experiencing a notable 32.60% downturn from last week. Polygon’s NFT sales surged by 147.24% this week, positioning it fourth among the top blockchains in NFT sales, with a total of .36 million.
Finally, in fifth place, Avalanche reported .6 million in sales, a significant rise of 102.04% week over week. This week’s highest-grossing digital collectible collection originated from the Uncategorized Ordinals compilation, achieving .15 million in sales.
Gas-hero-coupon NFTs from Polygon followed, generating .35 million through the Polygon blockchain, while Solana’s Froganas amassed .25 million. BRC-20 NFTs garnered .03 million, and the Dokyo series on Avalanche contributed .84 million to this week’s NFT sales.
Despite a slight decline over the last seven days, the market maintains a robust stance, marking a 48% increase in month-over-month revenue with total non-fungible token sales reaching .71 billion.
What do you think about the NFT sales over the past week? Share your thoughts and opinions about this subject in the comments section below.
PEPE Coin Makes Minor Gains With 3.5% Spike – Sign Of Recovery?
PEPE has emerged as a symbol of resilience in the face of uncertainty in the broader meme coin market. A timely intervention by a deep-pocketed investor, an anonymous whale, has breathed new life into the frog-themed token, giving it a shot in the arm.
In the unpredictable flow of the crypto space, the influence of well-to-do cryptocurrency whales has come into focus. These influential investors hold the power to sway market dynamics, often leaving smaller traders in their wake. The recent resurgence of PEPE is a striking illustration of the impact these whales can exert.
According to Lookonchain’s data, a substantial investment of 1 million USDC secured a staggering 807 billion PEPE tokens, all acquired at an ostensibly modest price of .000001239 per token. This calculated move was spurred by a noticeable surge in PEPE’s market valuation.
A whale spent 1M $USDC to buy 807B $PEPE at .000001239 7 hrs ago after the price of $PEPE increased.https://t.co/P03KsDrzFi pic.twitter.com/0hjW6ewDjp
— Lookonchain (@lookonchain) August 9, 2023
Whales: Catalysts Of PEPE’s Reawakening
Notably, such substantial investments serve not only as a financial injection but also as a confidence boost within the PEPE community. The actions of this anonymous whale have ignited a renewed sense of hope, accentuating the noteworthy role that these influential figures play in steering the course of the cryptocurrency landscape.
As PEPE tries to go up, there’s an important point coming up: the 50-day moving average resistance. This point is really important because it shows how strong PEPE is and where it might go next. If PEPE can go past this point, it could start climbing even more, bringing lots of positivity and interest to PEPE.
CoinGecko data currently places PEPE’s price at .00000124, down 1.5% in the last day, but managed to sustain a weekly gain of 2.3%. These measured yet consistent advances underscore the inherent resilience that PEPE continues to exhibit, even in the face of broader market fluctuations.
![]()
PEPE & Community Engagement’s Impact
Lunarcrush’s data cited in a recent price analysis demonstrates a 1.9% increase in social interactions and an impressive surge of 28.25% in social mentions. This surge in online discussions underscores the vital role that community engagement plays in shaping the trajectory of meme coins like PEPE.
Further enhancing the narrative, weighted sentiment, a pivotal marker of market sentiment, has recently experienced an upward swing. This shift indicates a heightened degree of positivity surrounding PEPE in online dialogues.
Such shifts in sentiment often foreshadow broader market movements, potentially setting the stage for a notable resurgence of the token.
With the noteworthy juncture of the moving average resistance level ahead, and the amplifying impact of community interactions and sentiment shifts, all eyes are on PEPE as it navigates its path forward.
(This site’s content should not be construed as investment advice. Investing involves risk. When you invest, your capital is subject to risk).
Featured image from The New York Times
Bitcoin Price Consolidates Below Resistance and At Risk of Minor Pullback
Bitcoin price is facing resistance near the ,500 zone. BTC could correct lower if there is a clear move below the ,880 support zone.
- Bitcoin seems to be facing a strong resistance near the ,450 and ,500 levels.
- The price is trading above ,500 and the 100 hourly simple moving average.
- There is a key bullish trend line forming with support near ,920 on the hourly chart of the BTC/USD pair (data feed from Kraken).
- The pair could start a downside correction below the ,880 and ,750 support levels.
Bitcoin Price Faces Resistance
Bitcoin price started a strong increase above the ,000 resistance zone. BTC was able to climb above the ,500 and ,000 levels to start a major uptrend.
Finally, the price tested the ,500 resistance zone. A high is formed near ,485 and the price is now consolidating gains. There was a minor decline below the ,200 level. The price declined below the 23.6% Fib retracement level of the upward wave from the ,249 swing low to ,489 high.
Bitcoin price is now trading above ,500 and the 100 hourly simple moving average. There is also a key bullish trend line forming with support near ,920 on the hourly chart of the BTC/USD pair.
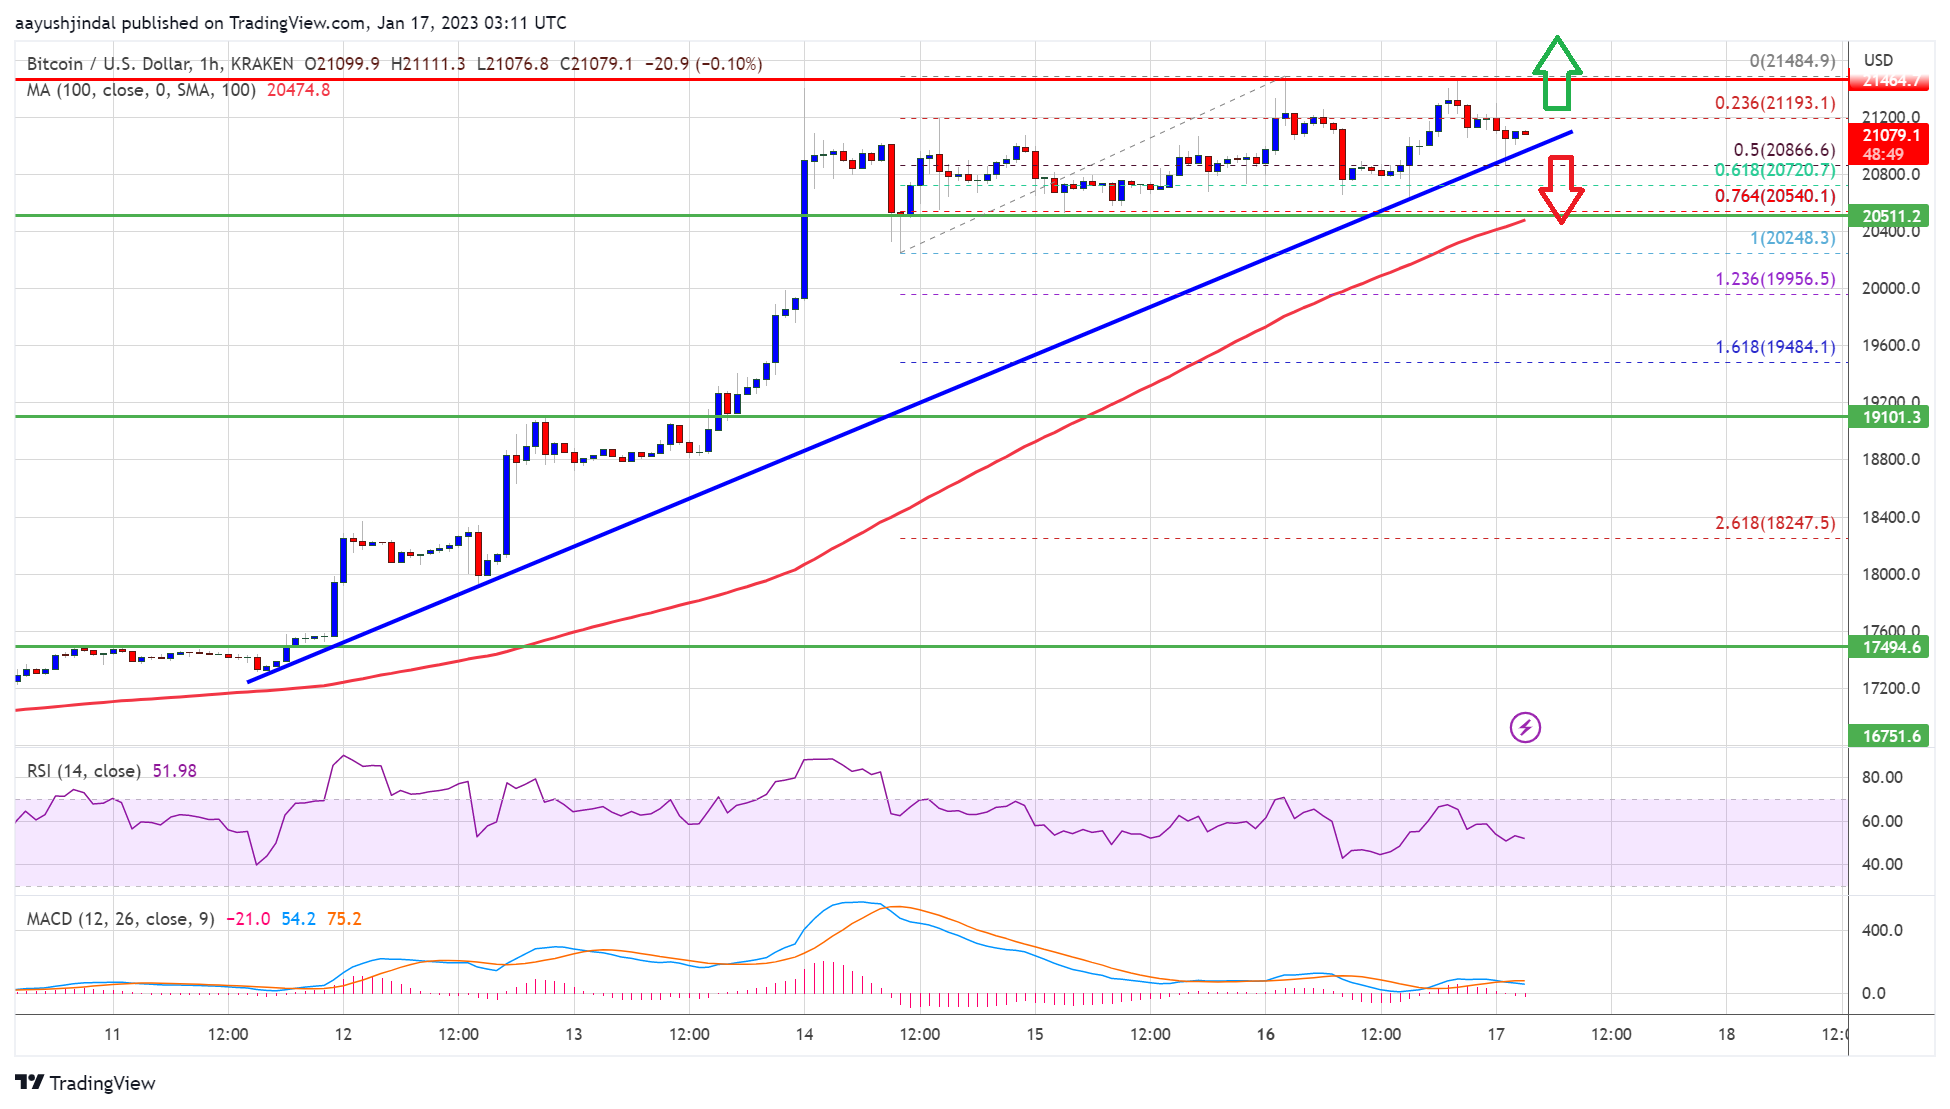
Source: BTCUSD on TradingView.com
On the upside, an immediate resistance is near the ,250 level. The next major resistance is near the ,500 zone, above which the price might start another steady increase. In the stated case, the price may perhaps rise towards the ,000 level. Any more gains might send btc price towards the ,500 level.
Downside Correction in BTC?
If bitcoin price fails to clear the ,500 resistance, it could slowly move down. An immediate support on the downside is near the ,000 zone and the trend line.
The next major support is near the ,720 level. It is near the 61.8% Fib retracement level of the upward wave from the ,249 swing low to ,489 high. The main support is now forming near the ,500 level, below which the price might retest ,000. Any more losses might send the price to ,000.
Technical indicators:
Hourly MACD – The MACD is now losing pace in the bullish zone.
Hourly RSI (Relative Strength Index) – The RSI for BTC/USD is now above the 50 level.
Major Support Levels – ,720, followed by ,500.
Major Resistance Levels – ,250, ,500 and ,000.
Solana: This Minor Hiccup Didn’t Discourage Investors From Acquiring SOL – Until Today
On the day following the implementation by the US Federal Reserve of the 50-basis point hike, Solana (SOL) saw accumulation rather than a sell-off, despite the altcoin’s 4% decline.
Prices for Bitcoin and Ethereum and other cryptocurrencies fell on December 14 as reports surfaced that the central bank raised its interest rates.
The situation is different now, though. CoinGecko reports that the token dropped another 5% today, with significant declines over the past week, biweekly, and monthly periods. SOL price is currently 135% lower than its intrinsic value.
SOL Change In Public Opinion
The futures market for SOL coin indicates a positive investment rate from yesterday, confirming the optimistic tone of on-chain analytics. However, it soon turned negative, reflecting a change in public opinion regarding SOL.
Speculation may be to blame for the recent price increase of the altcoin and subsequent price drop, as is normal with most cryptos. The current support at .38 is important because the market is already factoring in the central bank’s interest rate hike.
Even if there is news of greater institutional interest in crypto and blockchain technology, the broader crypto market will be dragged down if big cryptocurrencies like BTC and ETH continue to suffer.
Solana: Down But Not Finished
The crypto research firm Messari has recently published a comprehensive assessment of the Solana Ecosystem.
Positively, even though FTX and Solana are tightly intertwined because of Alameda, the ecosystem has continued to implement technical advancements centered on the key pillars of Solana, namely speed and scalability.
According to the overview, Solana’s DeFi space has been severely damaged. However, the environment is not dead. The study indicates that there are numerous applications on Solana, despite the fact that the TVL has decreased by a staggering 70% since the FTX disaster.
In the first quarter of 2023, Helium will migrate all of its activities on Solana’s blockchain.
This is an extremely positive venture for both Helium and Solana, which might boost the price of HNT and SOL.
However, investors in SOL should be wary of short- and medium-term losses, as the rising correlation between the token and BTC and ETH could render Messari’s research bearish.
SOL investors anticipate greater long-term gains as the Solana Ecosystem evolves and as the market strives to recover from the catastrophe brought about by the implosion of FTX.
TA: Ethereum Lacks Momentum, Showing Early Signs of a Minor Drop
Ethereum climbed higher nicely from the 5 support zone against the US Dollar. ETH price is struggling to clear the 0 resistance and it could revisit 0 in the near term.
- Ethereum is showing a few bearish signs below the key 0 resistance level.
- The price is trading above the 0 support and the 100 hourly simple moving average.
- There is a major contracting triangle forming with support near 0 on the hourly chart of ETH/USD (data feed via Kraken).
- The pair could decline towards 0 if it fails to stay above 0 and the 100 hourly SMA.
Ethereum Price is Facing Hurdles
After a sharp downside correction, Ethereum found support near the 5 level. ETH price formed a base above 5 and started a fresh increase above the 5 resistance.
Ether gained pace above the 0 resistance and the 100 hourly simple moving average. There was also a break above the 0 resistance, but the price faced a major barrier near the 0 level. A high is formed near 1 and the price is currently declining.
There was a break below the 4 level, plus the price traded below the 23.6% Fib retracement level of the recent wave from the 5 low to 1 high.
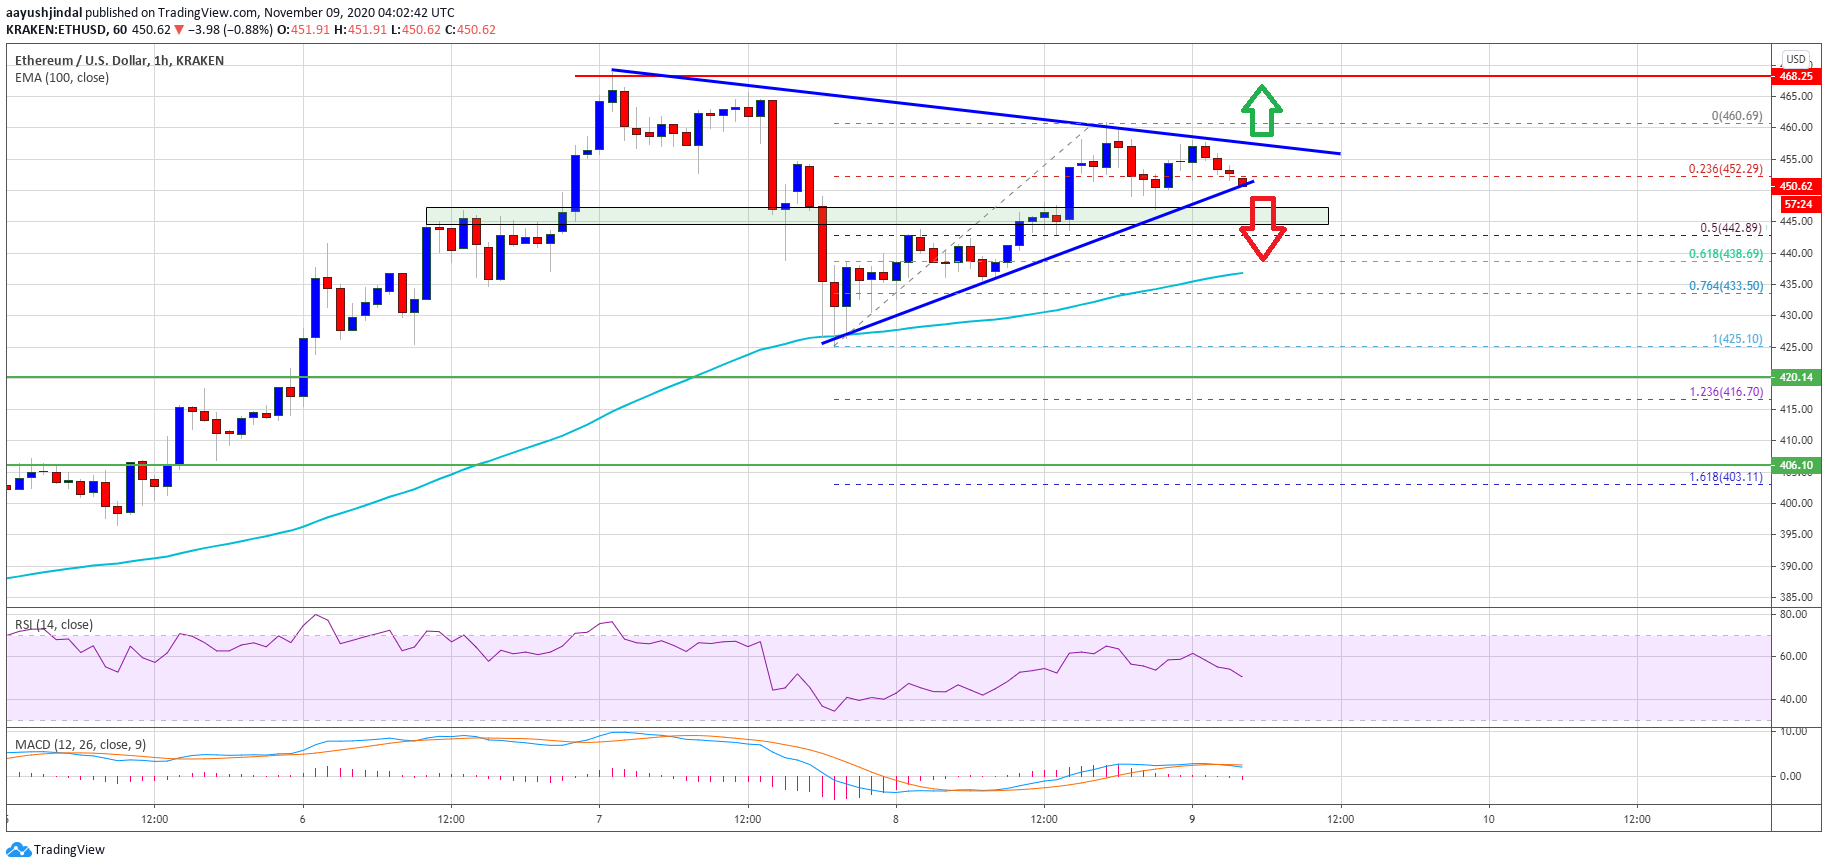
Source: ETHUSD on TradingView.com
It seems like there is a major contracting triangle forming with support near 0 on the hourly chart of ETH/USD. If ether price breaks the triangle support, it could test the 2 support. It is close to the 50% Fib retracement level of the recent wave from the 5 low to 1 high.
The next major support is near the 0 level and the 100 hourly simple moving average, below which there is a risk of a sharp decline towards 5 or even 0 in the coming sessions.
Upsides Capped in ETH?
On the upside, an initial hurdle for Ethereum is near the triangle resistance at 8. The main resistance is near the 0 level, above which the bulls are likely to gain strength.
A successful break above the 0 resistance is likely to open the doors for a move towards the 0 zone. The next major resistance is near the 0 level.
Technical Indicators
Hourly MACD – The MACD for ETH/USD is slowly gaining momentum in the bearish zone.
Hourly RSI – The RSI for ETH/USD is sliding and approaching the 50 level.
Major Support Level – 0
Major Resistance Level – 0
Bitcoin Price Hovers Under $8,800 as Top Altcoins See Minor Gains
n Bitcoin hovers under the ,800 mark as most of the top 20 cryptocurrencies report minor gainsn
CryptScout #BitFeed RSS – Bitcoin and Cryptocurrency News 24/7
Bitcoin Breaks $12,500 as US Stock Market Sees Minor Downturn
n Bitcoin broke the ,500 mark again while top 20 cryptocurrencies are reporting mixed movements on the dayn
CryptScout #BitFeed RSS – Bitcoin and Cryptocurrency News 24/7
Bitcoin Falls Under $10,800 as US Stock Market Sees Minor Downturn
n Bitcoin hovers over the ,600 mark again as most of the top 20 cryptocurrencies are reporting moderate losses on the dayn
CryptScout #BitFeed RSS – Bitcoin and Cryptocurrency News 24/7