 Ten days ago, the FTX estate overseeing the bankrupt company’s proceedings informed customers they would receive more than 100% repayment. Following this announcement, the exchange token FTT from the defunct trading platform rose above per unit. Astonishingly, despite being tied to a failed crypto exchange, this token still holds a market valuation of 5 […]
Bitcoin News
Coinbase Ventures Into Australia’s $600 Billion Pension Market With Tailored Crypto Services
 Coinbase, the largest US crypto exchange, is planning to tap into Australia’s 0 billion self-managed pension sector, according to a Bloomberg report. The company is developing a service tailored for this sector, aiming to cater to the growing interest in crypto investments among self-managed funds. This move comes amidst a significant increase in crypto holdings […]
Bitcoin News
Bitcoin Whales Quiet Down – Here’s Why And What It Means For The Market
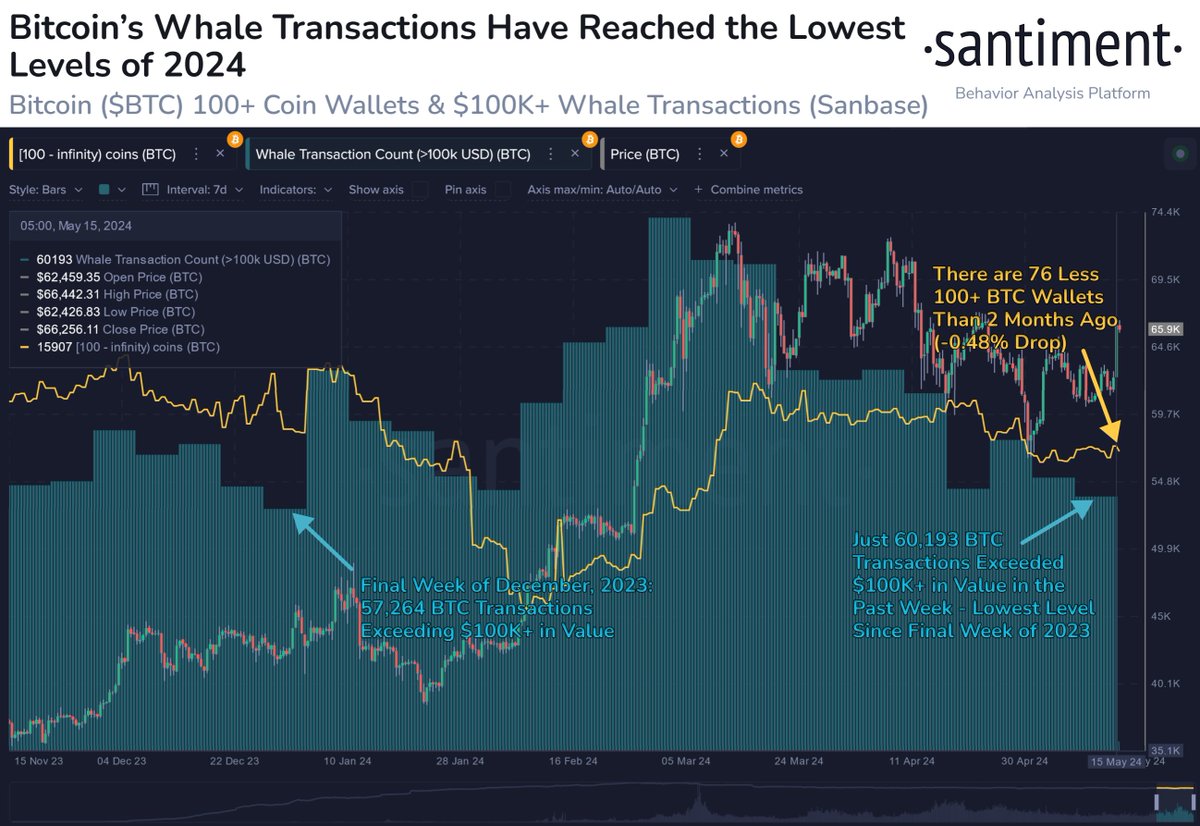
Recent data from Santiment indicates a noticeable decrease in Bitcoin whale activity, reaching the lowest levels seen in 2024. This trend shows that holders of large amounts of Bitcoin, known as whales, are drifting away from active trading.
While this could signal a negative trend, the situation presents a complex picture of the cryptocurrency’s market dynamics.
Despite the fall in whale activity, the total number of Bitcoin wallets with at least 100 BTC remains high, at 11.79 million BTC across 15,907 wallets.
Historically, increased activity from these large holders has often preceded significant price movements in Bitcoin, suggesting that their current quiet could lead to various market outcomes. The question remains: What does this reduced activity mean for the market’s future?
Analyzing Whale Activity: What This Means For Bitcoin
A decline in whale activity could initially be interpreted as an indicator of lower market volatility. Significant moves by these large holders can profoundly affect Bitcoin’s price, often resulting in abrupt and unforeseen fluctuations.
While #Bitcoin‘s 100+ $BTC whale wallets continue to hold a high level of coins (11.79M), whale activity has dropped to its lowest level of 2024. There are currently 15,907 wallets holding at least 100 coins. It would be a #bullish sign if this rises. https://t.co/nldtOms3aT pic.twitter.com/Lyj4Epfp9a
— Santiment (@santimentfeed) May 16, 2024
Consequently, a diminished presence of whales might lead to much market stability and predictability in the near term. However, this stability might contradict the typical trading behavior associated with crypto, where volatility often presents trading opportunities.
Moreover, if these whales hold onto their Bitcoin rather than sell, this behavior could be interpreted as a long-term bullish signal. It suggests that these influential market players see the potential for future price increases and are choosing to hold their positions.
This perspective is reinforced by the current trading price of Bitcoin, which is above ,000, marking a nearly 5% increase over the past week.
Indicator Shows Further Surge Ahead
Adding to the analysis, Willy Woo, a prominent crypto analyst, discussed the latest trends in the BTC volume-weighted average price (VWAP) Oscillator. The VWAP is a trading benchmark that measures an asset’s average price based on price and volume over a specific period.
This metric prioritizes price levels with higher trading volumes, offering a more comprehensive view of market trends.
Woo’s analysis revealed that the Bitcoin VWAP Oscillator has been in negative territory for several months but has recently started to rise. The oscillator could soon reach a neutral point if this upward trend continues.
This shift often signals that a bullish phase is on the horizon, based on historical patterns where the oscillator’s rise from negative to neutral has coincided with substantial price gains for Bitcoin.
Still a lot of room to run before reversal or consolidation.
Hate to be a trapped #Bitcoin bear right now. https://t.co/LGet9XVoQY pic.twitter.com/EgJ47mzNLG
— Willy Woo (@woonomic) May 16, 2024
Featured image created with DALL·E, Chart from TradingView
Liquid Staking Market in Flux: Withdrawals Hit Swell and Mantle, Reshuffling Landscape
 Over the past 18 days, 27 distinct liquid staking derivatives (LSD) protocols have experienced withdrawals amounting to approximately 50,000 ether, valued at 6.72 million. The most significant reductions occurred in the LSDs Swell and Mantle, with Swell’s ether holdings decreasing by 23,078 ether since April 28, 2024. LSD Protocol Reductions Continue Despite Minor Gains for […]
Bitcoin News
Bitcoin Price Consolidates Gains: Stability in the Crypto Market Amid Recent Surge
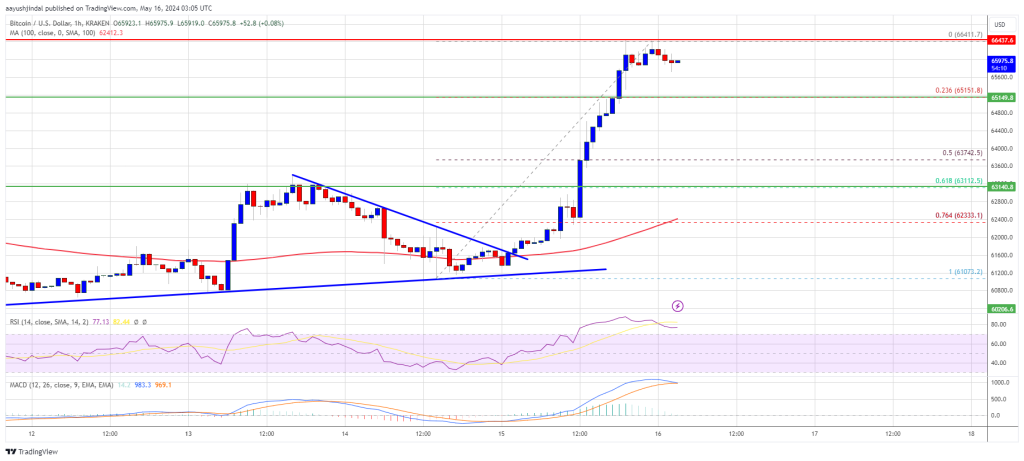
Bitcoin price rallied and tested the ,500 zone. BTC is now consolidating gains and might attempt another increase toward ,500.
- Bitcoin started a consolidation phase from the ,500 resistance zone.
- The price is trading above ,000 and the 100 hourly Simple moving average.
- There is a key bullish trend line forming with support at ,150 on the hourly chart of the BTC/USD pair (data feed from Kraken).
- The pair could start another increase unless the bears push it below ,800.
Bitcoin Price Remains Supported
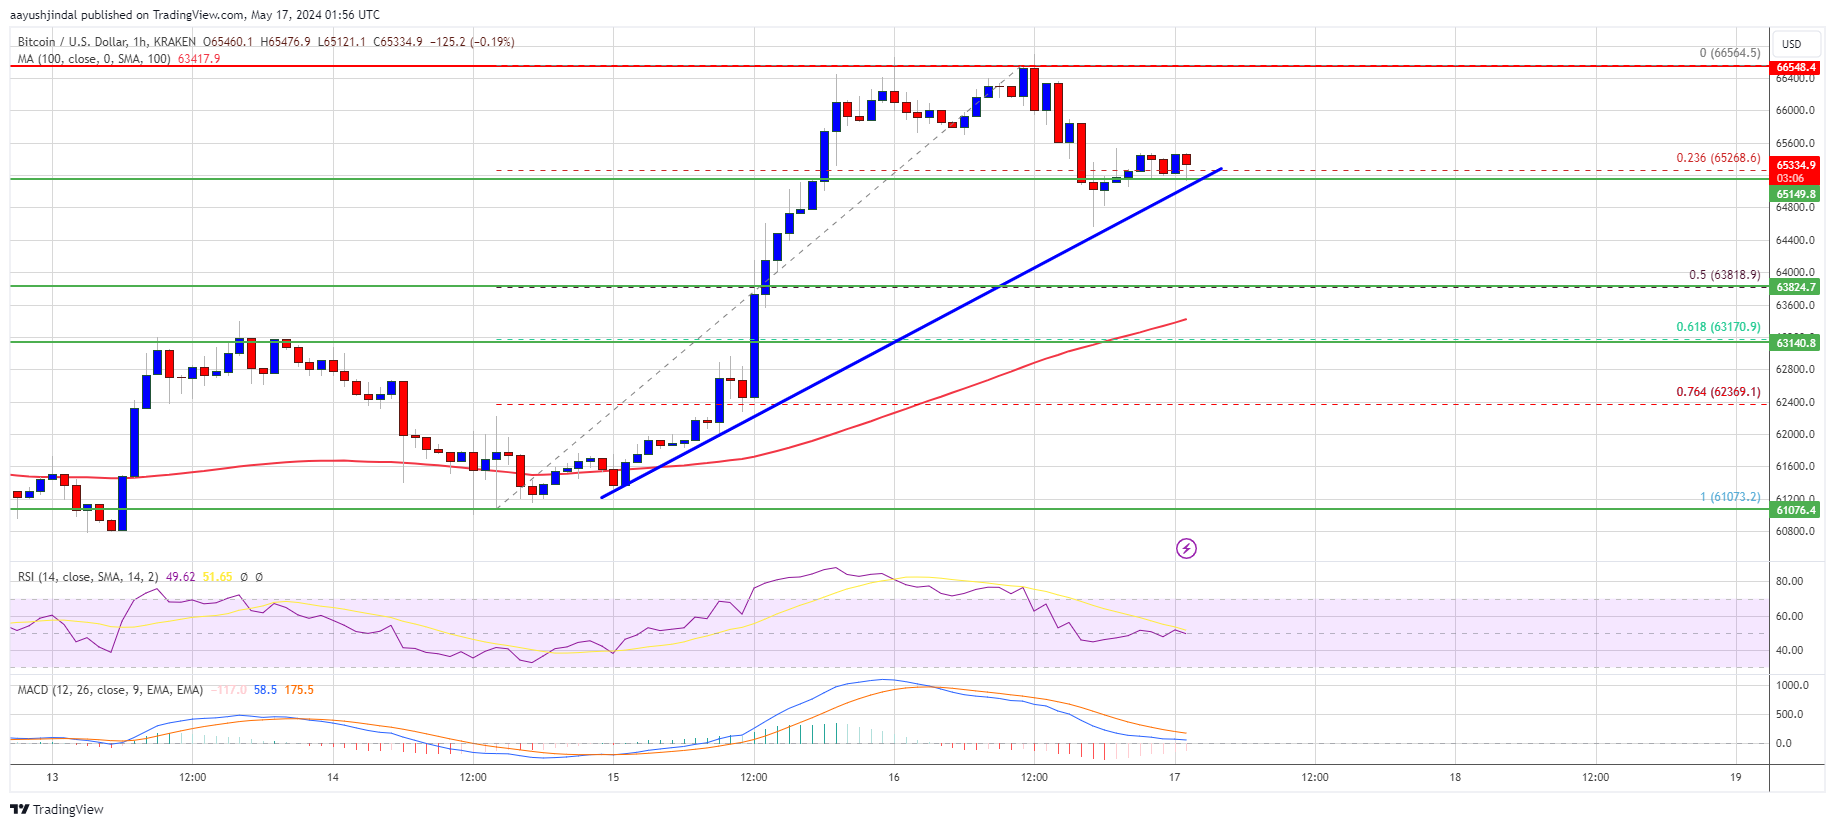
Bitcoin price formed a base and started a fresh increase above the ,500 level. BTC even cleared the ,500 resistance and tested the ,500 region. A new weekly high was formed at ,565 and the price is now consolidating gains.
There was a minor decline below the ,000 level. The price dipped below the 23.6% Fib retracement level of the upward move from the ,073 swing low to the ,565 high.
Bitcoin price is now trading above ,000 and the 100 hourly Simple moving average. There is also a key bullish trend line forming with support at ,150 on the hourly chart of the BTC/USD pair. Immediate resistance is near the ,600 level.
The first major resistance could be ,000. The next key resistance could be ,500. A clear move above the ,500 resistance might send the price higher. In the stated case, the price could rise and test the ,200 resistance.
If the bulls remain in action, the price could rise toward the ,000 resistance zone. Any more gains might send BTC toward the ,000 barrier.
Another Decline In BTC?
If Bitcoin fails to climb above the ,000 resistance zone, it could continue to move down. Immediate support on the downside is near the ,150 level and the trend line.
The first major support is ,200. The main support is now forming near ,800 or the 50% Fib retracement level of the upward move from the ,073 swing low to the ,565 high. Any more losses might send the price toward the ,150 support zone in the near term.
Technical indicators:
Hourly MACD – The MACD is now losing pace in the bullish zone.
Hourly RSI (Relative Strength Index) – The RSI for BTC/USD is now above the 50 level.
Major Support Levels – ,150, followed by ,800.
Major Resistance Levels – ,000, ,500, and ,200.
Ethereum Price Undergoes Technical Correction: Market Adjusts After Recent Increase
Ethereum price tested the ,040 zone and corrected gains. ETH is now testing the ,925 support and might aim for a fresh increase.
- Ethereum started a downside correction after the bears defended ,040.
- The price is trading below ,960 and the 100-hourly Simple Moving Average.
- There is a connecting bearish trend line forming with resistance at ,965 on the hourly chart of ETH/USD (data feed via Kraken).
- The pair could start a fresh increase unless there is a close below the ,925 support.
Ethereum Price Dips Again
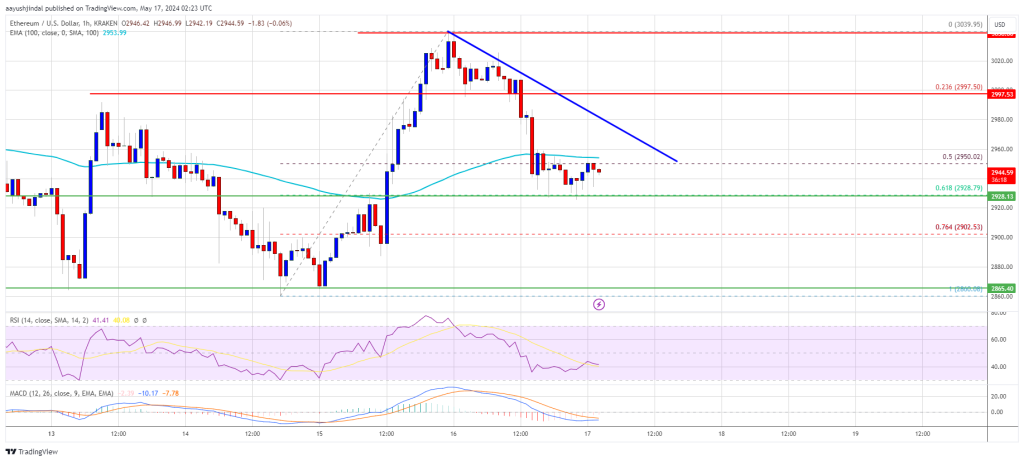
Ethereum price started a fresh increase above the ,950 and ,960 levels, like Bitcoin. ETH even cleared the ,000 level before the bears appeared near ,040.
A new weekly high was formed at ,039 and the price recently started a downside correction. There was a move below the ,000 level. Ether dipped below the 50% Fib retracement level of the upward move from the ,860 swing low to the ,039 high.
Ethereum is now trading below ,960 and the 100-hourly Simple Moving Average. However, the bulls are active near the ,925 support and the 61.8% Fib retracement level of the upward move from the ,860 swing low to the ,039 high.
Immediate resistance is near the ,960 level. There is also a connecting bearish trend line forming with resistance at ,965 on the hourly chart of ETH/USD.
The first major resistance is near the ,000 level. An upside break above the ,000 resistance might send the price higher. The next key resistance sits at ,050, above which the price might gain traction and rise toward the ,150 level. If there is a clear move above the ,150 level, the price might rise and test the ,220 resistance. Any more gains could send Ether toward the ,350 resistance zone.
More Losses In ETH?
If Ethereum fails to clear the ,965 resistance and the trend line, it could continue to move down. Initial support on the downside is near the ,925 level.
The next major support is near the ,900 zone. A clear move below the ,900 support might push the price toward ,850. Any more losses might send the price toward the ,740 level in the near term.
Technical Indicators
Hourly MACD – The MACD for ETH/USD is losing momentum in the bearish zone.
Hourly RSI – The RSI for ETH/USD is now below the 50 level.
Major Support Level – ,925
Major Resistance Level – ,965
Solana Price Skyrockets by 15%: Cryptocurrency Market Surges with SOL Momentum
Solana started a fresh increase above the 0 resistance. SOL price is up nearly 15% and might continue to rise if it clears the 5 resistance.
- SOL price recovered higher and tested the 2 resistance against the US Dollar.
- The price is now trading above 0 and the 100-hourly simple moving average.
- There was a break above a key bearish trend line with resistance at 8 on the hourly chart of the SOL/USD pair (data source from Kraken).
- The pair could clear the 5 resistance unless it fails to stay above 8.
Solana Price Starts Fresh Surge
Solana price formed a support base near the 8 level and started a fresh increase. SOL outperformed Bitcoin and Ethereum and moved into a positive zone above the 0 level.
There was a break above a key bearish trend line with resistance at 8 on the hourly chart of the SOL/USD pair. The pair even 5 resistance and spiked above 2. A new weekly high was formed at 3.76, and the price is now consolidating gains.
It is holding the 23.6% Fib retracement level of the upward move from the 1 swing low to the 4 high. Solana is now trading above 0 and the 100 simple moving average (4 hours).
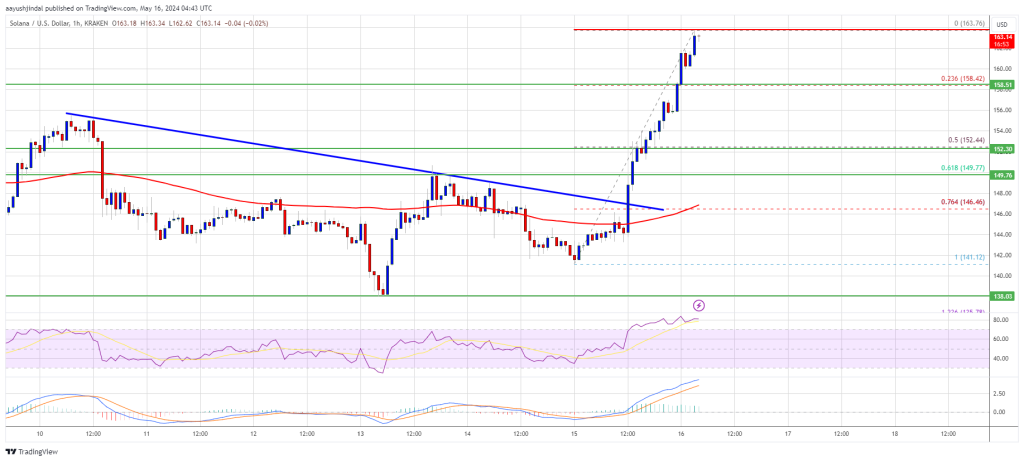
Immediate resistance is near the 5 level. The next major resistance is near the 2 level. A successful close above the 2 resistance could set the pace for another major increase. The next key resistance is near 0. Any more gains might send the price toward the 8 level.
Are Dips Supported in SOL?
If SOL fails to rally above the 0 resistance, it could start a downside correction. Initial support on the downside is near the 8 level. The first major support is near the 2 level.
The 50% Fib retracement level of the upward move from the 1 swing low to the 4 high is also at 2, below which the price could test 0. If there is a close below the 0 support, the price could decline toward the 8 support in the near term.
Technical Indicators
Hourly MACD – The MACD for SOL/USD is gaining pace in the bullish zone.
Hourly Hours RSI (Relative Strength Index) – The RSI for SOL/USD is above the 50 level.
Major Support Levels – 8, and 2.
Major Resistance Levels – 5, 2, and 0.
Oasys Partners With SBI Group’s SBINFT Market to Boost Crypto Gaming in Japan
 Oasys, a blockchain network focused on gaming, has partnered with SBINFT Market, an NFT platform operated by a subsidiary of the Japanese financial conglomerate SBI Group, to expand the crypto gaming sector in Japan. The collaboration will allow developers on the Oasys platform to sell NFTs through the SBINFT Market, which now supports Oasys’ Hub-Layer […]
Bitcoin News
Bitcoin Breaks Free: Emerging from Bearish Sentiment, Crypto Market Optimism Rises
Bitcoin price is up nearly 8% and it broke many hurdles. BTC is now consolidating gains and might correct in the short term toward ,000.
- Bitcoin started a strong increase and cleared the ,500 resistance zone.
- The price is trading above ,000 and the 100 hourly Simple moving average.
- There was a break above a key bearish trend line with resistance at ,500 on the hourly chart of the BTC/USD pair (data feed from Kraken).
- The pair could correct gains but the bulls might be active near ,000 and ,500.
Bitcoin Price Jumps 8%
Bitcoin price remained strong above the ,000 support zone. BTC formed a base and started a fresh increase above the ,000 level. There was a break above a key bearish trend line with resistance at ,500 on the hourly chart of the BTC/USD pair.
The pair rallied over 6% and broke many hurdles near the ,500 resistance. It even cleared the ,500 resistance. A new weekly high was formed at ,411 and the price is now consolidating gains.
It is holding gains above the 23.6% Fib retracement level of the recent wave from the ,073 swing low to the ,411 high. Bitcoin price is also trading above ,000 and the 100 hourly Simple moving average.
Immediate resistance is near the ,400 level. The first major resistance could be ,850. The next key resistance could be ,200. A clear move above the ,200 resistance might send the price higher. In the stated case, the price could rise and test the ,000 resistance.
If there is a close above the ,000 resistance zone, the price could continue to move up. In the stated case, the price could rise toward ,000.
Are Dips Limited In BTC?
If Bitcoin fails to climb above the ,400 resistance zone, it could start a downside correction. Immediate support on the downside is near the ,150 level.
The first major support is ,500. If there is a close below ,500, the price could start to drop toward ,500 or the 50% Fib retracement level of the recent wave from the ,073 swing low to the ,411 high. Any more losses might send the price toward the ,000 support zone in the near term.
Technical indicators:
Hourly MACD – The MACD is now gaining pace in the bullish zone.
Hourly RSI (Relative Strength Index) – The RSI for BTC/USD is now above the 50 level.
Major Support Levels – ,150, followed by ,500.
Major Resistance Levels – ,400, ,800, and ,200.
Market Expert Who Predicted Bitcoin’s Rise above $69,000 Unveils New Target
The Bitcoin rise above ,000 before the fourth halving to reach a new all-time high of ,000 in 2024 took many by surprise. However, crypto analyst BitQuant was not one of those people. In 2023, the analyst had correctly predicted that the BTC price would reach a new all-time high before the halving was completed. After the successful completion of his prediction, the crypto analyst has once again predicted where the Bitcoin price is headed, and how high it will go.
Crypto Analyst Says Bitcoin Price Will Reach ,000
BitQuant has unveiled his latest prediction for the Bitcoin price, and the target being displayed will please many who continue to be bullish. Amid the choppy headwinds that have dominated the market, the analyst believes that the Bitcoin price will surge and reach ,000.
Interestingly, the analyst does not expect the campaign to ,000 to be a long, drawn-out move. Rather, BitQuant explains that the Bitcoin price can complete this target in a single move. Such a move would mean a 50% increase in price from its current level of around ,000 and will no doubt trigger a ripple effect that will be evident in the market.
The post read:
K will be achieved in just one move, and that is quite obvious. Will that move start today, tomorrow, or the day after tomorrow? I don’t think anyone knows. If you can’t relax now and wait for #Bitcoin to perform as expected, then it’s better to leave the market to avoid the torture. Because in the coming months, there will be a lot of pain for those with weak nerves.
BitQuant’s prediction was in response to another crypto analyst, Mikybull, who identified the formation of a ‘cup and handle’ pattern on the Bitcoin crash. The analyst believes that this formation will precede a massive breakout that will send it to a “cycle top.”
Is 0,000 Still In Play?
Back in 2023, when BitQuant made the initial prediction that Bitcoin would reach a new all-time high before the halving, he had set out a price target for the cryptocurrency. As the crypto analyst explained at the time, reaching a new all-time high before the halving, although it has never happened before, does not mean that it will peak by then.
Rather, the analyst expects the bull rally to continue well after the halving, which is when the price will peak. BitQuant’s target at the time was the price peaking at 0,000 at the top of the cycle. However, this target has not made an appearance in his analyses in recent times.
The most recent predictions circle around the ,000 target and the analyst expects it to hit this price in May. In a prediction from April, BitQuant expects that the price will first go to ,000, before recovering to ,000, and then surge to ,000.
First K,
Then K,
Now K.
What’s next will be revealed after we hit K and take a little break in the tent. #Bitcoin https://t.co/yvKyHZZWQw— BitQuant (@BitQua) April 25, 2024