 According to Nikita Ovchinnik, founder of Barter Defi, decentralized finance (defi) protocols are increasingly becoming the primary target of most hacking attacks because defi “lays bare its inner workings for all to see.” He said the open-source nature of defi means hackers and malicious actors have ample time to study and identify weaknesses or vulnerabilities […]
Bitcoin News
Ethereum Whales Go On Buying Spree As Market Crash Leaves Retail Panicking
Ethereum, one of the leading cryptocurrencies, finds itself amidst a price decline alongside the broader crypto industry. This downturn has been exacerbated by escalating tensions in the Middle East, casting a shadow of uncertainty over the market. As the majority of cryptocurrencies experience a bleed in value, Ethereum is not immune to the trend. However, while retail investors panic-sell their holdings, on-chain data presents a different picture. Big player whales in the market are seizing the opportunity to accumulate assets, displaying a bullish sentiment amid the turmoil.
Particularly, on-chain data from Lookonchain has shown an Ethereum whale accumulating during the price decline. Interestingly, the timeline of accumulation suggests that this whale has been in action even before the escalating tensions in the Middle East.
Ethereum Whales Accumulate During Market Downturn
On-chain transaction tracker Lookonchain has noted both a selloff and accumulation trend from different Ethereum whales in the past few days. One of the latest accumulations came from a whale that has been on constant withdrawals from crypto exchange Binance.
As revealed by Lookonchain, whale “0x4359” has withdrawn 62,141 ETH worth 2.6 million from Binance in the past five days. This whale’s latest withdrawal from Binance was less than 12 hours ago, where they withdrew 37,018 ETH worth 0.7 million.
Ethereum on the other hand, has fallen from ,722 to as low as ,866 in the last five days, representing a 23% price decline. In a similar manner, 7,300 ETH worth .8 million were transferred from Binance into “0xE347,” a newly created whale wallet.
It seems that whales bought $ETH at the bottom!
Whale”0x4359″ withdrew 37,018 $ETH(0.7M) from #Binance 4 hrs ago and this whale has withdrawn 62,141 $ETH(2.6M) from #Binance in the past 5 days.https://t.co/41366OnM5Y
Fresh whale wallet”0xE347″ withdrew 7,300 $ETH(.8M)… pic.twitter.com/qEtTSYU3Us
— Lookonchain (@lookonchain) April 13, 2024
That said, Lookonchain also noted a trend of whales selling off their holdings. One example of such selloffs came from whale address “0xaF35” who deposited 6,700 ETH worth .65 million into Binance immediately before the price drop. It’s important to note that this same whale withdrew 26,698 ETH worth .3 million from Binance between Feb. 7 and April 1.
In another social media post, Lookonchain revealed four whales dumping 31,683 ETH worth 6 million during the price drop.
What’s Next For Ethereum?
The ETH accumulation and selloffs from different whale cohorts highlight the contrasting trading strategies between large holders of the crypto asset. While some are selling off, others are taking advantage of the low prices and buying the dip.
It would seem the whale accumulation is still outweighing selloffs from their counterparts at the time of writing. Despite this, a selloff from retail investors has tipped the price action in favor of the bears. As a result, Ethereum now finds itself trading around the ,000 price level, which remains a crucial price level.
A continued accumulation from whales could eventually tip the price of Ethereum to the side of the bulls as tensions in the global market start to subside. We could then see Ethereum hold up above ,000 and surge upwards at least till it reaches ,200. A continued selloff could lead to a further price decline, causing Ethereum to break below ,000.
Featured image from Pexels, chart from TradingView
Riding The Ripple: XRP Stellar 1-Year Performance Leaves Banks In The Dust
XRP holders are facing mixed signals. While the digital asset boasts nearly 20% in gains over the past year, significantly outperforming traditional savings accounts, its recent performance pales in comparison to other cryptocurrencies.
After a substantial decline, the altcoin’s price has now entered a phase of sideways consolidation, making market players unsure of its future course. It appears like the cryptocurrency will likely stay stuck in a narrow range until there is a breakout in either way.
XRP: Beating Savings Accounts
Despite the seemingly negative vibe, a recent report highlighted the coin’s resilience. Specifically, it underscored its advantage over stagnant savings accounts.
XRP hit a low of .42 in March 2023 and surged to .93 in July, fueled by optimism surrounding the Ripple vs. SEC lawsuit. The coin then saw a rise of 1.30% on Sunday. After losing 1.35% on Saturday, the altcoin gained 0.41% at the end of the week to close at .6299. Today, it sits at .61, reflecting a 20% year-over-year increase.
This dwarfs the returns offered by most savings accounts. A Business Insider report pegs the average Annual Percentage Yield (APY) for US savings accounts between 0.01% and 0.25%. Even high-yield online banks rarely surpass 5.30% APY.
XRP is up over 6% within a single year, it has outperformed every savings account of every bank in the world and yet you people are still crying about it. pic.twitter.com/GGxVPJfudU
— Mr. Huber
(@Leerzeit) March 29, 2024

“Mr. Huber,” a prominent crypto community investigator, emphasizes this point. To paraphrase his views, he said while XRP might not be setting the crypto world on fire right now, it’s definitely a better option than letting your money languish in a savings account.
However, discontent simmers within the community. Over the past three months, XRP has seen a meager 1% growth, while rivals like Bitcoin and Ethereum have skyrocketed by over 50%. This lackluster performance compared to its peers is causing frustration among holders.
The future trajectory of XRP hinges on multiple factors. The ongoing Ripple vs. SEC lawsuit, which centers around whether XRP is a security, is a significant cloud hanging over the coin’s price. A favorable outcome could reignite investor confidence and propel XRP upwards.
Diverse Perspectives And Pressure In The Crypto Market
Another factor is the broader cryptocurrency market. If the current bull run continues and other top coins maintain their momentum, XRP might face additional pressure to catch up.
Analysts remain divided on XRP’s short-term prospects. Some believe the current stagnation is a buying opportunity before a potential price surge. Others urge caution, citing the ongoing lawsuit and the unpredictable nature of the cryptocurrency market.
The diverse perspectives surrounding XRP showcase the exciting array of options available to investors. With XRP presenting a compelling alternative to conventional savings methods, its unique features shine through.
Despite recent fluctuations in its performance compared to other digital assets, this opens up opportunities for thoughtful consideration and strategic investment. Ultimately, the choice to embrace XRP hinges on aligning with one’s personal risk appetite and long-term investment objectives, empowering individuals to make informed decisions tailored to their financial aspirations.
Featured image from Karolina Grabowska/Pexels, chart from TradingView
Ethereum Leaves Bitcoin Behind, But Is This Rally Sustainable?
Ethereum has left Bitcoin in the dust with its latest rally towards ,100. Here’s whether this run is sustainable based on futures market data.
Ethereum Has Separated From Bitcoin With Over 7% Jump In Past Week
While Bitcoin has been in consolidation lately, Ethereum appears to have been putting together bullish momentum entirely of its own, as the asset has jumped more than 7% in the past week.
The chart below shows how ETH has performed during the last month.
In the last 24 hours, Ethereum reached a peak of ,130 level, a mark it only reached for the first time since the first half of April 2022. Since then, the coin has come down a bit, as it now floats around ,100.
Nonetheless, despite this small retrace, ETH has still performed notably better than the original cryptocurrency. Now, the asset’s investors might be wondering if the coin could continue this run. Perhaps data related to the futures market might shed some light.
ETH Funding Rates Have Been At Positive Levels Recently
As pointed out by an analyst in a CryptoQuant Quicktake post, the ETH funding rate has had positive values recently. The “funding rate” is an indicator that keeps track of the periodic fees that traders on the futures market are exchanging between each other right now.
When the value of this metric is positive, it means that the long holders are currently paying a premium to the short investors to hold onto their holdings. Such a trend implies the majority sentiment in the futures market is bullish.
On the other hand, the indicator being negative implies a bearish sentiment is dominant in the sector right now as the short holders outweigh the long traders.
Now, here is a chart that shows the trend in the 30-day simple moving average (SMA) of the Ethereum funding rate over the past couple of years:

As the above graph shows, the 30-day SMA Ethereum funding rate had shot up to extremely high levels in the first half of January. Interestingly, this is when the market top due to the Bitcoin spot ETFs occurred.
After the price drawdown following the event, the funding rate calmed as the longs that had piled up saw liquidation. As the recent rally in the coin has occurred, the funding rate has once again gone up.
However, This time, the 30-day SMA Ethereum funding rate isn’t quite at the extreme levels it was last month. This could mean that the futures market isn’t yet too overheated.
Naturally, this could potentially allow for the current Ethereum rally to go on for a while still. It should be noted, though, that as the funding rates go higher, the chances of a long squeeze taking place go up.
Thus, while ETH may not be quite at the same risk as last month, a long squeeze could still be on the horizon, becoming more probable to happen as the speculators continue to open up more positions.
Tellor (TRB) Leaves Market In Shock With 75% Price Crash, Here’s What Happened
Tellor (TRB) went on a rollercoaster in the past 24 hours, with its price experiencing a surge and a drop that is comparable to that of price manipulation. As a result, the crypto surged to over 0 in the late hours of 2023 before crashing down to 7.
According to data from CoinGlass, TRB witnessed more liquidated positions than any other crypto within this time period, with whales exiting both long and short positions amidst rumors of manipulation.
Wow $TRB pic.twitter.com/TgYqWNtC0u
— Tony “The Bull” (@tonythebullBTC) December 31, 2023
TRB Price Action And Liquidation
TRB has been on a steady price increase since the beginning of the month. This increase was particularly exacerbated on December 31, pushing the crypto to a new all-time high of 2, and a 1000% increase in trading volume, according to Coinmarketcap data. However, this price surge failed to last more than a few hours, as TRB plummeted to 9.
This price volatility saw TRB lead the market in liquidations on both long and short positions. According to CoinGlass, the crypto market saw a total of 7 million liquidated positions in the past 24 hours, with TRB leading with .93 million, quite unusual for such a low market cap altcoin. ETH and BTC followed with .7 million and .74 million worth of liquidated positions.
While the reason for the astounding price spike is unclear at the moment, the subsequent crash has been attributed to price manipulation from the Tellor team. According to a post on X (formerly Twitter) by Lookonchain, the Tellor team deposited 4,211 TRB worth approximately .4 million on Coinbase as the price skyrocketed.
In the past 24 hours, $TRB soared to 0 and then plummeted to 7, causing M of assets to be liquidated, making it the most liquidated token.
We noticed that the #Tellor team deposited 4,211 $TRB(.4M) after the price of $TRB skyrocketed.
Address:https://t.co/efHPXCiMiG pic.twitter.com/IBty2Wf2gI
— Lookonchain (@lookonchain) January 1, 2024
Price manipulation is certainly not a new phenomenon in the crypto industry, especially among low market-cap altcoins. The transfer into Coinbase has got investors wondering about a selloff from the team, as TRB crashed in the hours after. Nonetheless, this remains a speculation at this point.
TRB is the utility token for Tellor, a decentralized oracle network that provides real-world data to blockchain-based smart contracts. TRB mostly traded below for the majority of the year. Things started to get hot in September as the cryptocurrency started to exhibit a very high level of volatility at this point. TRB kickstarted a sustained price surge in the middle of September that saw it reach 0 on November 9. After reaching this point, it went through a price dip throughout the month to the end of November at around .
December saw a change in momentum, with price action indicating a steady surge since the beginning of the month. At the time of writing, TRB is trading at 1, still up by 143% in a 30-day timeframe.
Solana Q4 Triumph: Soaring Activity Leaves Ethereum In The Dust – Report
Solana (SOL) has undeniably emerged as a standout performer in the recent cryptocurrency landscape, showcasing a remarkable surge in value that has captured the attention of market participants.
Its extraordinary performance, marked by substantial gains, has propelled Solana beyond the ranks of other leading cryptocurrencies, securing a coveted position among the top five by market capitalization.
Solana’s Surge: Outshining Rivals, Proving Dominance
The impressive rally of Solana stands as a testament to the blockchain’s underlying strength and the growing confidence of investors in its capabilities.
This bullish momentum has not only allowed SOL to outshine some of the traditionally dominant cryptocurrencies but has also affirmed its relevance and potential within the broader digital asset ecosystem.
The daily user activity on Solana has increased as a result of this outstanding performance. As the year’s final quarter draws to a close, the most recent statistics reveals a noteworthy growth of about 400%. According to a recent study by on-chain data company Messari, this far outpaced Ethereum’s pitiful 3% gain.
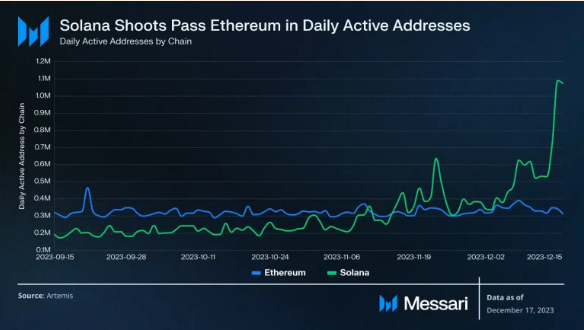
The research firm claims that several protocols located within the Layer 1 (L1) blockchain network have completed a series of token airdrops, which is what is responsible for the recent rise in new demand for Solana.
On December 16th, the trading volume of decentralized exchanges (DEX) on Solana temporarily surpassed that of Ethereum for the first time. This occurred as the smart-contract-enabled blockchain ecosystem continued to expand.
According to data from DeFillama, Ethereum’s trading volume during that time was only .164 billion, whereas the trading volume of DEXs on the blockchain surpassed .5 billion.
Bitfinex Cheers Solana
One of the biggest cryptocurrency exchanges in the world, Bitfinex, recently tweeted about Solana’s expansion. The tweet claims that in the previous three months alone, SOL’s price has increased by more than 340%.
Good morning, @Solana fam!
Today’s a great day to celebrate the 343% growth of $SOL. From .80 per SOL 3 months ago to .94 today! Stay bullish.https://t.co/Ltajh1l15C
— Bitfinex (@bitfinex) December 18, 2023
Three months later, the token’s value had increased to .94 from .80 at the start of its bull surge.
As this developed, Jupiter, one of the biggest decentralized finance (DeFi) protocols on Solana and a swap aggregator, revealed that its much awaited 4 billion JUP token airdrop would happen in January.
$SOL is on a tear.
For the first time since 2021, the SOL/ETH price ratio saw a strong reversal as the Solana network recovers from the devastating collapse of FTX. pic.twitter.com/hAlCC23Yq0
— Kaiko (@KaikoData) December 19, 2023
Meanwhile, data analytics provider Kaiko said Solana is seeing a sharp increase in price, and the price ratio of SOL to ETH is strongly reversing.
The Solana (SOL) to Ethereum (ETH) ratio is close to 0.04, according to a post on X published on December 19. Prior highs were around 0.06 in 2021 and lows were at 0.01 in early 2023.
At the time of writing, the price of SOL is currently trading at .40, up 3.5% over the last day and rallying 17% over the last week, data from CoinMarketCap shows.
Featured image from Shutterstock
Shiba Inu Community Leaves Shibarium Launch Troubles Behind As Wallet Count Crossed 10 Million
Shibarium, the scaling solution from the Shiba Inu team, has achieved new milestones after experiencing a significant wave of adoption and user engagement following its launch.
SHIB Community Euphoria Sparks Shibarium Meteoric Rise
According to a report on August 21, the Shiba Inu ecosystem recorded an astonishing number of new wallets, with over 10 million wallets registered following the launch of the Shibarium network. The layer-2 network also recorded over 160 million compute units and a large deposit of ETH and BONE tokens, 1,000 and 600,000 respectively.
Shibarium’s unexpected rise in user adoption has not been the only noteworthy change the layer 2 scaling solution has experienced. According to reports, Shibarium has experienced a staggering increase in BONE staking. Over 7,569,580 BONE Shibaswap tokens were staked on the Shibarium network.
The Shiba Inu community’s response to the Shibarium launch has left the SHIB team members dumbfounded. The enormous engagement from the community reportedly led to a temporary suspension of Shibarium for 30 minutes as the network’s capacity was overwhelmed by the unusual level of user activities.
Lucie, a marketer for the Shiba Inu ecosystem, was astonished by the overwhelming success Shibarium experienced. She revealed in a post on X that the Shiba Inu development team had miscalculated the amount of adoption and interest the Shibarium mainnet would garner.
Let’s be honest!
My $BONE, $SHIB, and $LEASH dropped a lot, just like the whole market.
Was I unhappy with @ShytoshiKusama?
No!
They kept their promises, but they made one mistake.
They didn’t understand how much the #SHIBARMY wanted to be on #Shibarium.
I’m glad they… pic.twitter.com/z6kUSpUKQx
— 𝐋𝐔𝐂𝐈𝐄 | Summer of Shibarium (@LucieSHIB) August 20, 2023
She also highlighted that the unexpected surge in adoption may have been fueled by the community’s desire to embrace the benefits of potential low-cost transactions and increased efficiency on the Shibarium mainnet.
Shiba Inu Lead Developer Addresses Shibarium Network Issues
Following the temporary halt of the Shibarium network, Shiba Inu’s head developer, Shytoshi Kusama addressed investors’ concerns regarding the halt. He pointed out that the issues rose from an unexpected increase in users, while reports revealed that transactions on Shibarium were paused for over 10 hours as a result of a server failure and a faulty bridge.
Kusama has, however, reassured the SHIB community, stating that the Shibarium mainnet was proceeding smoothly. He explained that the Shibarium network was undergoing various tests and reconfigurations to ensure that the network can withstand a high influx of users in the future.
He further added that several features have been integrated into the network including a rate-limiting at RPC level and an auto server reset to prevent future outages. Following this, reports suggest that Shibarium’s testing processes have seen significant success and the network is poised to reopen soon.
Bitcoin Leaves Major Assets in the Dust: Surges 80% in the First Half of 2023, Soars to 12th Largest Global Asset
In the first half of 2023, eye-opening statistics reveal that bitcoin (BTC), the leading cryptocurrency, demonstrated remarkable performance by surpassing various significant assets such as the Nasdaq Index, Nikkei 225 Index, Dow Jones, S&P 500, Russell 2000, spot gold, the U.S. Dollar Index, and the Japanese yen, among numerous others. Moreover, amidst the top assets ranked by market capitalization, BTC soared an impressive 14 positions, climbing to become the 12th largest asset based on market valuation since the conclusion of 2022.
Bitcoin Defies Odds Among the World’s Most Valuable Assets and Currencies
In stark contrast to the challenging “Crypto Winter” experienced throughout 2022, bitcoin has shown remarkable resilience this year. In the first half of 2023, BTC surged by over 80% against the U.S. dollar, solidifying its position as one of the standout performers among a vast array of global assets.
This impressive achievement was highlighted by Colin Wu, a Chinese journalist known for blockchain reporting, who took to Twitter on July 1 to share the market performance of BTC alongside a multitude of other prominent assets.
“Data shows that in the first half of 2023, Bitcoin increased by 83.8%, ranking first, far exceeding other major assets in the world,” the crypto reporter tweeted. “The Nasdaq Index rose 31.7%, ranking second, and other major national stock markets rose. The price of natural gas fell by 37%, ranking the bottom, and the prices of other energy sources all fell.”
Colin Wu’s tweet provided an intriguing comparison of assets against BTC, encompassing a wide range of influential players such as the Nasdaq Index, Nikkei 225 Index, Germany DAX Index, Euro Stoxx 50, S&P 500, Shanghai Composite, and major currencies like the yuan, yen, pound, ruble, and 10-year U.S. Treasury notes.
As of July 5, 2023, at 10:40 a.m. (ET), the numbers speak for themselves: BTC has skyrocketed by a staggering 80.96% against the U.S. dollar since December 27, 2022. Back then, each unit of BTC was valued at ,768, but today, it has firmly surpassed the K threshold.
Delving into archived data from December 27, 2022, we discover that BTC was once ranked as the 26th largest asset globally based on market capitalization. Over the course of the last half-year, BTC has soared to claim the 12th spot among the world’s most valuable assets.
Currently, it stands above TSMC, the prominent semiconductor manufacturer, and just below Berkshire Hathaway, the renowned investment firm helmed by the financial moguls Warren Buffet and Charlie Munger.
On Wednesday, Berkshire Hathaway’s market capitalization is above BTC’s by 2 billion. Interestingly, Berkshire Hathaway’s lackluster performance during this period pales in comparison to the gains achieved by BTC in the first half of the year, as Berkshire shares only witnessed a modest rise of 7.54%.
What are your thoughts on Bitcoin’s exceptional performance in the first half of 2023? Do you believe this trend will continue, or do you anticipate a shift in the market dynamics? Share your thoughts and opinions about this subject in the comments section below.
Crypto Neobank Wallbit Leaves Venezuela Due to Sanctions

Wallbit, a crypto-enabled neobank, announced it would stop serving users in Venezuela after its banking partner in the U.S. called on it to do so. The platform announced this move was the direct result of the economic sanctions that the country is currently facing, and that Venezuelans outside the country would continue to be served.
Wallbit to Cut Service to Venezuelan Users
Wallbit, a cryptocurrency-enabled neobank, that advertised itself as being able to open bank accounts for its users in the U.S., announced it will stop service to users who reside in Venezuela.
The platform issued a press release on February 24, clarifying that its banking associates were calling for the closing of all accounts opened by Venezuelan users residing in Venezuela, telling these users to withdraw their funds as quickly as possible, even as Wallbit did not indicate a date at which these accounts would be terminated.
The company clarified that Venezuelan users living abroad would be still able to use its services, but that they should contact company support in this situation. The situation might affect Venezuelan freelancers that use the platform to collect their wages abroad and convert them to crypto.
Another Platform Closes Due to Sanctions
Wallbit clarified that the reason for this abrupt decision is directly related to the sanctions that the government of the U.S. is currently exerting against some Venezuelan nationals and state companies in the country. In its press release, the company declared:
We would like to clarify that this account closure has its cause in the sanctions that the U.S. government has on Venezuela, so we have the duty of disabling the creation of new accounts, and disallowing new deposits coming from accounts created by users residing in Venezuela.
This is not the first financial platform to cut ties with Venezuelan users due to the risk of being hit by sanctions. In June, Uphold, a New York-based cryptocurrency exchange and investment platform, announced it was also closing the accounts of Venezuelan users due to the “increasing complexity of complying with U.S. sanctions.”
In a similar way, Paxful, a P2P cryptocurrency exchange, announced in 2020 it would cease to offer its services in the country. At the time, the platform cited “concerns regarding the regulatory landscape around Venezuela and Paxful’s own risk tolerance” as the main cause behind this decision.
What do you think about Wallbit and its exit from Venezuela? Tell us in the comments section below.
Money Leaves ADA, SOL To Small Cap Altcoins, Here’s Where It’s Headed
With the crypto market rally, altcoins have benefitted just as much as bitcoin. Digital assets across the space have been able to return to their pre-FTX collapse levels, signaling the start of a bull run. However, as the market begins to settle into this new normal, investors are moving gains around from larger cap assets to take advantage of possible price movement in smaller altcoins.
Cycling Out Money To Small Cap Altcoins
A recent report from on-chain data aggregation website Santiment shows that investors may be moving money out of larger cap coins such as Cardano and Solana and moving to small cap coins. This paints a picture of a rotation of funds rather than outright pulling money out of the crypto sector.
Santiment notes that the large gains recorded by the likes of Solana, Cardano, and Polkadot are now being moved into smaller altcoins. Most of these coins are top 200 and below tokens with market caps lower than 0 million.
The cycling of funds into these smaller altcoins is shown by their address activity. The image shared by Santiment shows a significant uptick in the address activities of these coins. Most notably, the uptick was seen from last week as a lot of these larger cap coins hit new local peaks.

The small cap coins mentioned in the report are TRADE, RBN, SLP, PLSPAD, POND, MITX, MTH, and CBG. Most of these are coins flying under the radar. Ribbon Finance (RBN) which is the most prominent on the list is only at a 9.7 million market cap but has risen 24% in the last seven days.
What Happens To These Tokens?
The tokens mentioned by Santiment are still small enough that they can see prominent movement with just a fraction of the amount needed to move the prices of the likes of SOL and ADA. This means that if this rotation of gains from large caps to small cap altcoins continues, then these tokens could see positive movement in the coming days.
However, for coins with such low market caps, just as it is easy to pump their prices, it is also just as easy to drag their prices down with sell-offs from a few large holders. It becomes a double-edged sword for investors who follow the movement. On one hand, it could mean very large gains in a short time, but on the other hand, could see them lose money fast.
A good thing about this though is that attention is being spread out instead of just focusing on a handful of coins. As wallet activity rises for these altcoins, it could trigger exploration into similarly priced altcoins which could benefit from new interest.