 According to a recent earnings filing, Edmond de Rothschild Holding S.A., a private banking and asset management entity linked with the distinguished Rothschild banking family from France, holds shares in Grayscale’s GBTC and Blackrock’s IBIT. Edmond de Rothschild Holding’s 13F Filing Reveals Investment in Grayscale and Blackrock Bitcoin ETFs For years now, speculative discussions on […]
Bitcoin News
Bitcoin On-Chain Activity Nearing Historic Lows – What This Means For BTC Price
The price of Bitcoin has continued to move within a consolidation range since hitting a new all-time high in mid-March. This sluggish price action has been a source of worry to most investors, especially when the premier cryptocurrency recently lost its support at the ,000 level.
Interestingly, price is not the only Bitcoin metric that has cooled off since the first quarter of the year. Data analytics firm Santiment has revealed that on-chain activity on the Bitcoin network has also slowed down over the past few months.
How Historically Low On-Chain Activity Affects BTC Price
In a new post on the X platform, Santiment revealed that on-chain activity on the Bitcoin network is approaching historic lows. This revelation is based on the noticeable downtrend in various metrics, notably transaction volume, daily active addresses, and whale transaction count.
According to the blockchain intelligence platform, investors have been transacting less with BTC since the premier cryptocurrency hit a new all-time high price. As a result, Bitcoin’s on-chain activity has dropped to its lowest level since 2019.
Breaking down the metrics, Santiment found that transaction volume on the pioneer blockchain is falling to its lowest in the past decade. The data analytics firm defines transaction volume as a metric that tracks the total amount of coins transacted for a given asset within a timeframe.
What’s more, Santiment mentioned in its report that the number of daily active addresses, which measures the number of distinct addresses that participated in a BTC transaction on any given day, has reached its lowest point since January 2019.
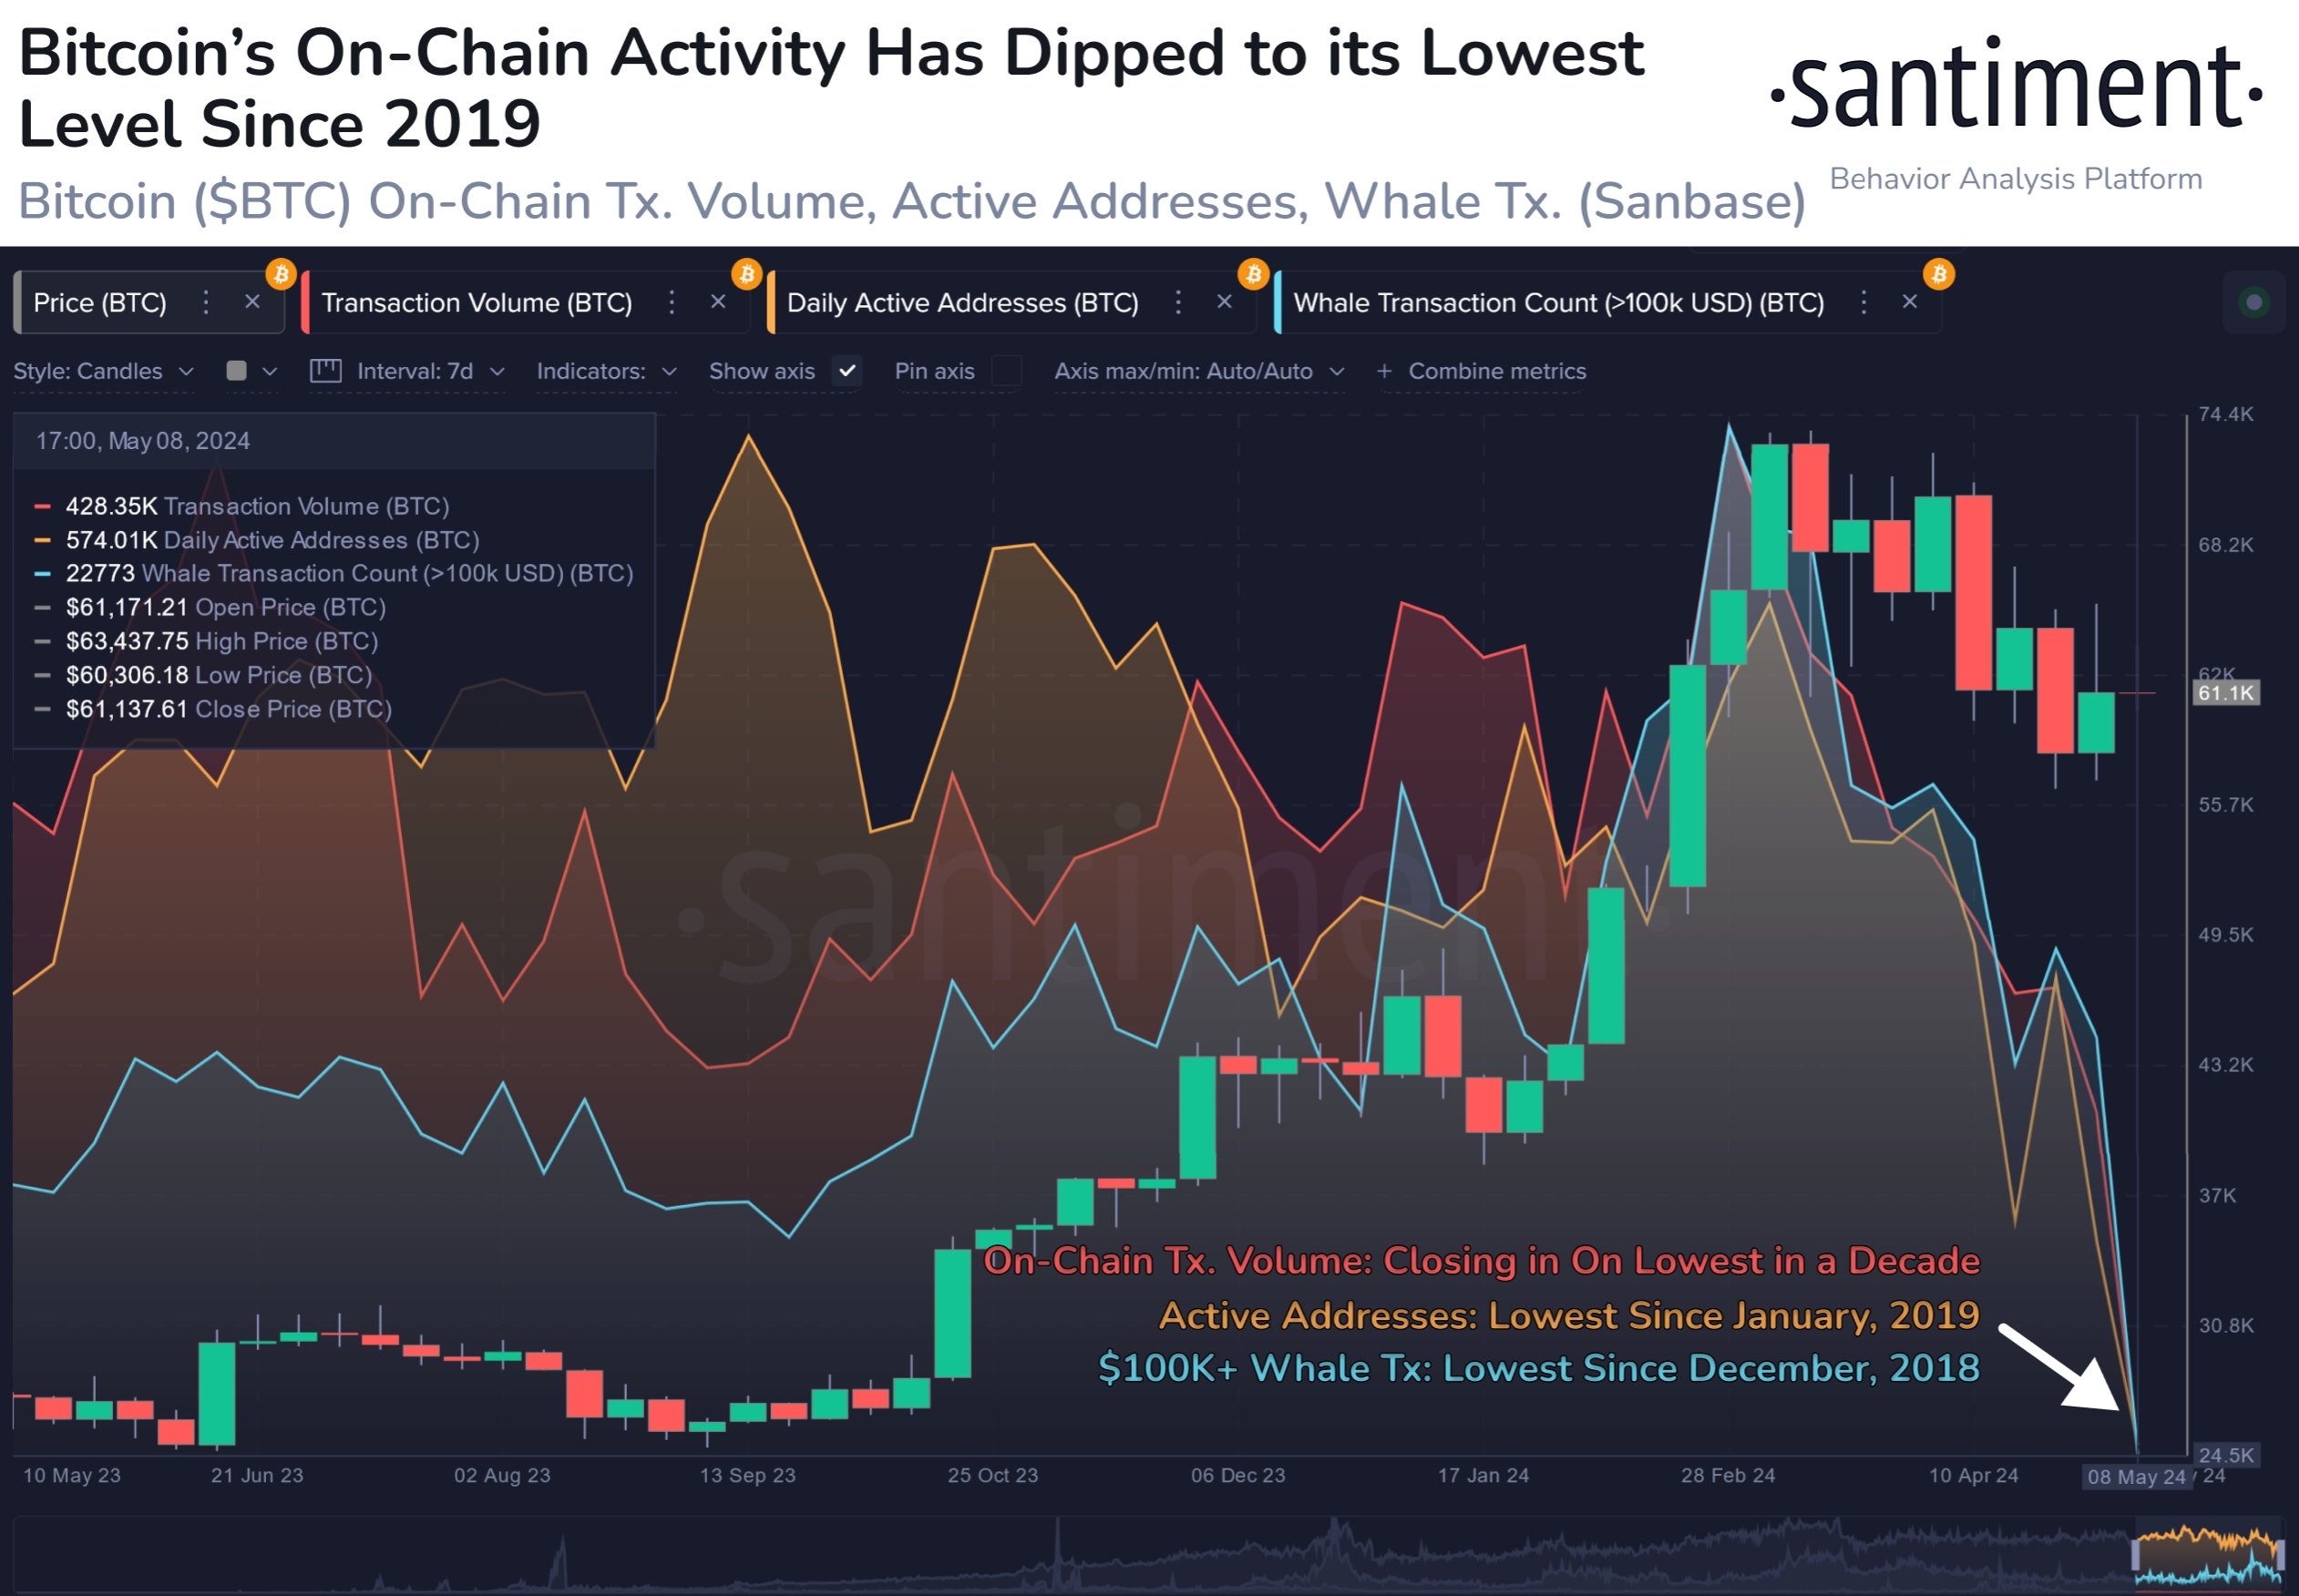
The blockchain intelligence platform also revealed that whale activity has slowed down on the Bitcoin network. The number of whale transactions (greater than 0,000) has fallen to the lowest point since the end of 2018, according to Santiment’s data.
On the surface, the decline in on-chain activity seems like a worrying trend and a symptom of an unstable market health. Santiment, however, noted that this dip might not necessarily be associated with imminent BTC price dips – as seen in the past weeks.
The analytics company said that the decline in on-chain activity is more indicative of “crowd fear and indecision” amongst traders. Ultimately, this underscores the connection between the on-chain activity and sentiment in the Bitcoin market.
Bitcoin Price At A Glance
According to data from CoinGecko, the price of Bitcoin sits just above ,770, with a mere 0.2% price dip in the past day.
Bitcoin Conference to Bring Star-Studded Lineup of Speakers to Hong Kong on Dawn of Historic ETFs
 PRESS RELEASE. Excitement is brewing in the heart of Asia as Hong Kong regulators pave the way for a new era of innovation with the recent approval of spot Bitcoin exchange-traded funds (ETFs). This groundbreaking development underscores Hong Kong’s commitment to becoming a regulated hub for Bitcoin. At the same time, the Bitcoin Conference is […]
Bitcoin News
Historic Yield Curve Inversion Reaches 656 Days, Echoing Pre-Stock Market Crash Patterns
 Based on the latest data, the yield curve of the U.S. Treasury, which charts the yields for two-year and ten-year bonds, has remained inverted for a total of 656 days. This latest inversion joins previous records set in 1929, 1974, and 2008, all of which preceded substantial declines in the stock market. Recently, market observers […]
Bitcoin News
Bitcoin Halving, Runes Proliferation Results in Historic Fee Increases, Crypto Community Reacts
 Following the Bitcoin halving event, onchain fees climbed to over 0 per transaction just an hour later, and as of now, a high-priority transfer costs between and per transaction at 10:30 a.m. Eastern Time on Saturday. The increasing fees have prompted a flood of comments from individuals in the crypto space, as this […]
Bitcoin News
Dogecoin Rally Intensifies: Eyes Set On Historic New Highs
After a retracement from its current high of .22960, the price of Dogecoin (DOGE) looks like it is not yet done as the memecoin bounced back and moving toward its current high.
Dogecoin Price Technical Analysis
Dogecoin is one of the few memecoins that have captured the hearts of many crypto investors. Like Shiba Inu and Pepecoin (PEPE), Dogecoin is backed up by a strong and exciting community which has played a huge role in its success so far.
At the time of writing, the price of DOGE was trading around .19713 and was up by over 5% in the last 24 hours. Also, the price is currently trading above the 100-day moving average with very strong bullish momentum in the 4-hour timeframe.
The MACD indicator in the 4-hour timeframe suggests an upward spike. This is so because the MACD line and the MACD signal that was trending below the zero line have both crossed, heading toward the MACD zero line.
If the MACD line and the MACD signal line manage to cross above the MACD zero, Dogecoin might move higher to create a new high. Meanwhile, the MACD histogram is already trending above the zero line which suggests a bullish momentum.
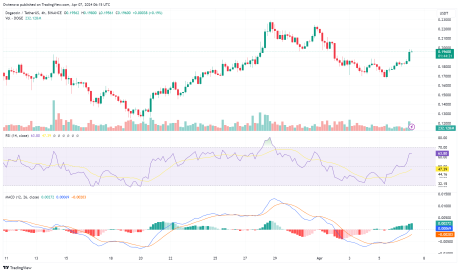
The Relative Strength Index (RSI) on the 4-hour timeframe also indicates a bullish momentum toward the upward direction as the RSI signal line has crossed above the 50% level and is heading towards the overbought zone. According to the RSI indicator, the strength of the upward movement is still very strong as buyers are still very active in the market.
Potential Retracement On The Downside
Given the price’s previous surge, two major resistance levels and one major support level were created around .22960, .2244, and .19622 respectively. If the price of DOGE manages to move above the resistance level of .22441 level, it might move even further upward toward the resistance level of .22960.
At this point, if the price succeeds in breaking above this level, the price might surge higher to create a new high. On the other hand, if the price fails to break above this resistance level, the price might start a new downward movement toward its previous support level of .19622. However, a breakout below the .19622 level could trigger a new downward trend.
Get Ready For A Bitcoin Cash Revolution: Analyst Forecasts Historic Breakout
Bitcoin Cash (BCH) is stirring excitement in the cryptocurrency community after respected analyst Rekt Capital posted a potentially game-changing analysis. The analysis suggests BCH might be on the cusp of overcoming a long-standing downtrend and achieving a “monumental milestone.”
For BCH enthusiasts, this potential breakout represents more than just a technical victory. It could be a turning point that ushers in a new era for the cryptocurrency. Historically, BCH has flirted with overcoming the downtrend, only to fall back within its boundaries. However, Rekt Capital believes this time might be different.
The key takeaway from my analysis is the possibility of Bitcoin Cash finally closing a monthly candle above the macro downtrend line, Rekt Capital stated in the analysis.
$BCH / USD – #BCH #BitcoinCash
Bitcoin Cash is on the cusp of making history
BCH formed upside wicks past this Macro Downtrend in the past
But it is very likely we will soon see BCH Monthly Candle Close beyond the Macro Downtrend for the first time ever#BTC #Crypto #Bitcoin https://t.co/v6gA4Wisti pic.twitter.com/IP7OB0F2OJ
— Rekt Capital (@rektcapital) March 29, 2024
The significance of such a move lies in its potential to attract new investment. A confirmed breakout would be a strong bullish signal, potentially swaying investors who have been hesitant about BCH’s future. This, in turn, could lead to a rise in BCH’s valuation and solidify its position in the ever-evolving cryptocurrency landscape.
Industry leaders point to a successful breakout as a major vote of confidence for Bitcoin Cash. It would demonstrate BCH’s underlying strength and resilience in a notoriously volatile market.
While the anticipation surrounding BCH is palpable, some caution remains. The cryptocurrency market is known for its unpredictable nature, and BCH is currently experiencing a short-term price dip of 1.6% and is currently trading at 5. However, this needs to be viewed in context of a recent 30% weekly surge, highlighting the market’s inherent volatility.
The next few weeks will be crucial for BCH. If the monthly candle closes above the downtrend line, it would be a significant confirmation of bullish sentiment. However, failure to do so could lead to a pullback and dampen the current optimism.
The potential breakout for BCH underscores the dynamic nature of the cryptocurrency space. Trends can shift rapidly, and what appears certain one day can quickly change course. This is precisely what makes the industry so captivating, with innovation and progress constantly pushing boundaries.
The story of Bitcoin Cash is a testament to the relentless pursuit of progress in the crypto sphere. Whether BCH breaks out or not, its trajectory serves as a reminder of the ever-evolving nature of this exciting and unpredictable market.
With all eyes on the upcoming monthly candle close, the cryptocurrency community waits to see if Bitcoin Cash can finally turn the corner and etch its name in the crypto history books.
Featured image from Pixabay, chart from TradingView
Bitcoin’s Climbing Value Outshines Global Silver Market in Historic Pre-Halving Surge
 Bitcoin’s ascent past the ,000 mark has elevated its market capitalization beyond the combined worth of all the world’s silver. The cryptocurrency has seen a 52.7% increase in value relative to the U.S. dollar over the past month, with 41.1% of this uptick occurring within a mere two weeks. Bitcoin Retakes the 8th Largest Asset […]
Bitcoin News
Bitcoin Whale From 2015 Moves ‘Sleeping Bitcoins’ Worth $163M as Historic Wallets Wake Up
 As bitcoin remains stable above the K mark, an entity from 2015 made onchain waves by moving 2,352.62 bitcoins valued at more than 3 million. This individual executed the transfer through 80 distinct transactions, after letting the bitcoins remain untouched for more than eight years. 2015 Bitcoin Cache Comes Alive On March 10, 2024, a […]
Bitcoin News
Precious Metal Peaks — Gold Surpasses $2,140, Marking Historic Price High
 As bitcoin climbed beyond its previous 2021 peak, the value of an ounce of pure gold similarly hit a lifetime high on March 5. The globally acknowledged safe haven asset soared to ,140 per ounce on Tuesday, marking a 4.97% increase against the U.S. dollar over the preceding week. Price of Gold Climbs to Unprecedented […]
Bitcoin News