 It has been 29 days since the halving and the launch of the Runes protocol, and since May 1, Runes activity has been underwhelming, falling short of the expectations set months prior. Similarly, the trend of Ordinals inscriptions has significantly declined over the past month. Runes Protocol’s Initial Excitement Dwindles Amid Decreased Activity Before the […]
Bitcoin News
Mid-May NFT Sales Drop by 8.97%, Top 4 Chains See Reductions
 Between May 10 and May 17, non-fungible token (NFT) sales totaled 0.56 million, marking an 8.97% decline from the previous week’s figures. NFT sales have consistently decreased on a weekly basis, as four out of the top five blockchains by sales volume experienced reductions during this period. NFT Market Sees Consistent Decline In February, from […]
Bitcoin News
Bitcoin Price Signals Bearish Continuation, Why BTC Could Drop Below $60K
Bitcoin price started a fresh decline from the ,000 resistance zone. BTC is declining and remains at a risk of more losses below the ,000 level.
- Bitcoin started a fresh decline after it failed near ,000.
- The price is trading below ,000 and the 100 hourly Simple moving average.
- There was a break below a bearish flag pattern with support near ,950 on the hourly chart of the BTC/USD pair (data feed from Kraken).
- The pair could gain bearish momentum if there is a close below the ,000 level.
Bitcoin Price Signals Breakdown
Bitcoin price found support near the ,250 zone and started a recovery wave. BTC was able to recover above the 23.6% Fib retracement level of the downward move from the ,217 swing high to the ,250 low.
However, the bears were active near the ,800 resistance zone. They defended the 50% Fib retracement level of the downward move from the ,217 swing high to the ,250 low. There was a fresh bearish reaction below the ,200 support zone.
There was a break below a bearish flag pattern with support near ,950 on the hourly chart of the BTC/USD pair. Bitcoin is now trading below ,000 and the 100 hourly Simple moving average.
Immediate resistance is near the ,200 level. The first major resistance could be ,000 or the 100 hourly Simple moving average. The next key resistance could be ,500. A clear move above the ,500 resistance might send the price higher.
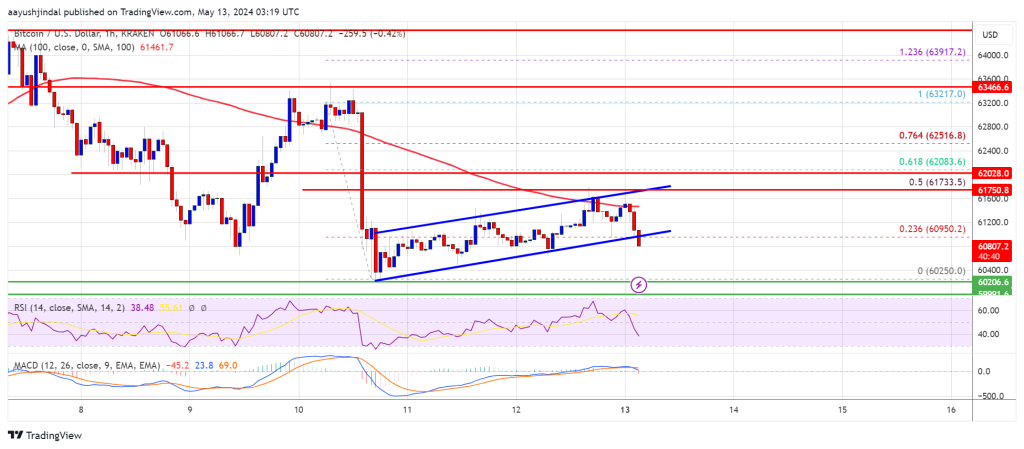
Source: BTCUSD on TradingView.com
The main resistance now sits at ,500. If there is a close above the ,500 resistance zone, the price could continue to move up. In the stated case, the price could rise toward ,000.
More Downsides In BTC?
If Bitcoin fails to climb above the ,200 resistance zone, it could continue to move down. Immediate support on the downside is near the ,500 level.
The first major support is ,000. If there is a close below ,000, the price could start to drop toward ,500. Any more losses might send the price toward the ,650 support zone in the near term.
Technical indicators:
Hourly MACD – The MACD is now gaining pace in the bearish zone.
Hourly RSI (Relative Strength Index) – The RSI for BTC/USD is now below the 50 level.
Major Support Levels – ,500, followed by ,000.
Major Resistance Levels – ,200, ,200, and ,500.
Is The Bitcoin Bottom In? Buy The Dip Sentiment Erodes Amid Drop Toward $60,000
Bitcoin has been sliding down since it reached its all-time high in March. This has largely led to a buy-the-dip sentiment among crypto traders, with many believing the correction would end as soon as it ended and Bitcoin would surge again to new all-time highs.
According to crypto analytics platform Santiment, the thrill of scooping up ‘cheap’ Bitcoin appears to be fading as the consolidation drags on around the ,000 price mark. As Santiment noted, this fading buy-the-dip mentality could actually be a signal that Bitcoin is nearing a bottom, according to price history.
Is The Bitcoin Bottom In?
Bitcoin tumbled from ,000 to ,000 on Friday, extending its run of range trading in the past few weeks. As noted by Santiment, traders are becoming less enthusiastic about buying the dip according to social media interactions.
While this might be worrying for some investors, Bitcoin’s unique price movement over the years has prompted Santiment to note this is generally a good sign that the bottom is nearing.
To explain this further, the sentiment usually turns quite negative when Bitcoin crashes from all-time highs. But historically, the point at which “buy the dip” talk on social media starts to fade is often a sign the bottom is near than most people will think.
The fading “buy the dip” talk suggests the weak and scared bears have sold and the bulls are starting to position themselves.
Traders are showing weak #buythedip interest in #Bitcoin‘s latest retrace down to as low as .2K today. Generally, the crowd’s lack of faith is a strong sign of prices being close to a #bottom. Track social interest levels to see if #FUD stays high. https://t.co/cZjTWcCnL2 pic.twitter.com/Nj19XkIdgq
— Santiment (@santimentfeed) May 10, 2024
Unfortunately, there’s no way to know for sure if prices have bottomed out until after the fact. However, key support levels on the Bitcoin chart haven’t broken down and fundamentals haven’t changed. If Bitcoin continues to hold above ,000, this could signal the bottom is in.
BTC Risk Signal Hits Lower High – Woo
At the same time, the bullish Spot Bitcoin ETF narrative driving increasing mainstream adoption is still in place, meaning the crypto could reverse into a full bullish action very soon.
Other key factors also point to Bitcoin nearing its bottom. As noted by crypto analyst Willy Woo, Bitcoin’s risk signal recently printed a lower high, which is a formation that frequently paves the way for a bullish trend.
At the time of writing, Bitcoin is trading at ,000 and is down by 4.2% in the past seven days. Although Bitcoin might have formed its bottom, this lull action could continue into the next few months until the crunching supply of the halving gets factored into its price.
Remarkably, some new whale addresses are silently accumulating Bitcoins. On-chain data from Whale Alerts shows the recent movement of 1,999 BTC into new private addresses.
Featured image from Pexels, chart from TradingView
Crypto Analyst Says Ethereum Price Will Drop To $2,500, Here’s Why
The Ethereum price has been closing mirroring the performance of Bitcoin recently and since the Bitcoin price has been on a downtrend, the ETH price has followed. However, Ethereum on its own seems to possess more bearish fundamentals compared to Bitcoin, leading crypto analysts to believe that the second-largest cryptocurrency by market cap will fall further from here.
Ethereum Poised To Crash Further
A crypto analyst known as Shin Forex took to the TradingView website to share an interesting analysis of the Ethereum price. The analysis, which focused on the ETH/BTC chart, unveiled some concerning developments in the ETH price.
The analyst explained that during this time, the liquidity in Ethereum has been dwindling. Instead of flowing toward altcoins like ETH, it is instead flowing toward Bitcoin. This suggests growing disinterest in Ethereum from investors and as liquidity flows to Bitcoin, Ethereum has nothing propping it up at this time.
Furthermore, the crypto analyst explains that the ETH/BTC pair has now broken below its support of 0.05. Now, this drop below its support level is important given what has happened each time that it broke. Shin Forex points back to the last two market cycles, one in 2016 and one in 2019, of the ETH/BTC breaking below its support.
Both times that this has happened, a crash in the price has followed, before it can rally again. The crypto analyst does not expect this time to be any different and believes that ETH/BTC will fall below 0.04. If this happens, it will send Ethereum spiraling and the analyst has set a price target of around ,500 for this.
Can ETH Price Survive The Crash?
In the short term, the Ethereum price doesn’t look to good, especially as the altcoin is currently trending downward inside its current channel, according to the crypto analyst. However, zooming out to the larger timeframe can help give an inkling of how the ETH price could perform after the crash.
Looking at Shin Forex’s chart of the last two times that a formation like this occurred, it has also set a precedent for money to flow back into Ethereum. In November 2016, the price had crashed but in a few months, there was a massive recovery as ETH/BTC rose to a new all-time high.
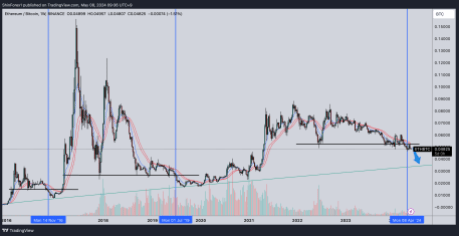
A similar thing happened the next time in 2019, with the crash coming ahead of a market rally, albeit a bit slower at this time. So, if this trend holds, then the ETH crash is inevitable. However, a recovery is expected that will likely kickstart the beginning of another massive rally.
For now, bears continue to dominate the Ethereum market and have successfully dragged the price down below ,000. It is trading at. ,975 at the time of this writing, with a small 0.36% decline in the last day, according to Coinmarketcap.
Bitcoin Price Rejects Key Resistance, Time For Another Drop In BTC?
Bitcoin price started a steady increase above the ,500 resistance. BTC is again struggling to clear the ,500 and ,000 resistance levels.
- Bitcoin is showing positive signs and facing hurdles near ,500.
- The price is trading above ,500 and the 100 hourly Simple moving average.
- There is a key bullish trend line forming with support at ,800 on the hourly chart of the BTC/USD pair (data feed from Kraken).
- The pair could struggle to clear the ,500 and ,000 resistance levels.
Bitcoin Price Faces Resistance
Bitcoin price found support near the ,500 zone and started a decent increase. There was a clear move above the ,000 and ,200 resistance levels.
The bulls pushed the price above the ,500 level and the 100 hourly Simple moving average. However, the bears are again active near the ,500 and ,000 resistance levels. A high was formed at ,646 and the price is now consolidating gains.
It is stable above the 23.6% Fib retracement level of the upward move from the ,378 swing low to the ,646 high. There is also a key bullish trend line forming with support at ,800 on the hourly chart of the BTC/USD pair.
Bitcoin is now trading above ,500 and the 100 hourly Simple moving average. Immediate resistance is near the ,500 level. The first major resistance could be ,000. The next key resistance could be ,500.
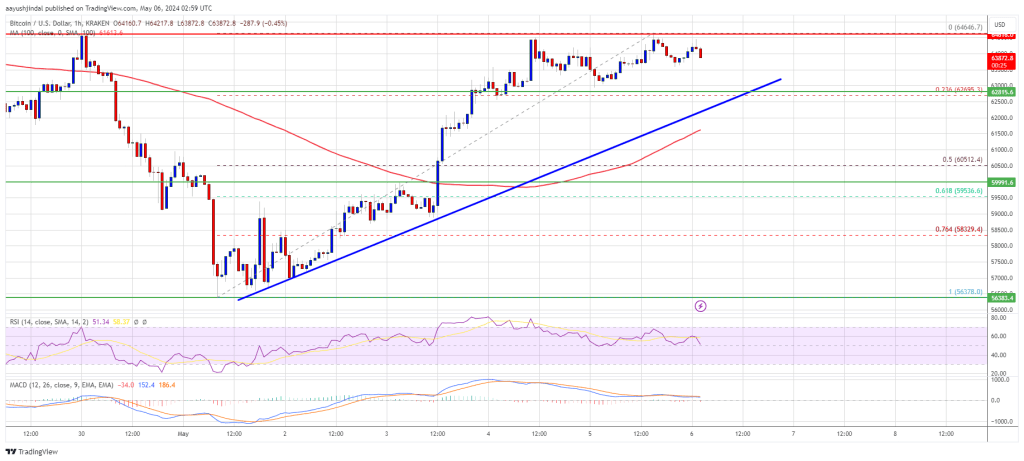
Source: BTCUSD on TradingView.com
A clear move above the ,500 resistance might send the price higher. The next resistance now sits at ,800. If there is a clear move above the ,800 resistance zone, the price could continue to move up. In the stated case, the price could rise toward ,000.
Another Decline In BTC?
If Bitcoin fails to rise above the ,500 resistance zone, it could start another decline. Immediate support on the downside is near the ,800 level and the trend line.
The first major support is ,500. If there is a close below ,500, the price could start to drop toward the 61.8% Fib retracement level of the upward move from the ,378 swing low to the ,646 high at ,500. Any more losses might send the price toward the ,000 support zone in the near term.
Technical indicators:
Hourly MACD – The MACD is now losing pace in the bullish zone.
Hourly RSI (Relative Strength Index) – The RSI for BTC/USD is now near the 50 level.
Major Support Levels – ,500, followed by ,500.
Major Resistance Levels – ,500, ,000, and ,500.
The Halving Effect: Bitcoin Hashrate Decreases as Miners Prepare for Probable Difficulty Drop
 Just over two weeks have passed since the fourth Bitcoin halving took place. During this period, the network’s hashprice dropped from over 0 per petahash to below at the beginning of May. It has since increased to per petahash. Despite the modest rebound, the network’s total hashrate has experienced a decrease, with a […]
Bitcoin News
Shiba Inu Stands Strong: Over 650K Wallet Addresses Still Profitable Amid Recent Price Drop
Shiba Inu (SHIB) has demonstrated resilience despite recent market downturns. Data reveals that roughly over 700 trillion SHIB tokens held by more than 650,000 wallet addresses remain profitable, reflecting steadfast confidence among holders in the token’s long-term value.
Shiba Inu Market Resilience Amid Volatility
Recent on-chain analytics have uncovered an interesting trend among Shiba Inu investors. Despite a general dip in SHIB’s market price, investors continue to hold a substantial volume of tokens—totaling 733 trillion—showing unrealized gains.
These holdings, maintained by approximately 653,530 individual wallets, were acquired at prices ranging from .000002 to .000022, averaging out at .000011.
This indicates not only a significant level of acquisition but also a broad base of investors who entered the market at lower valuations, positioning themselves in profit despite the coin’s fluctuating fortunes.
The “Break Even Price” indicator, a crucial tool derived from on-chain data, suggests that many SHIB holders are still in the green financially. This could point to a collective strategy among holders to weather short-term price movements, with an eye on potential long-term returns.

Such data reinforces the notion of SHIB as more than just a speculative asset, hinting at a deeper conviction among its community regarding the token’s future potential.
Long-Term Outlook And Ecosystem Developments
Despite a decline of 5.2% over the past week and 11.9% over the past month, Shiba Inu has seen a recent uptick of 3.3% in its price in the last 24 hours, trading at .00002389.
Notably, this upward trajectory in value mirrors the asset’s trading volume, which has also surged from below 0 million last week to above 0 million as of today.
This recovery aligns with significant developmental strides within the Shiba Inu ecosystem, particularly the completion of a hard fork in its Layer-2 blockchain solution, Shibarium.
The Shibarium hard fork, executed at block height 4504576, introduced enhancements aimed at improving usability and transaction efficiency. This was a response to community feedback advocating better performance and lower costs.
This upgrade is expected to boost transaction speeds and stabilize transaction fees on Shibarium, making costs more predictable for users.
Moreover, the recent hard fork’s dual focus—enhancing the Bor and Heimdall components of Shibarium—aims to refine the platform’s technical infrastructure.
1/ #Shibarium has successfully completed its hard fork at block height 4504576!
Get ready for:
•Blazing-fast transactions!
•Predictable gas fees!pic.twitter.com/oQrtF3OMTe
— Shibarium Network (@ShibariumNet) May 2, 2024

By improving the calculation of state sync confirmation and ensuring deterministic finality, the Shiba Inu team appears keen on improving the network’s reliability and scalability.
Featured image from Unsplash, Chart from TradingView
Standard Chartered Bank Analysts Sound Warning Alarm: Bitcoin Price Can Still Drop To $50,000
Leading international cross border bank, Standard Chartered has predicted steep price declines for Bitcoin, foreseeing a pessimistic future outlook for the pioneer cryptocurrency amidst broader market downturn.
Bitcoin Could Plummet To ,000
As of writing the price of Bitcoin is trading above ,000, according to CoinMarketCap. The cryptocurrency has been experiencing massive price drops after the Bitcoin halving on April 20, 2024, further exacerbated by the Federal Reserve’s (FED) decision to keep interest rates unchanged during the Federal Open Market Committee (FOMC) meeting On Wednesday, May 1.
Standard Chartered bank has cautioned investors of more price drops in the future, predicting that Bitcoin’s price could settle between ,000 and ,000, recording more than ,000 loss from it’s all time high of over ,000 in March, 2024. This new forecast follows the bank’s previous projection which anticipated Bitcoin rise to 0,000 by the end of 2024.
The head of Standard Chatered’s forex and digital assets research, Geoffery Kendrick revealed a combination of factors that could drive Bitcoin’s decline in a statement to The Block on Wednesday. Kendrick highlighted broader macroeconomic influences and crypto-specific factors impacting the price of Bitcoin, particularly challenges like the reduction of liquidity measures within the United States since mid-April.
“Liquidity matters when it matters, but with a backdrop of strong US inflation data and less likelihood of Fed rate cuts, it matters at the moment,” Kendrick stated.
Standard Chartered also cited the series of massive outflows witnessed by Spot Bitcoin ETfs in the US, as well as the lackluster performance of Ethereum Spot ETFs in Hong Kong, China.
On May 1, approximately 10 US Spot Bitcoin ETFs recorded staggering outflows, collectively totaling 3.7 million. Kendrick also disclosed that “more than half of the Spot ETF positions are underwater.” He suggests that the risk of liquidity should be considered, especially as investor sentiment may be shifting away from these digital assets.
BTC Price Jumps Over ,000 Amidst Market Downturn
At some point on May 2, Bitcoin had witnessed significant price decreases that pushed its value below ,000. However, currently the cryptocurrency has recorded more than 1.56% increase, spiking by more than ,000 in just a day.
Various analysts have predicted more plunges for the cryptocurrency, expecting Bitcoin to reach its bottom during this bearish period. Analysts like Ali Martinez and Michael van de Poppe anticipate a few more price corrections before the broader market settles, paving the way for Bitcoin to prepare for a potential bullish rebound.
Altcoins In Trouble As Seasoned Analyst Predicts 40% Drop In Prices
Altcoins have suffered more in the crypto market following the Bitcoin price crash, leaving a lot of investors in losses. This is not out of the ordinary as these altcoins are known to have a higher volatility compared to Bitcoin, hence, their price swings can be more pronounced. Given the recent decline, the expectation is that the altcoins will recover. However, one analyst does not agree with that assessment.
Altcoins Headed For 40% Crash
In an analysis posted on X (formerly Twitter), seasoned crypto analyst Benjamin Cowen shocked the crypto community with his expectations for altcoins. According to the analysis, the worst is far from over for the altcoin market, as there are still more crashes to come.
Cowen explained that this was analyzed using altcoins versus Bitcoin pairs, and it seems each one looks weak against the apex cryptocurrency. This is due to the expected rate cuts, and historical performance suggests that a decline will follow.
The crypto analyst pointed to the 2019 rate cuts and how altcoins had reacted to that development back then. Following the rate cuts, altcoins plunged against Bitcoin, with major players recording up to 40% losses during this time. “Perhaps this time is not different? This would mean ALT/BTC pairs drop another 40% from here over the next few months,” Cowen said.
Cowen expects this to place out regardless of what happens in the market in the meantime. He explains that even if the market does recover in the short term, it does not invalidate the thesis. “Short-term countertrends do not invalidate this view,” he stated.
If this repeats, then it could turn an already harsh market trend even bloodier. The altcoin market cap has already fallen below trillion as of the time of writing, but a 40% decline from here could send it as low as 0 billion.
Bitcoin Crash Drags Down Crypto Market
While the Bitcoin crash has been brutal, the impact on altcoins has been much more pronounced. Ethereum has held up nicely with less than a 4% decline during this time, but others such as Stacks (STX), Arweave (AR), Neo (NEO), and Sei (SEI) are down an average of 9% in the last 24 hours.
Meme coins were also not left out of the bloodbath, with market leader Dogecoin dropping 6% to .126 and Pepe (PEPE) plunging 7.74% to .0000063. Bonk (BONK) recorded a 5% decline to eliminate some of its gains from last week, and Shiba Inu fell 4.18%.
Amid all of this, though, there have been some market winners, with Optimism (OP) recording 12% gains. Cosmos (ATOM) followed with a 9.8% increase, and Starknet (STRK) rose 9%, making them the top gainers of the day, according to data from Coinmarketcap.