 The Depository Trust & Clearing Corporation (DTCC) has announced the successful completion of its Smart NAV pilot, leveraging Chainlink’s technology to enhance its Mutual Fund Profile Service I (MFPS I). The initiative aims to bring trusted data to blockchain ecosystems, facilitating more efficient data dissemination and consumption. Chainlink Boosts DTCC’s Smart NAV Pilot DTCC’s Smart […]
Bitcoin News
The Hidden Forces Behind Bitcoin Price: Latest Insights From On-Chain Data
Leading on-chain analyst James Check, popularly known as Checkmatey, has recently delved into the intricacies of Bitcoin’s market dynamics, offering a detailed on-chain data analysis that sheds light on the forces driving Bitcoin prices. His latest insights highlight a period he describes as “Quiet and Trending,” suggesting a robust underpinning despite significant sell-side pressures and shifts in volatility.
Bitcoin Follows The Stair-Stepping Rally-Consolidation-Rally Pattern
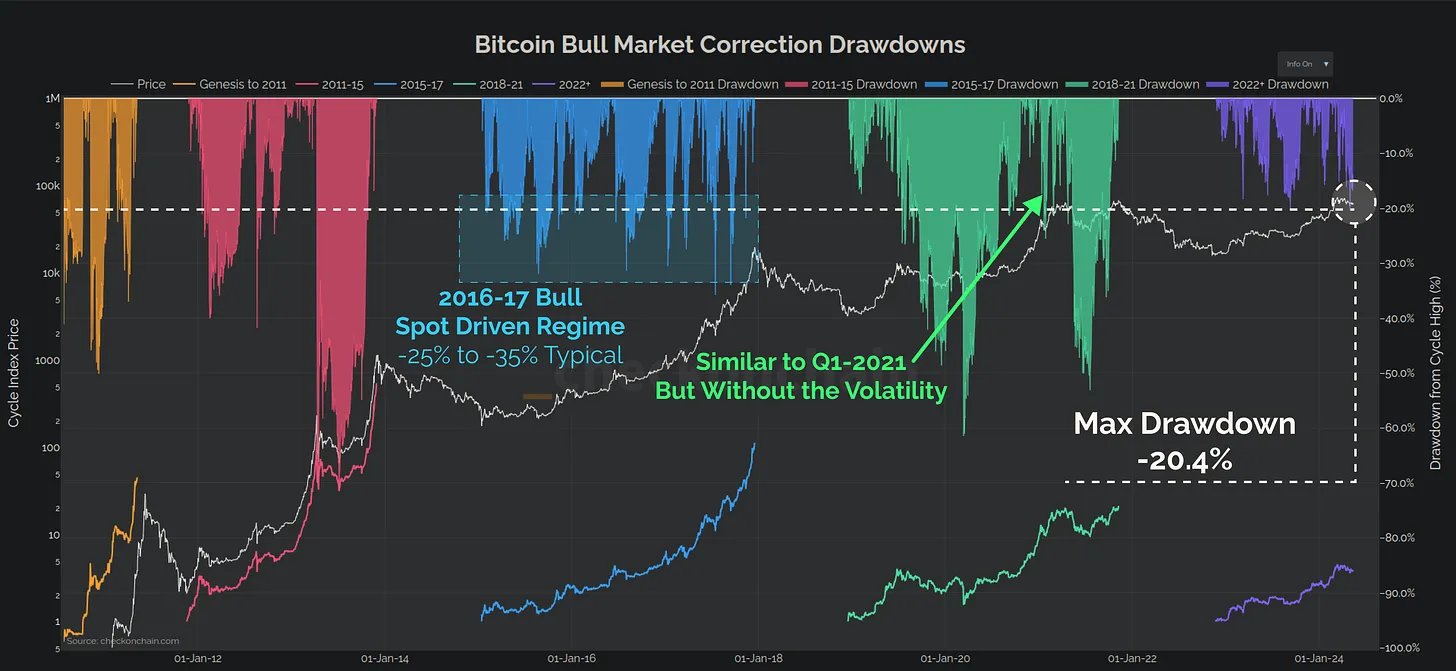
Since December, Bitcoin has experienced substantial sell-side pressure, with over 1.5 million BTC being sold. “Around 30% of this came out of GBTC, but the rest of it was good old fashioned profit taking,” Check explains.
Despite such substantial market sales, Bitcoin has demonstrated resilience with a relatively modest price correction of just -20%. This suggests that the foundational support levels for Bitcoin are stronger than what surface-level market movements might imply.
A striking aspect of Check’s analysis is the transformation in Bitcoin’s volatility profile. “The overall realized volatility profile for Bitcoin is half what it was in 2021, and 3x smaller than 2017,” states Check. This trend indicates a growing maturity within the Bitcoin market, reflecting its evolution into a more stable asset over time compared to its early years.
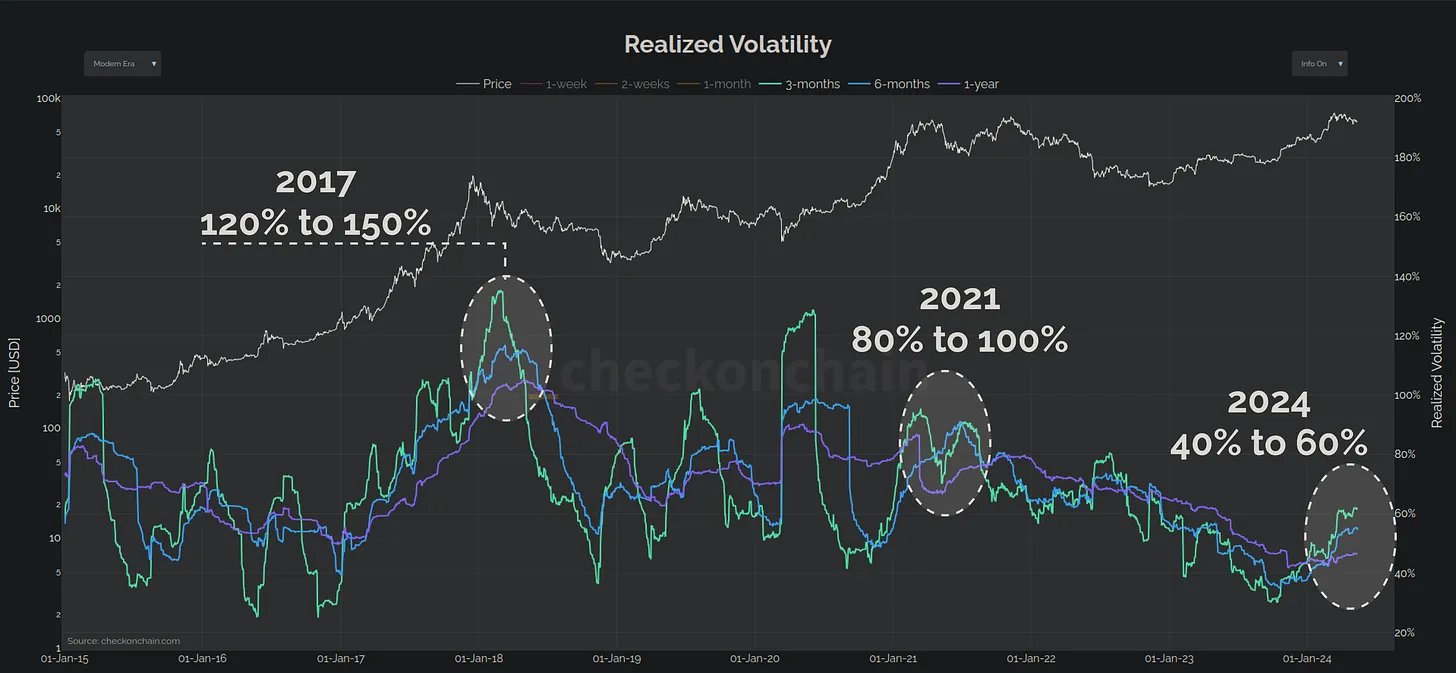
Check counters the typical narrative surrounding Bitcoin’s volatility: “What a lot of people forget however is that Bitcoin is volatile to the upside. Volatility to the upside is good!” He posits that the current increment in volatility is moderate and suggests that the market is still in the early phases of a bull run, rather than nearing its end.
A critical tool in Check’s analysis is the Short-Term Holder MVRV (STH-MVRV) Ratio, which he uses to gauge market sentiment and phases. According to Check, this ratio consistently finds support at 1.0 and resistance at 1.4 during stable uptrends. Stability is maintained as long as the ratio remains within these bounds. “Only when it breaks above this ceiling do things become unstable,” Check notes, which could signal a transition to bearish conditions.
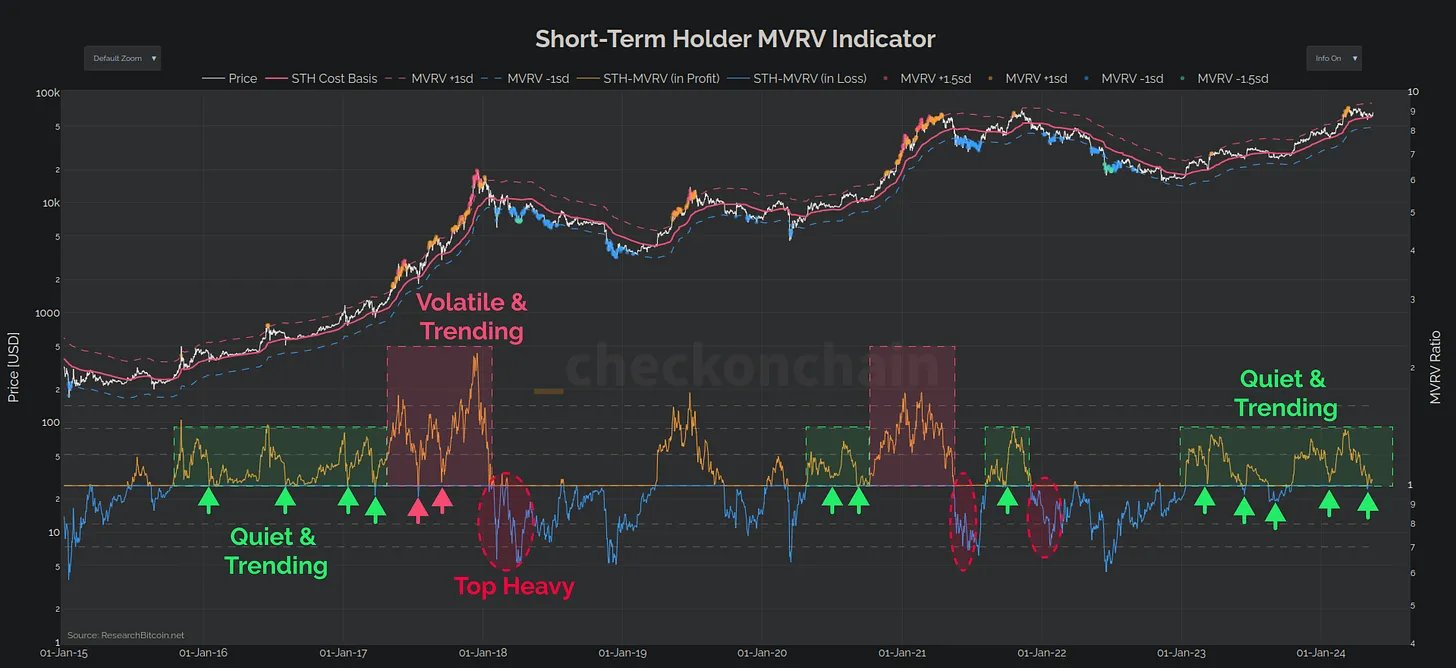
Despite the sell-off that brought Bitcoin down to k, Check observes that this has not significantly dented the profitability of short-term holders. “The magnitude of Unrealised Loss was very much in line with bull market corrections, calming fears of a top-heavy market.”
He further highlights that several of the local top buyers panic sold their Bitcoin at the lows, an action he interprets as beneficial for the correction phase, serving to stabilize the market by shaking out weak hands.
Expanding his analysis, Check refutes the criticism that Bitcoin’s volatility makes it a less viable asset. He points to a chart comparison of Bitcoin’s 30-day volatility against top-performing US stocks, showing that Bitcoin’s volatility is well within a manageable range.
Furthermore, he discusses the lower realized volatility of the SPY index, attributing it to the “out sized performance of the Magnificent-7,” which is counterbalanced by the poorer performance of the other components.
By highlighting the structural aspects of the current “Quiet and Trending” market phase, Check offers a refined perspective on how Bitcoin is navigating its maturation pathway, balancing between its speculative origins and its potential as a mainstream financial asset.
He concludes, “Overall, the Bitcoin uptrend in 2023-24 looks fairly structured, following stair-stepping rally-consolidation-rally pattern. However, as the charts above show, volatility tends to pick up during a consolidation, and that can lead to instability.”
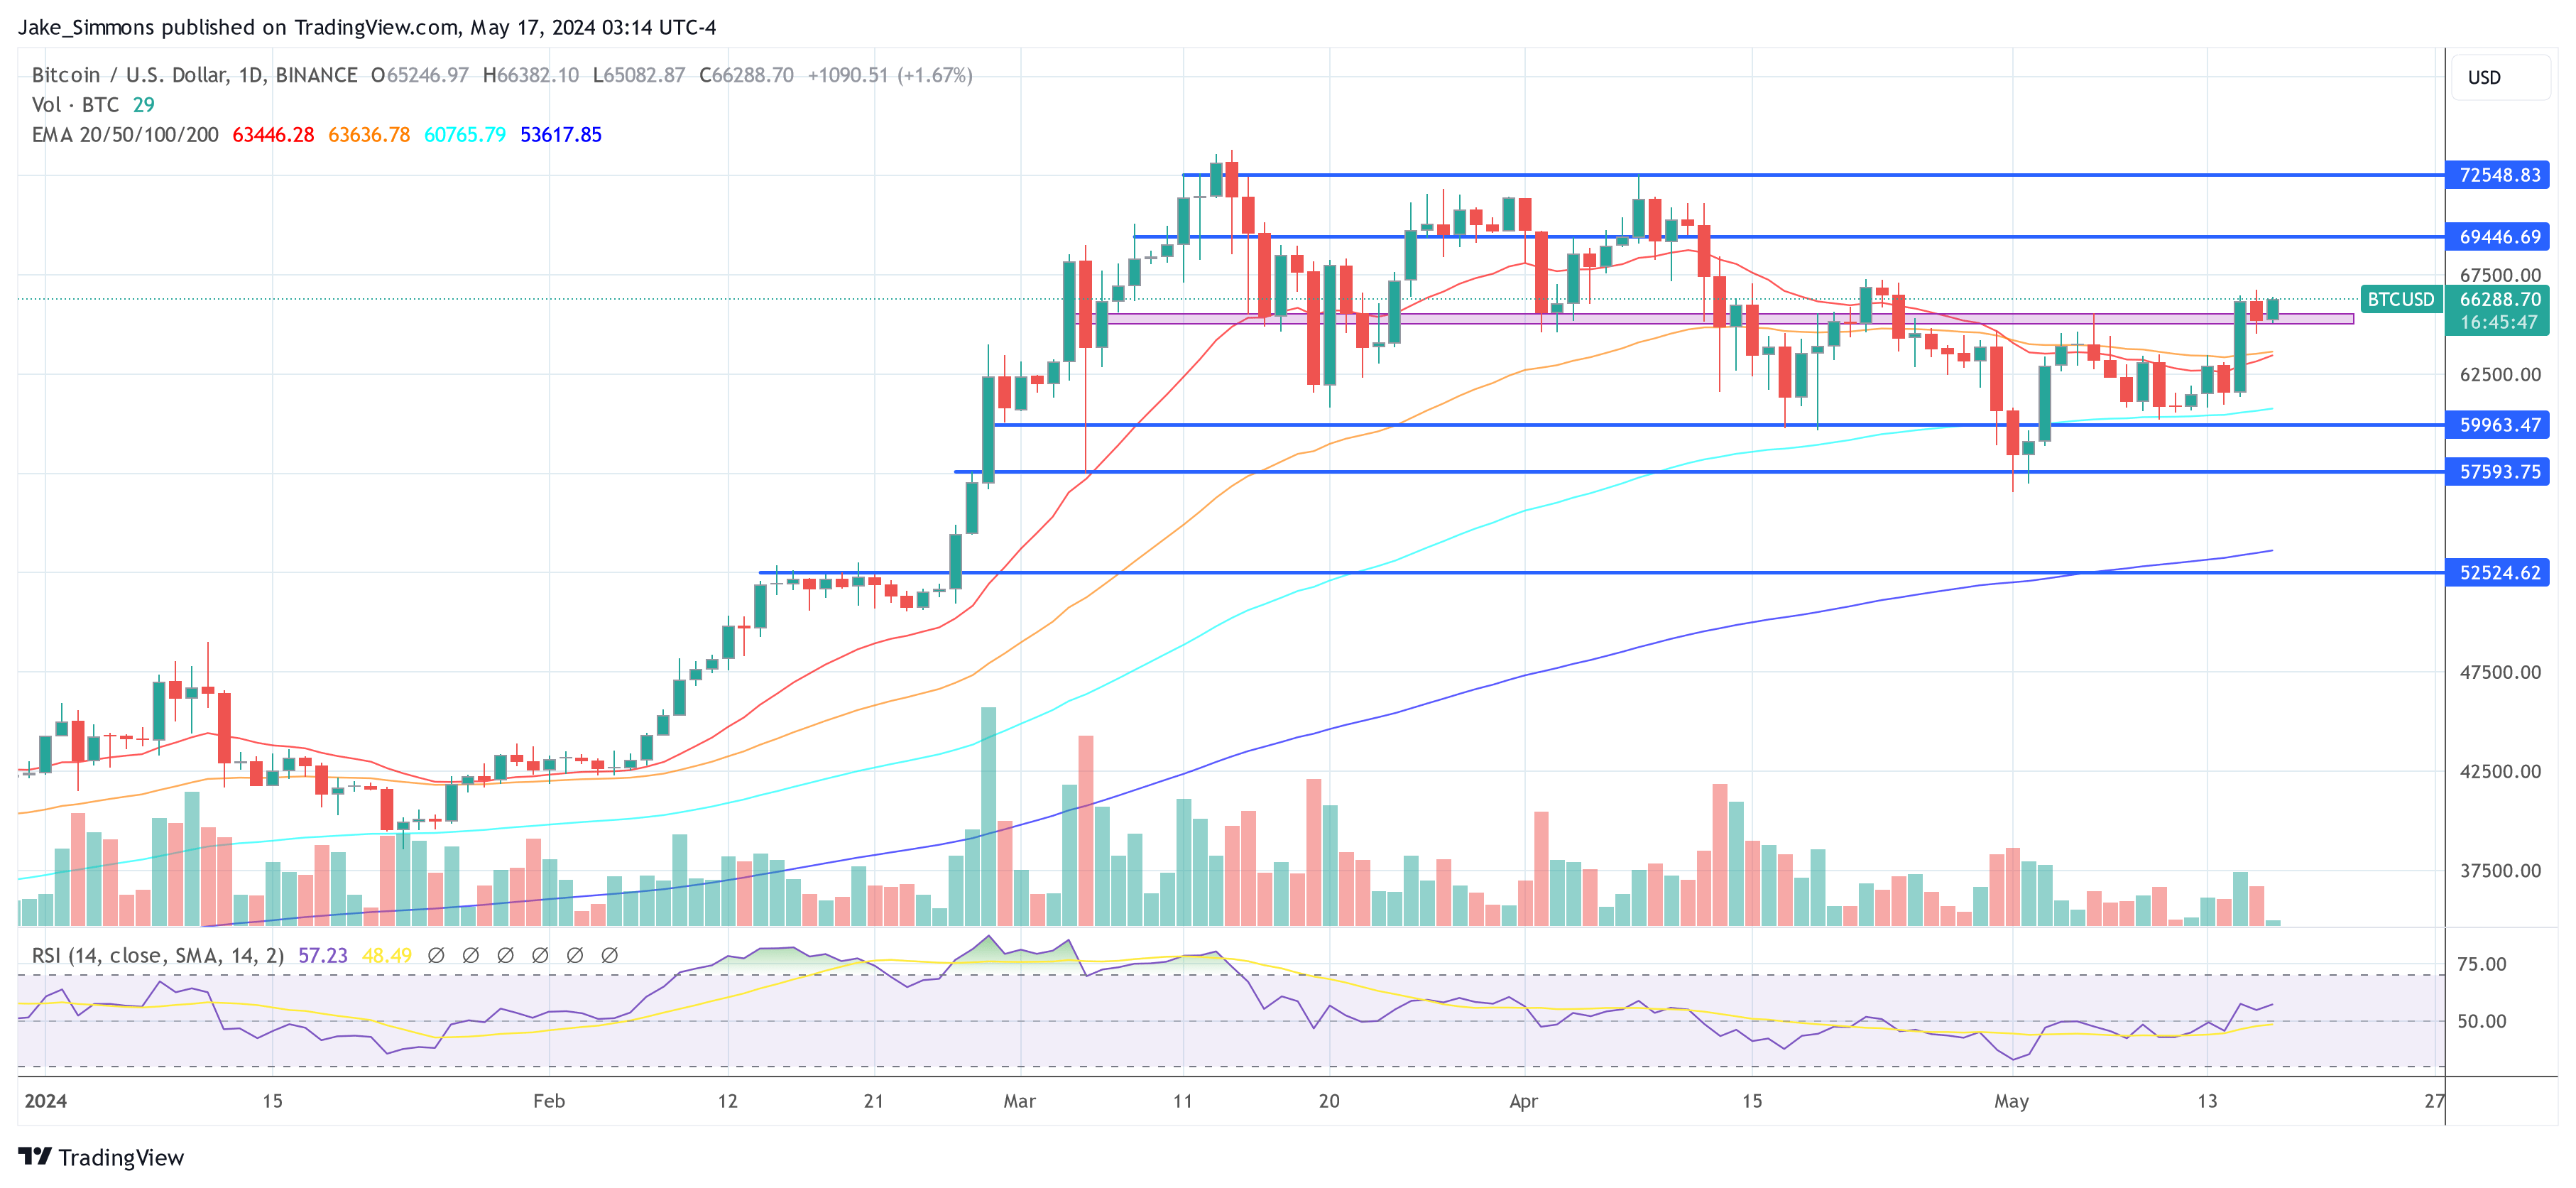
At press time, BTC traded at ,288.
US Inflation Data Indicates Slight Cooling in April; Gold, Silver, and Cryptos Climb
 The latest report from the U.S. Labor Department’s Bureau of Labor Statistics reveals that the consumer price index (CPI) for April climbed by 0.3%. Over the last 12 months, the CPI increased by 3.4%, primarily driven by higher costs for shelter and gasoline. Relief Rally in Financial Markets as April CPI Data Shows Subdued Inflation […]
Bitcoin News
Newbie Bitcoin Whales Buying 200,000 BTC Per Week, Data Shows
On-chain data suggests demand for Bitcoin remains significant as newcomer whales in the sector have been scooping up 200,000 BTC every week.
Short-Term Holder Bitcoin Whales Have Continued To Accumulate Recently
As explained by CryptoQuant author Axel Adler Jr in a post on X, the demand among the short-term holder whales has decreased since the all-time high, although it still continues to remain strong.
The “short-term holders” (STHs) refer to the Bitcoin investors who have been holding onto their coins since less than 155 days ago. This cohort includes the new investors in the market, as well as the fickle-minded traders who make moves often and don’t tend to HODL.
The investors who make it past the 155-day threshold are put inside the “long-term holders” (LTHs), which is a group that’s generally considered to reflect the resolute side of the sector.
In the context of the current discussion, the investors of interest aren’t the ordinary STHs, but rather the humongous entities called whales. Formally, these investors are defined as those holding more than 1,000 BTC in their wallets.
At the current exchange rate, this lower limit is worth .5 million, which is massive indeed. Whales can be influential beings on the network because of these large holdings, so their behavior can be something worth keeping an eye on.
The STH whales would naturally correspond to the large holders who only bought within the past five months. Here is a chart that shows the trend in the exchange outflows being made by these new whales in the Bitcoin market over the last few years:
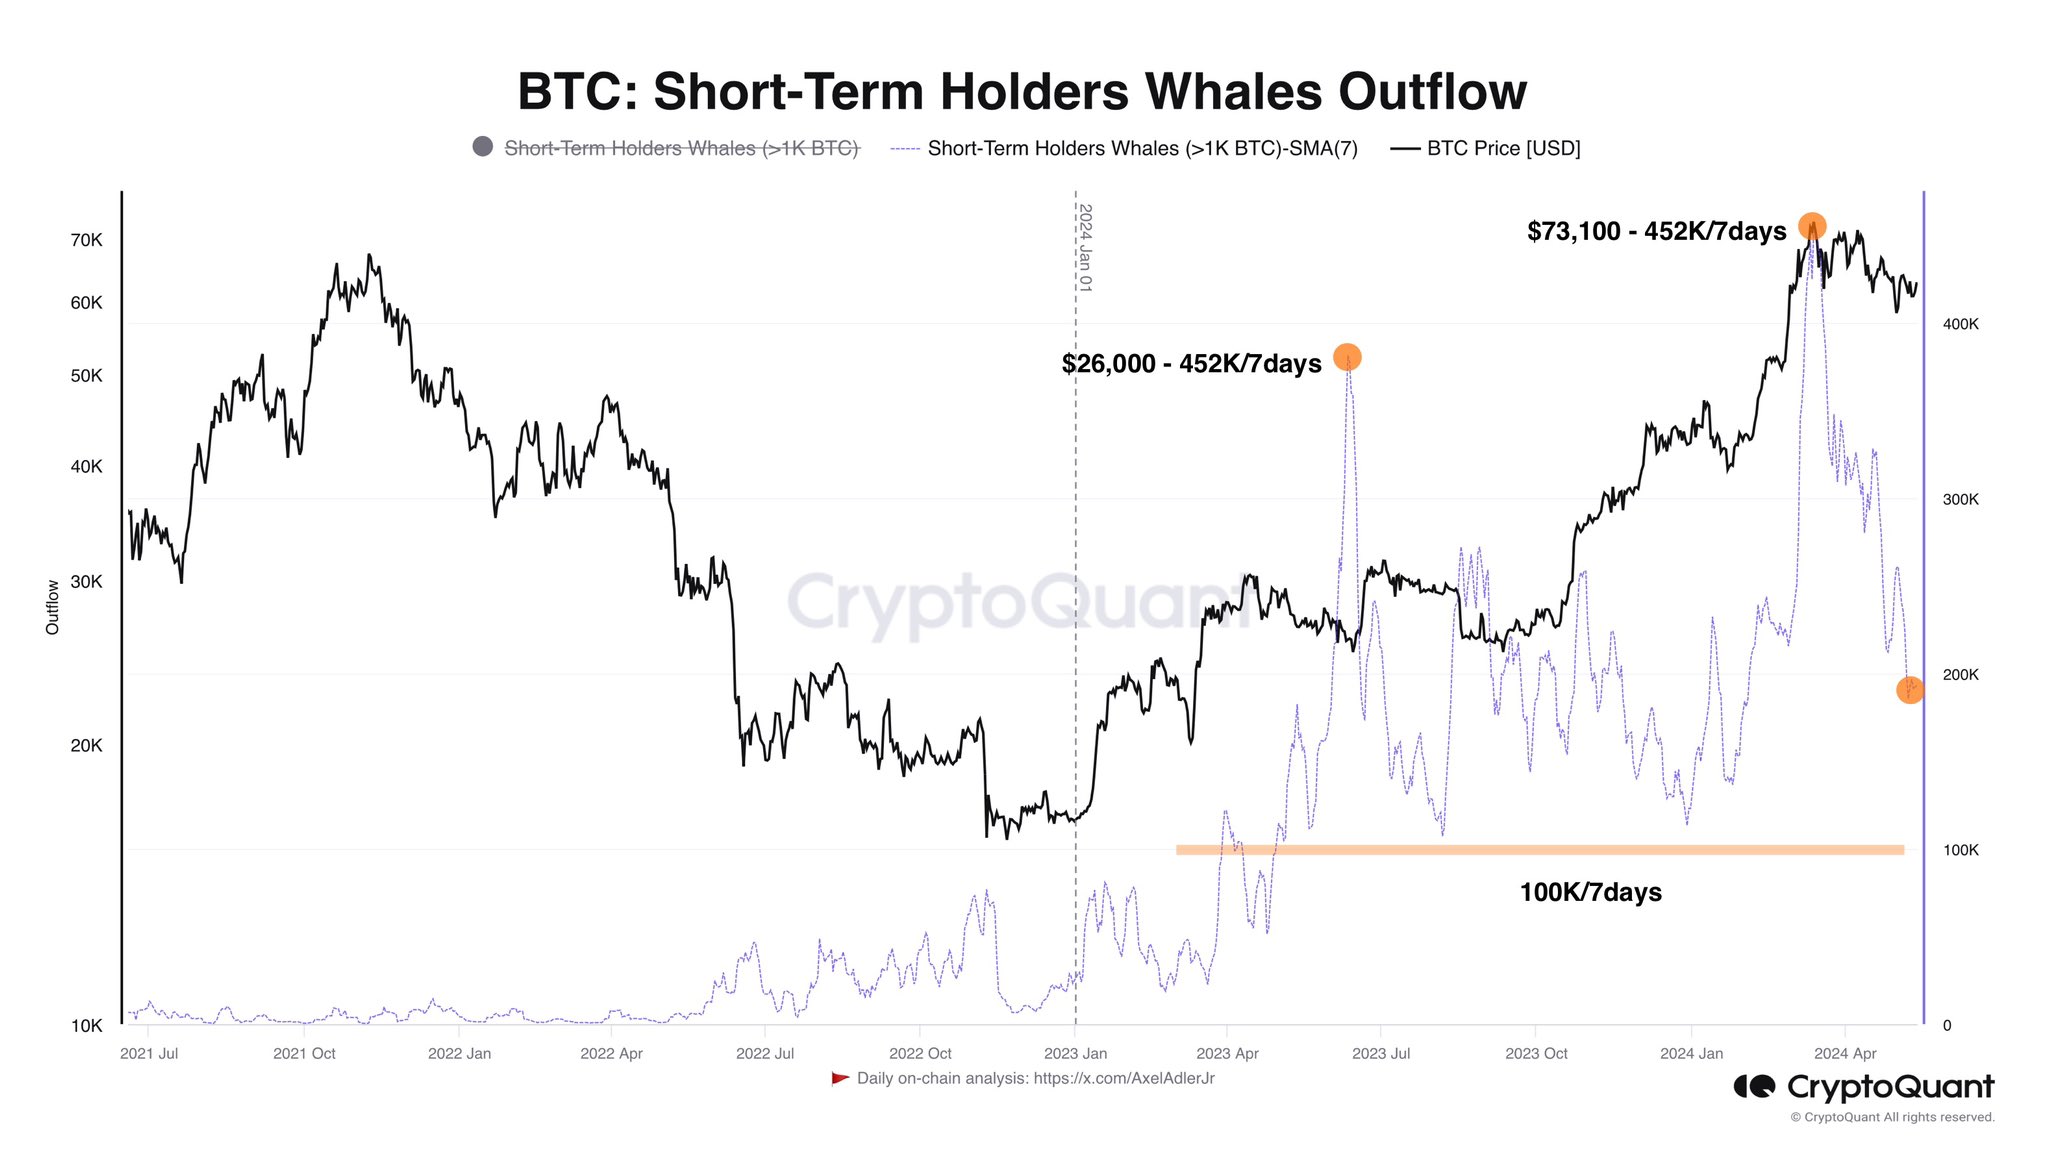
As displayed in the above graph, the 7-day simple moving average (SMA) of the Bitcoin STH whale exchange outflows had spiked to pretty high levels earlier in the year, when the rally towards the new all-time high (ATH) price had taken place.
Naturally, this spike would suggest demand for buying the cryptocurrency was high from new whale investors entering the space. At the peak, the indicator implied accumulation was occurring at the rate of a whopping 452,000 BTC per week.
A part of this buying would correspond to the demand coming in from the spot exchange-traded funds (ETFs) – new investment vehicles for Bitcoin only approved at the start of this year that provide for an indirect way to invest into the asset in a format that may be preferrable for the more traditional investors.
From the chart, it’s visible that the demand from the new whales has seen a clear decline in the period since the ATH, but accumulation nonetheless remains substantial as the STH whales are still potentially buying at a rate of around 200,000 BTC per week.
BTC Price
Bitcoin has continued to be stagnant recently as its price is trading around ,600 right now, still very much inside the range.
Study Uncovers Surprising Data: 90% Of Stablecoin Transactions Not Driven By Human Users
In a recent report by Bloomberg, it has been revealed that more than 90% of stablecoin transaction volumes do not originate from genuine users, according to a new metric co-developed by Visa.
Stablecoin Market Faces Data Reality
Visa and Allium Labs have created a dashboard designed to filter out transactions initiated by bots and large-scale traders to isolate those made by real individuals. Out of approximately .2 trillion in total transactions recorded in April, a mere 9 billion was identified as “organic payments activity” by Visa.
The data challenges the optimistic outlook of stablecoin proponents who believe these tokens can transform the 0 trillion payments industry.
Fintech giants such as PayPal Inc. and Stripe Inc. have been exploring stablecoins, with Stripe co-founder John Collison expressing bullishness on the tokens due to “technical improvements.”
Pranav Sood, the executive general manager for EMEA at payments platform Airwallex, commented on the findings: “It says that stablecoins are still in a very nascent moment in their evolution as a payment instrument.”
Sood emphasized the need to focus on increasing existing payment infrastructure in the short and mid-term while acknowledging the long-term potential of stablecoins.
Accurately tracking crypto activity’s “real” value using blockchain data has always been challenging. Glassnode, a data provider, estimates that the record trillion assigned to digital tokens at the bull market’s peak in 2021 was closer to 5 billion.
Analysts Predict Massive Surge Ahead
According to Bloomberg, the nature of stablecoin transactions often leads to double-counting, depending on the platform users employ for fund transfers. For example, converting 0 of Circle’s USDC stablecoin to PayPal’s PYUSD on the decentralized exchange (DEX) Uniswap would result in 0 of total stablecoin volume being recorded on-chain.
Visa, which processed over trillion the previous year, could suffer if stablecoins gain widespread acceptance as payment.
Interestingly, despite this troubling data, analysts at Bernstein predicted that the total value of all stablecoins in circulation could reach .8 trillion by 2028, nearly 18 times their current combined circulation.
While PayPal and Stripe have made strides in adopting stablecoins, Airwallex has observed limited demand for stablecoin-based payment solutions among its customers, primarily due to concerns about “user-friendliness.”
Sood emphasized the significant barrier of overcoming entrenched payment methods, citing the continued use of checks for 40% to 60% of business payments in the United States.
The Bloomberg report sheds light on the dominance of non-genuine user activity in stablecoin transactions. The study underscores the importance of improving existing payment infrastructure and addressing user-friendly concerns to unlock the long-term potential of stablecoins.
Featured image from Shutterstock, chart from TradingView.com
Faisal Al Monai: Convergence of AI and Blockchain Is a Solution to Data Integrity Issues in AI Model Training
 The Middle East and North Africa (MENA) lead the world in the adoption of blockchain and cryptocurrencies because governments in the region actively promote digital transformation in their strategic future visions, according to Faisal Al Monai, chairman and co-founder of Droppgroup. This commitment by governments in the region “creates a favourable environment for the growth […]
Bitcoin News
Contrary to Crypto Influencer Hype, Data Reveals ‘It is Not Altcoin Season’
 Over the past 90 days, while bitcoin has shown steady performance, 19 other cryptocurrencies have outpaced the leading digital asset in terms of price growth. However, the Altcoin Season Index, which measures the performance of these cryptocurrencies against bitcoin, has dropped from 59 to 39 since early April, signaling that an altcoin season is unlikely […]
Bitcoin News
Blackrock’s Bitcoin ETF Wallets Hold Over $20,000 in Runes Tokens, Arkham Data Shows
 Amid the excitement of Bitcoin’s new Runes protocol, Blackrock’s exchange-traded fund (ETF) wallets now contain over ,000 worth of RSIC•GENESIS•RUNE tokens. Blackrock’s IBIT Benefits From Airdropped Runes Tokens On Thursday, Arkham, an onchain intelligence firm, revealed on social media platform X that two of Blackrock‘s IBIT bitcoin addresses possess tokens based on the Runes protocol. […]
Bitcoin News
Ethereum To See Fresh Move Soon? What Futures Data Says
Data shows the Ethereum Open Interest has been trading at relatively low levels recently. Here’s what this could mean for the asset’s price.
Ethereum Open Interest Has Been Moving Sideways Since Its Plunge
As explained by an analyst in a CryptoQuant Quicktake post, the ETH Open Interest has followed a similar trajectory as the price of the cryptocurrency recently. The “Open Interest” here refers to the total number of derivative-related contracts open for Ethereum on all exchanges.
When the value of this metric goes up, it means that investors are currently opening up new positions on these platforms. Generally, this kind of trend leads to an increase in the market’s total leverage, so the asset price could become more volatile.
On the other hand, a decline in the indicator implies the investors are either closing up their positions of their own volition or getting forcibly liquidated by their platform. Such a drawdown may accompany violent price action, but once the drop is over, the market could become more stable due to the reduced leverage.
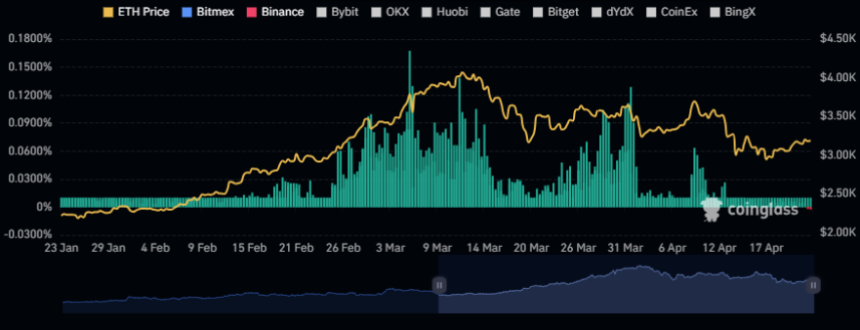
Now, here is a chart that shows the trend in the Ethereum Open Interest over the last few months:

As displayed in the above graph, the Ethereum Open Interest registered a sharp drop earlier alongside the asset’s price. The plunge in the metric was naturally caused by the long contract holders being washed out in the price drawdown.
As the price has mostly consolidated sideways since the decline, so has the value of the Open Interest. The quant notes,
This alignment suggests a cooling down of activity within the futures market. Consequently, the market appears poised for the resurgence of either long or short positions, potentially initiating a fresh and decisive market movement in either direction.
Another indicator related to the derivative market that could be relevant for Ethereum’s future price action is the funding rate. This metric tracks the periodic fees that derivative contract holders are currently paying each other.
Positive funding rates imply that the long holders are paying the shorts a premium to hold onto their positions; hence, that bullish sentiment is dominant. Similarly, negative values suggest that a bearish sentiment is shared by the majority of the derivative traders.
The chart below shows that the Ethereum funding rate has recently turned red.
Historically, the market has been more likely to move against the opinion of the majority, so the fact that the funding rate has flipped negative may be a good sign for the chances of any potential uptrends to start.
ETH Price
Ethereum has gradually increased over the last few days, as its price has now reached ,200.
Data Ownership Protocol (DOP) Partners With Bitcoin.com to Pioneer Data Sovereignty in Crypto
 Integration Promises Enhanced Privacy for Bitcoin.com Wallet Users Bitcoin.com, a leading platform for cryptocurrency users, announces its strategic partnership with the Data Ownership Protocol (DOP) to empower users with unprecedented control over their data within the Bitcoin.com ecosystem and beyond. This collaboration marks a significant milestone in the quest for data sovereignty in the crypto […]
Bitcoin News