 Robert Kiyosaki warns of an impending severe market crash and advises investing in assets like bitcoin, gold, and silver. Edward Snowden has issued a stern warning to Bitcoin developers, urging them to enhance privacy features at the protocol level. In Kenya, President William Ruto has enlisted Marathon Digital, a U.S.-based Bitcoin mining firm, to consult […]
Bitcoin News
Bitcoin Could Crash Below $55,000, Top Analyst Sounds The Alarm
Bitcoin, the leading cryptocurrency, has recently been scrutinized by several analysts and traders as it struggles to maintain its market position.
Michaël van de Poppe, a recognized figure in the crypto analysis sector, has recently expressed his concerns regarding Bitcoin’s current price trajectory.
Bitcoin Risks Dropping to ,000, Why?
Taking to Elon Musk’s social media platform X, Van de Poppe pointed out that Bitcoin is at the lower end of its current range, a crucial area for maintaining upward momentum.
Van de Poppe warned that if Bitcoin fails to hold this level, the market could see a downturn, with prices potentially falling as low as ,000 to ,000.
This prediction comes as Bitcoin attempts to stabilize above the ,000 mark. Despite efforts to sustain this level, recent market behavior suggests a bearish trend could be looming.
Van de Poppe’s analysis indicates that failing to maintain the lower range could lead to significant corrections, affecting investor sentiment and market dynamics.
#Bitcoin is at the range low. This is technically the area where you’d prefer to see it hold, so the upward momentum continues, and the range holds.
If this doesn’t hold, then we might expect -55K as a potential low on this correction. pic.twitter.com/j4rWI0Ti7G
— Michaël van de Poppe (@CryptoMichNL) May 9, 2024
Meanwhile, recent data from the analytics firm IntoTheBlock reveals a noticeable decline in BTC whale accumulation volumes over the past month. These large investors, holding over 1,000 BTC, have been a stabilizing force in the market, particularly during price dips.
However, the trend of diminishing whale purchases, especially during recent market corrections, suggests a decrease in their market influence and potentially a broader loss of appetite for Bitcoin at current levels.
This pattern could indicate a shift in whale strategy or a broader market sentiment change, possibly leading to less support for Bitcoin prices during downturns.
BTC Surging Demand vs. Limited Supply
Despite the potential price dip, other market activities suggest a robust demand for Bitcoin. Samson Mow, a well-known Bitcoin community figure and former Blockstream CSO, highlighted the continuous buying from American spot Bitcoin ETFs.
According to Mow, these US ETFs purchase 1,626 BTC daily. Additionally, MicroStrategy acquires 199 BTC daily, and Tether buys 70 BTC daily.
This significant daily demand, especially in the context of the reduced supply following the latest Bitcoin halving in April, where only 450 BTC are created each day, suggests that demand might significantly exceed supply.
Mow emphasized this imbalance, indicating that the aggregate demand could be outstripping the available supply by 5 to 10 times, hinting at a potential upward pressure on prices if this demand persists.
U.S. ETFs are buying 1,626 BTC per day.@MicroStrategy is buying 199 BTC per day.@Tether_to is buying 70 BTC per day.
There are only 450 #Bitcoin mined per day. Total aggregate demand is likely 5-10x supply.
Plan accordingly.
pic.twitter.com/fshInf0Jas
— Samson Mow (@Excellion) May 8, 2024
Featured image from Unsplash, Chart from TradingView
Bitcoin Whales Lose Interest, Is This A Precursor For A Crash To $50,000?
Movement and accumulation from crypto whales are two of the catalysts for Bitcoin price increases. Although major whales are still buying the dip, on-chain data indicates a general waning accumulation momentum which suggests their conviction might actually be waning.
According to IntoTheBlock, an on-chain analytics firm, Bitcoin whale accumulation volumes have declined substantially in each buying cycle over the past month. This decline in whale accumulation could be worrying for investors, especially as the price of Bitcoin is now trying to hold above ,000.
Whale Appetite For Bitcoin Dips According To On-Chain Data
Whales, or large investors holding over 1,000 BTC, have accumulated strongly since the beginning of the year, especially during market dips. This accumulation has largely helped to keep Bitcoin in bullish sentiment and prevented huge price declines. However, IntoTheBlock recently revealed an interesting pattern between these whale wallets in each accumulation phase.
The largest accumulation occurred between March 5 and March 7, when these wallets acquired over 120,000 BTC. Every succeeding price dip has, however, seen less accumulation than the one before it. Particularly, Bitcoin’s recent dip to ,000 failed to attract notable whale accumulation. This drop in buying and selling activity indicates whales may have lost some interest or appetite for accumulating more Bitcoin in the short term.
Whales are buying the dip, but is their conviction dwindling?
Addresses holding over 1000 BTC have accumulated strongly in recent months, especially during dips.
Prices have increased shortly following every accumulation.
However, note that each spike in accumulation by… pic.twitter.com/OkbekJr5NC
— IntoTheBlock (@intotheblock) May 6, 2024
Precursor For A Crash To ,000?
The waning conviction among Bitcoin whales has raised the question of whether Bitcoin could reverse back into a full bearish momentum. These concerns are particularly valid, considering some analysts are of the notion that Bitcoin might’ve reached its peak in this cycle.
As IntoTheBlock noted, prices have increased shortly following every accumulation this year. While the lower whale buying activity could stall price increases in the short term, it is not a sure sign that Bitcoin is headed for a major price crash. However, if the trend continues for several more months, it could signal lower demand and a weakening bull market.
According to the “In/Out Of Money Metric”, there is still a strong resistance volume between ,000 and ,000. A drop below this range again would push 552,220 addresses into losses. In fact, while a drop to his level would be painful for many holders, most crypto analysts remain optimistic about Bitcoin’s long-term prospects.
At the time of writing, Bitcoin is trading at ,488. The crypto recently rebounded around ,500 and is up by 7.4% in the past seven days. According to analyst Marco Johanning, ,000 is an important support level for Bitcoin. He noted that while a break below ,000 could lead to further declines into ,000, the crypto market is still very bullish for Bitcoin.
Robert Kiyosaki Shares Crash Survival Rules — Warns ‘Crash Has Begun, It Will Be a Bad One’
 Rich Dad Poor Dad author Robert Kiyosaki has cautioned that a crash has begun, highlighting its severity. The famous author also shared his crash survival rules. He urged investors to invest in bitcoin, alongside gold and silver, emphasizing that they are “real money that goes up in value, especially in a market crash.” Robert Kiyosaki’s […]
Bitcoin News
Shiba Inu In Danger Zone: 15% Price Crash Incoming?
The price of Shiba Inu (SHIB), the self-proclaimed “Dogecoin killer,” has been caught in a technical tug-of-war, with bears attempting to push it lower and bulls clinging to signs of hope. Analysts are scrutinizing the memecoin’s chart pattern and on-chain data to decipher its next move.
Descending Triangle Looms: Will SHIB Fall Or Fly?
A descending triangle formation has emerged on SHIB’s 3-day chart. This pattern typically indicates a potential price decline, as the asset’s price gets squeezed between converging support and resistance lines. The big question for SHIB holders: will the price break below support and continue its descent, or will it defy gravity and break out of the triangle, sparking an uptrend?
Falling Demand Raises Concerns For Shiba Inu
Adding fuel to the bearish fire, SHIB has witnessed a significant drop in demand. Data from Santiment reveals a worrying trend: the daily active addresses for SHIB have plummeted by more than 50% over the past month. This suggests a shrinking user base and potentially lower trading volume, which can put downward pressure on the price.
New Investors Give SHIB The Cold Shoulder
Further dampening spirits is the sharp decline in new addresses joining the SHIB party. According to on-chain data, the number of new addresses created daily to trade SHIB has nosedived by 51% in the same period. This lack of fresh blood entering the market could exacerbate the selling pressure.
SHIB’s High Valuation: A Recipe For Sell-Off?
Another factor causing concern is SHIB’s Market Value to Realized Value (MVRV) ratio. This metric compares the current market price with the average acquisition price of all SHIB tokens. Currently, SHIB’s MVRV ratio sits at a lofty 38%. When this ratio is high, it suggests the asset might be overvalued, potentially triggering existing holders to cash in on their profits and contribute to a sell-off.
A Silver Lining?
Despite the prevailing bearish sentiment, a glimmer of hope flickers for SHIB. The coin’s weighted sentiment has surprisingly turned positive recently, indicating a shift in market perception. This newfound optimism could translate into a price breakout, defying the descending triangle’s bearish implications.
Related Reading: Bitcoin Update: 0 Million Futures Liquidated As Price Takes A Beating
Can Bullish Sentiment Propel SHIB To Higher Ground?
If the positive sentiment persists, analysts predict a potential price surge for SHIB, reaching .00003. This would be a welcome change for investors who have witnessed a recent price slump.
Meanwhile, SHIB’s Fibonacci retracement level shows that the memecoin’s price may drop further 15% to trade at a low of .000018 if the bears continue to put pressure on it and it falls below support.
SHIB investors now have more cause for concern as this underscores the possible repercussions of a bearish breakthrough.
Featured image from Pexels, chart from TradingView
XRP Forms On-Chain Signal That Led To 16% Crash Last Time
On-chain data shows that many old coins have moved on the XRP network recently, a sign that proved to be bearish for the coin last time.
XRP Age Consumed Metric Has Registered A Large Spike
According to data from the on-chain analytics firm Santiment, XRP has just observed a large movement of dormant coins similar to what the asset witnessed last month.
The indicator of interest here is the “Age Consumed,” which shows “the amount of tokens changing addresses on a certain date, multiplied by the time since they last moved,” as per Santiment’s definition.
When this metric has a high value, it means that a large number of coins previously dormant have finally been moved to the blockchain. Old coins are generally less likely to become involved in selling, as they belong to the more resolute hands in the market. As such, any large movements of these coins can be worth noting since it’s not an event that happens too often.
The below chart shows the trend in this indicator for XRP over the past month or so:
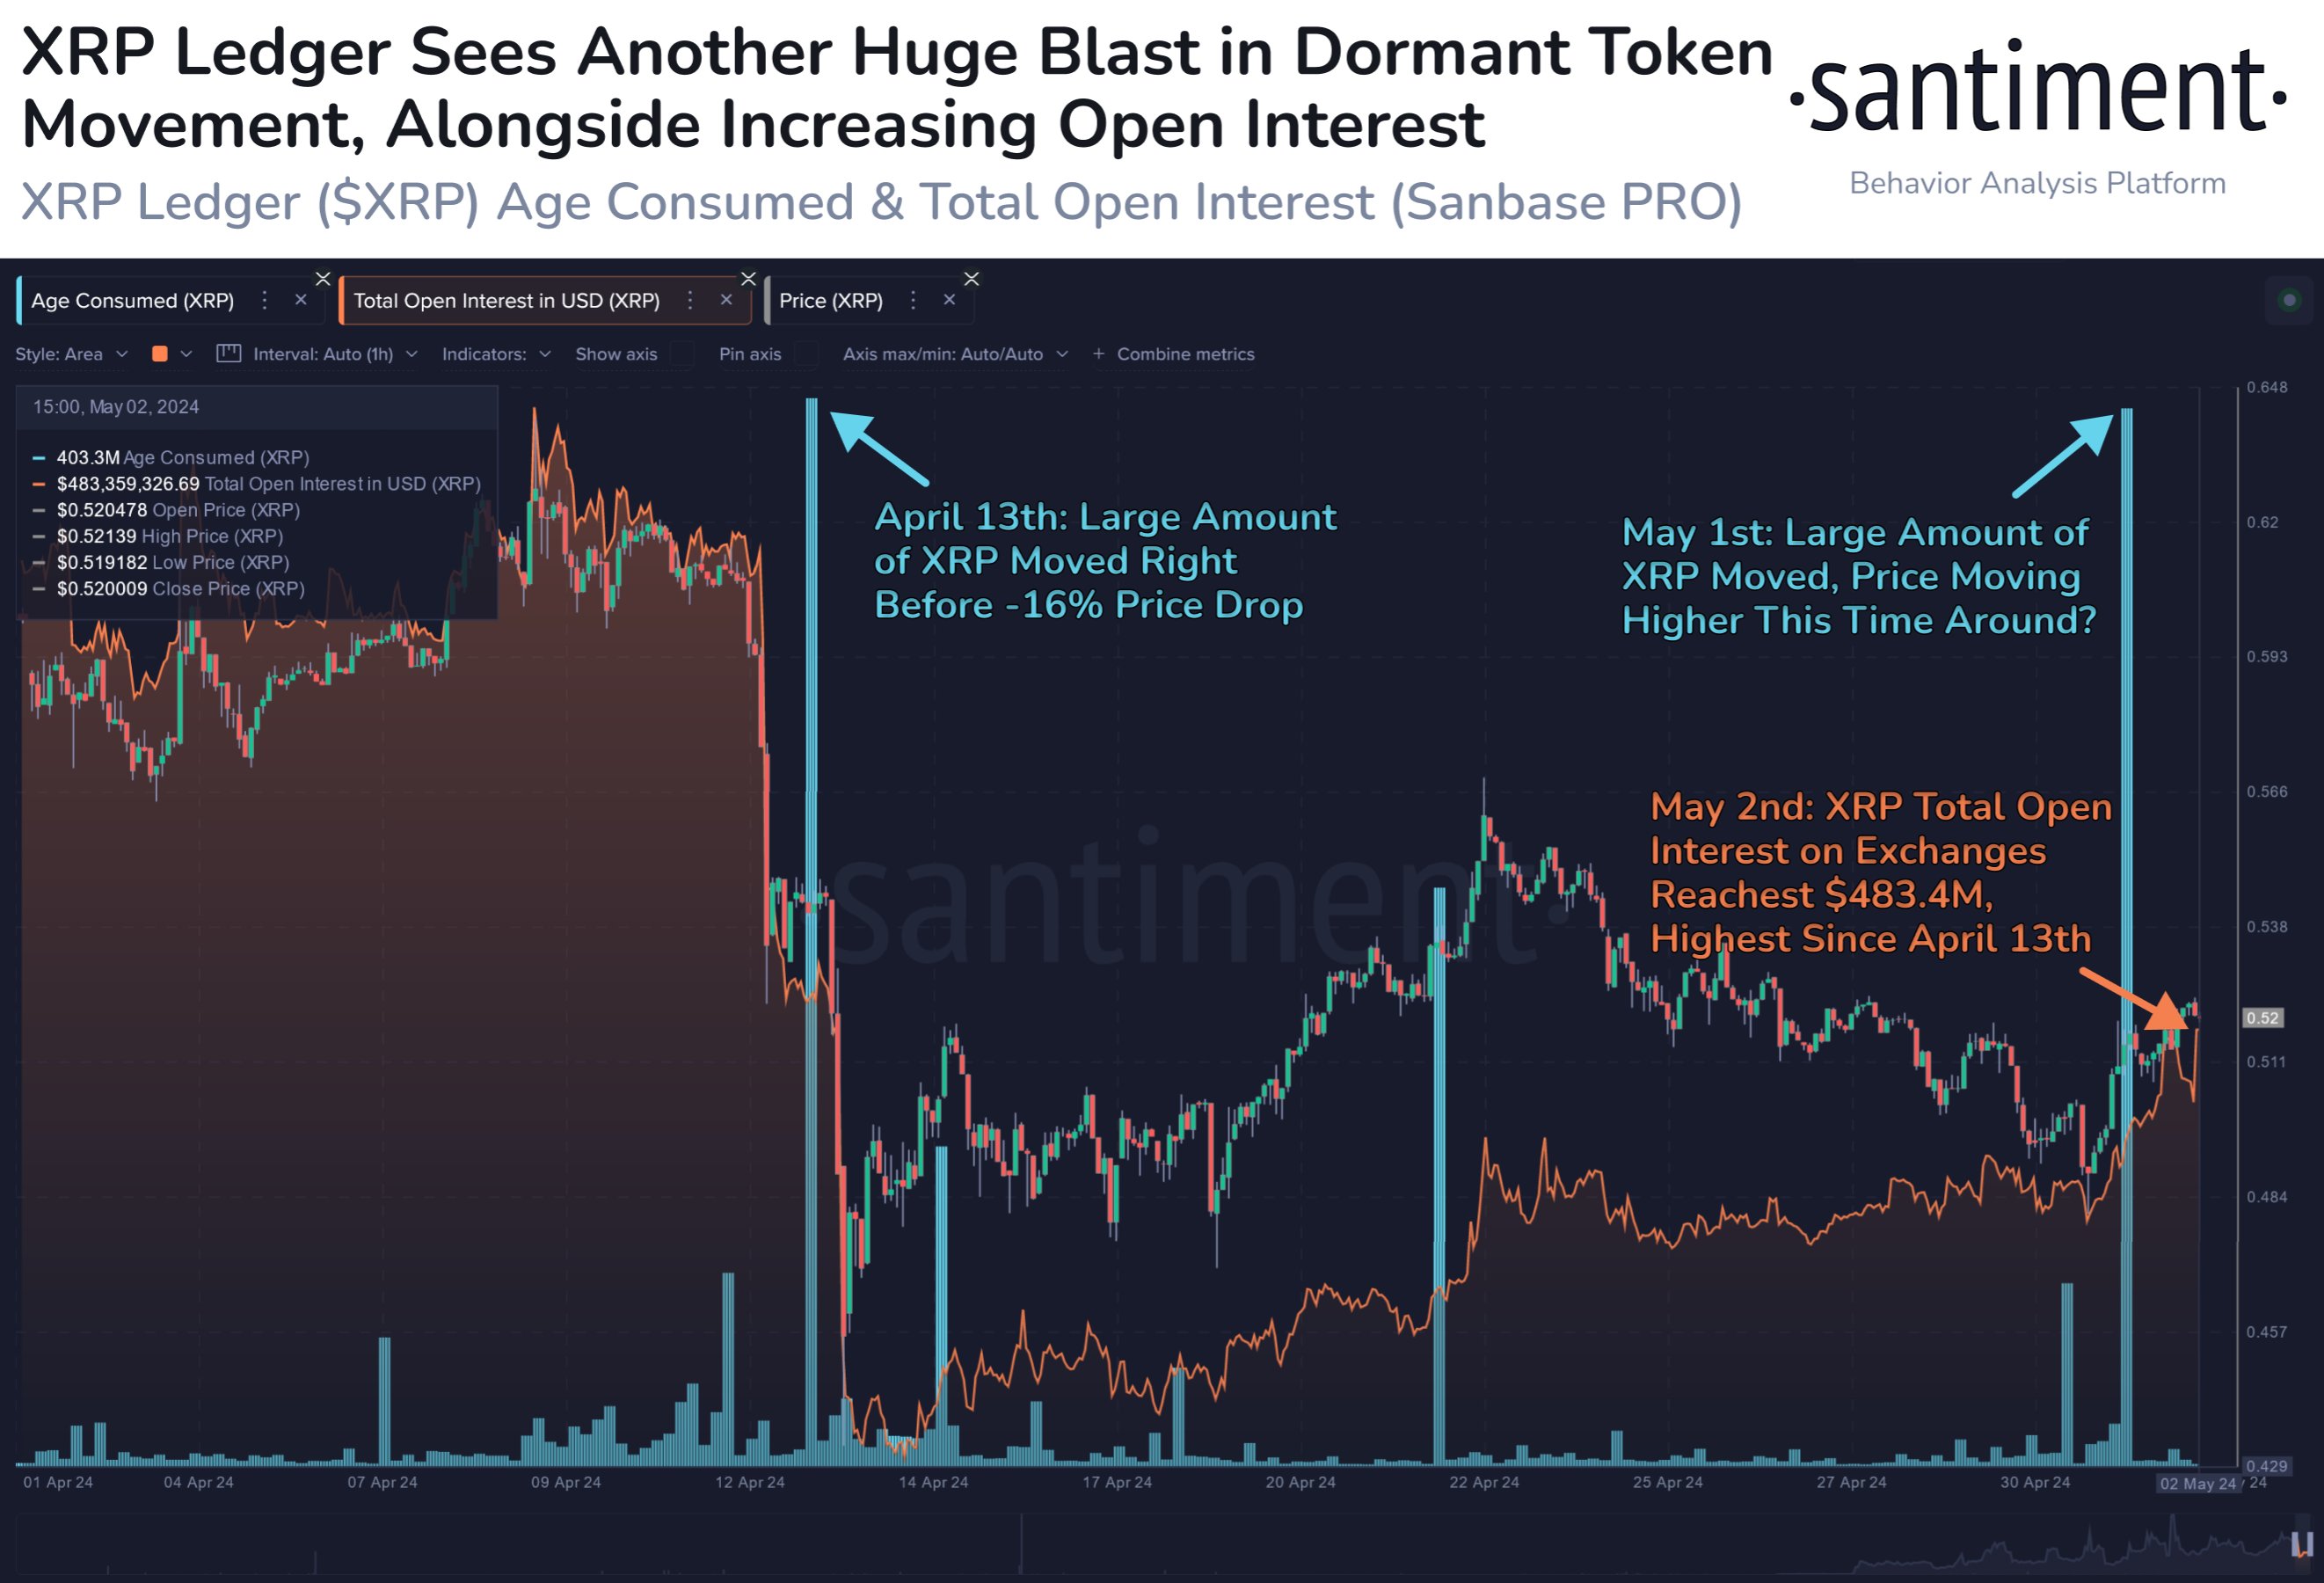
From the graph, it’s visible that the XRP Age Consumed registered a sharp spike at the start of this month, implying that some old hands have decided to break their silence.
This latest spike has been quite massive in scale and has been reminiscent of another spike that was seen last month. Interestingly, this previous spike occurred shortly before the price of the cryptocurrency tanked 16%.
Thus, the previous spike would have corresponded to some HODLers moving to sell their coins. It’s possible that the latest large dormant coin movement was also made for a similar purpose, and hence, it can prove to be bearish for XRP.
Santiment points out that this may not be so after all, though, saying:
There is an argument that this old coin movement is related to potential #buythedip interest from key stakeholders, and prices have been climbing mildly since this May spike occurred.
While this dormant coin movement may turn out to be bullish this time around, there is another signal brewing for the asset that can also be something to keep an eye on.
As highlighted in the same chart, the Total Open Interest for XRP, which keeps track of the number of derivative positions currently open on all exchanges related to the asset, has been going up recently.
This metric is now at a 3-week high of 3.4 million, implying that there is a notable amount of speculation in the market right now. Historically, this has led to volatility in the price.
In theory, this volatility can take the asset in either direction, but it’s worth noting that the crash last month occurred after the Open Interest hit extreme levels. So far, though, the indicator hasn’t quite yet reached the same highs.
XRP Price
XRP is yet to make any significant recovery from the crash last month as its price is still trading around .52.
Crypto Analyst Says Bitcoin Must Hold Above $51,800 As ETF Outflows Trigger Crash
The Bitcoin price continues to trend below ,000 as a 20% decline triggered a brutal market-wide crash. This has exposed multiple critical support points for the cryptocurrency, some of which the price has already fallen below. In light of this, a crypto analyst known as Norok has revealed the level the BTC price must not fall below to maintain its bullish trend.
Bitcoin Price Must Hold Above ,800
In an analysis posted on the TradingView website, crypto analyst Norok revealed that ,800 is now the most important support level for Bitcoin. Norok pointed out that Bitcoin has since returned to its last support level which was last seen in December 2023, making this a crucial support.
In the meantime, the support that had been built up by bulls at the ,000 level has since been broken by bears and has now been turned into resistance. Nevertheless, the crypto analyst does not believe that the Bitcoin price has turned bearish, despite the crash that has rocked the crypto market.
For Norok to turn bearish, he stated that the BTC price would have to break down below support at ,800. According to him, such a move will invalidate whatever bullish thesis is in play for Bitcoin, ending the bullish trend of 2023-2024.
In the short term, Norok identifies ,900 as a level that bulls must hold. He explains that this could help to reinforce the current bullish trend. “Price must hold here at this Support and then it can recapture the cloud to resume to Bullish Trend,” the crypto analyst said. “This is a highly decisive moment in Price action today.”
BTC Suffers As A Result Of ETF Outflows
One major driver of the Bitcoin price decline in the last few weeks has been a turn from inflows to outflows in Spot Bitcoin ETFs. Since these ETFs require the issuers to hold BTC to support the assets they are selling to investors, inflows are incredibly bullish as these issuers have taken to buying BTC to fulfill this requirement.
However, with investors beginning to withdraw their funds, the reverse has been the case, leading to a high selling pressure in the market. Spot Bitcoin ETFs have now recorded six consecutive trading days of outflows, reaching an all-time high outflow record 3.7 million on Wednesday, according to data from Coinglass.
If these outflows continue, then the BTC price could continue to decline, and at the current rate, the pioneer cryptocurrency might be testing Norok’s ,800 soon enough. However, a turn toward inflows would mean issuers have to buy BTC and this can translate to a price recover.
Alarm Bells Ring For Dogecoin: Bearish Signal Points To 40% Crash
Crypto analyst Josh Olszewicz is once again warning of a looming Dogecoin price crash. The analysis hinges on the Ichimoku Cloud, a comprehensive indicator that provides information on support/resistance levels, momentum, and trend direction. Olszewicz’s analysis points to two specific technical phenomena on the 1-day (1D) chart of DOGE against the US dollar (DOGE/USD). Via X, he remarked “1D DOGE: bearish TK cross + bearish Kumo breakout.
Bearish Signals For Dogecoin
The bearish TK cross refers to the bearish crossover between the Tenkan-Sen (conversion line) and the Kijun-Sen (baseline) within the Ichimoku Cloud system.
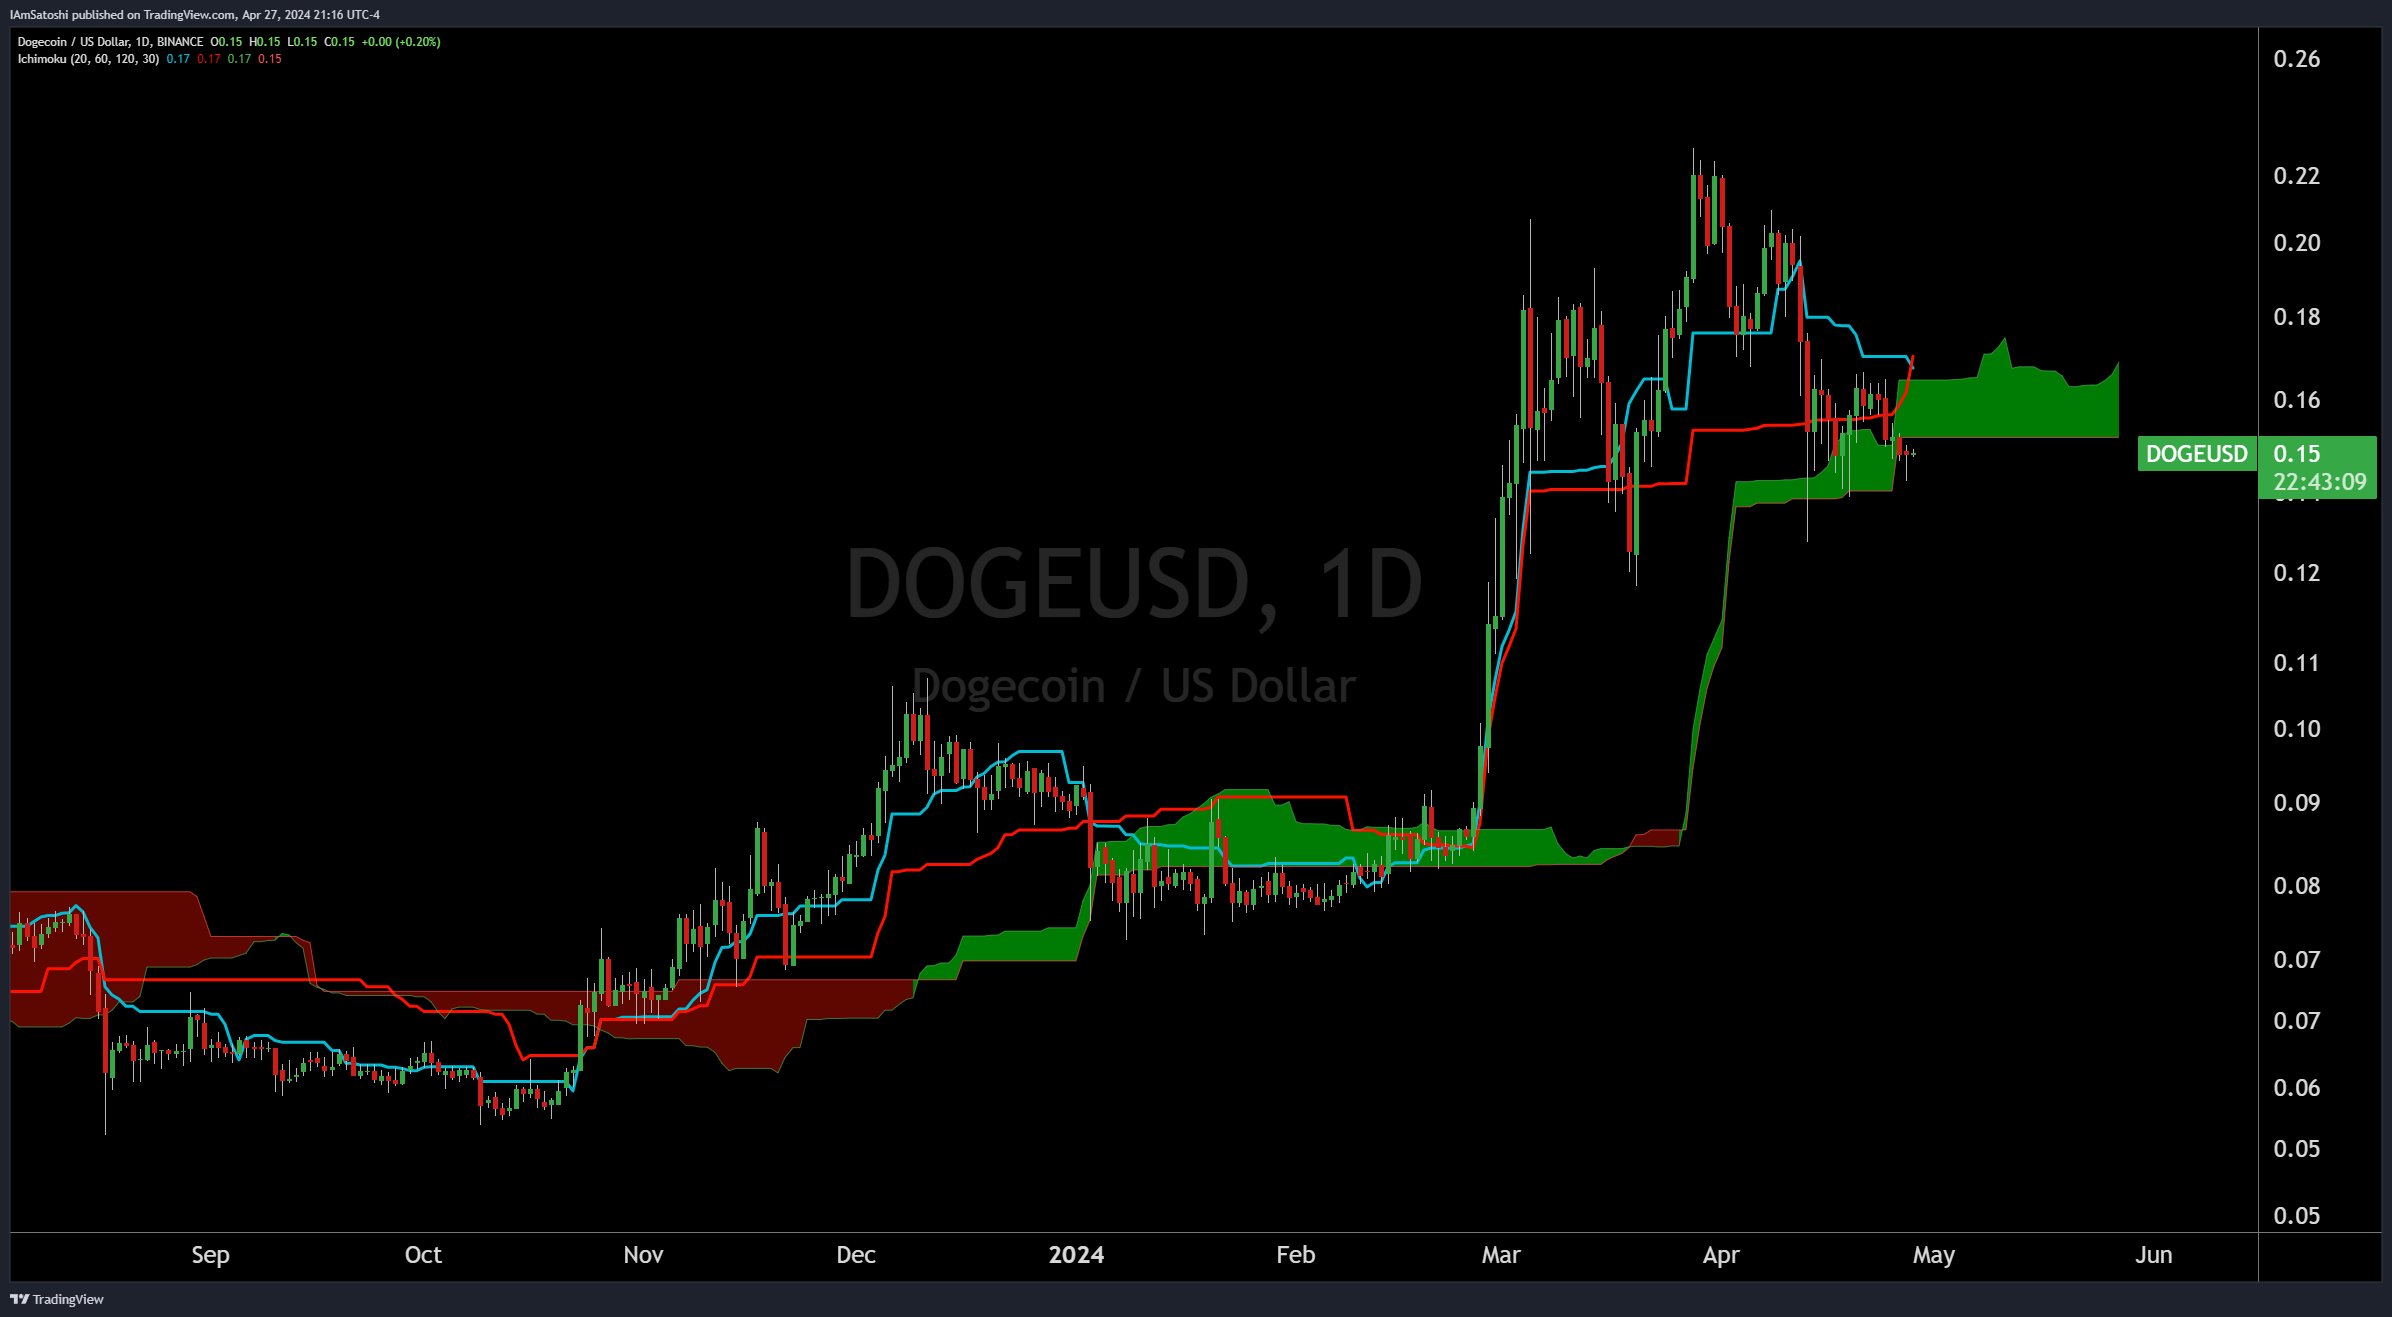
The Tenkan-Sen, which is a faster-moving line typically calculated as the midpoint of the highest high and lowest low over the last nine periods, crossing below the Kijun-Sen, a slower line computed as the midpoint of the highest high and the lowest low over the past 26 periods, is considered a bearish signal.
It suggests that short-term prices are falling below the base level of prices over the last month, indicating potential further downward movement.
The Bearish Kumo breakout: The ‘Kumo’, which translates to ‘cloud’, is part of the Ichimoku Cloud indicator and is formed between two other lines: the Senkou Span A and the Senkou Span B. It represents a key area on the chart that can act as support or resistance.
In the context of Olszewicz’s analysis, a ‘bearish Kumo breakout’ implies that the price has broken through the cloud downwards. This breakout is seen as a confirmation of a bearish trend. The fact that the price is below the Kumo suggests that the overall market sentiment for DOGE is negative, with the Kumo now likely acting as resistance to any upward price movement.
The chart by Olszewicz shows DOGE trading at .15 with the cloud plotted behind the price action, appearing green above and red below the price lines. The cloud turning green represents a bullish future potential, but the price below both the cloud and the Tenkan-Sen/Kijun-Sen crossover indicates bearish current circumstances.
A 40% Price Crash Looming?
This gives weight to Olszewicz previous DOGE price analysis. As NewsBTC reported, the crypto analyst warned of a potential Head and Shoulders (H&S) formation on the DOGE/USD 12-hour chart which could be validated soon.
The formation is characterized by two shoulders flanking a distinctive head, with the neckline at approximately .14 being pivotal. Should Dogecoin’s price break below this critical support, the prophecy of the H&S pattern would likely manifest, potentially triggering a sell-off towards the .10 to .09 region.
This target area aligns with the 1.618 and 2.0 Fibonacci extension levels, suggesting a price crash of around 40% from the neckline. While the pattern has not yet been confirmed, with the price still above the crucial .14 support level, its presence serves as a cautionary signal to the market.
The technical confluence of the bearish TK cross and the bearish Kumo breakout in Olszewicz’s recent analysis only reinforces the possible bearish scenario that lies ahead for Dogecoin. Market participants are recommended to keep a close watch on the .14 level, as a decisive break below could validate the bearish outlook and set the stage for the anticipated decline.
At press time, DOGE traded at .1413.
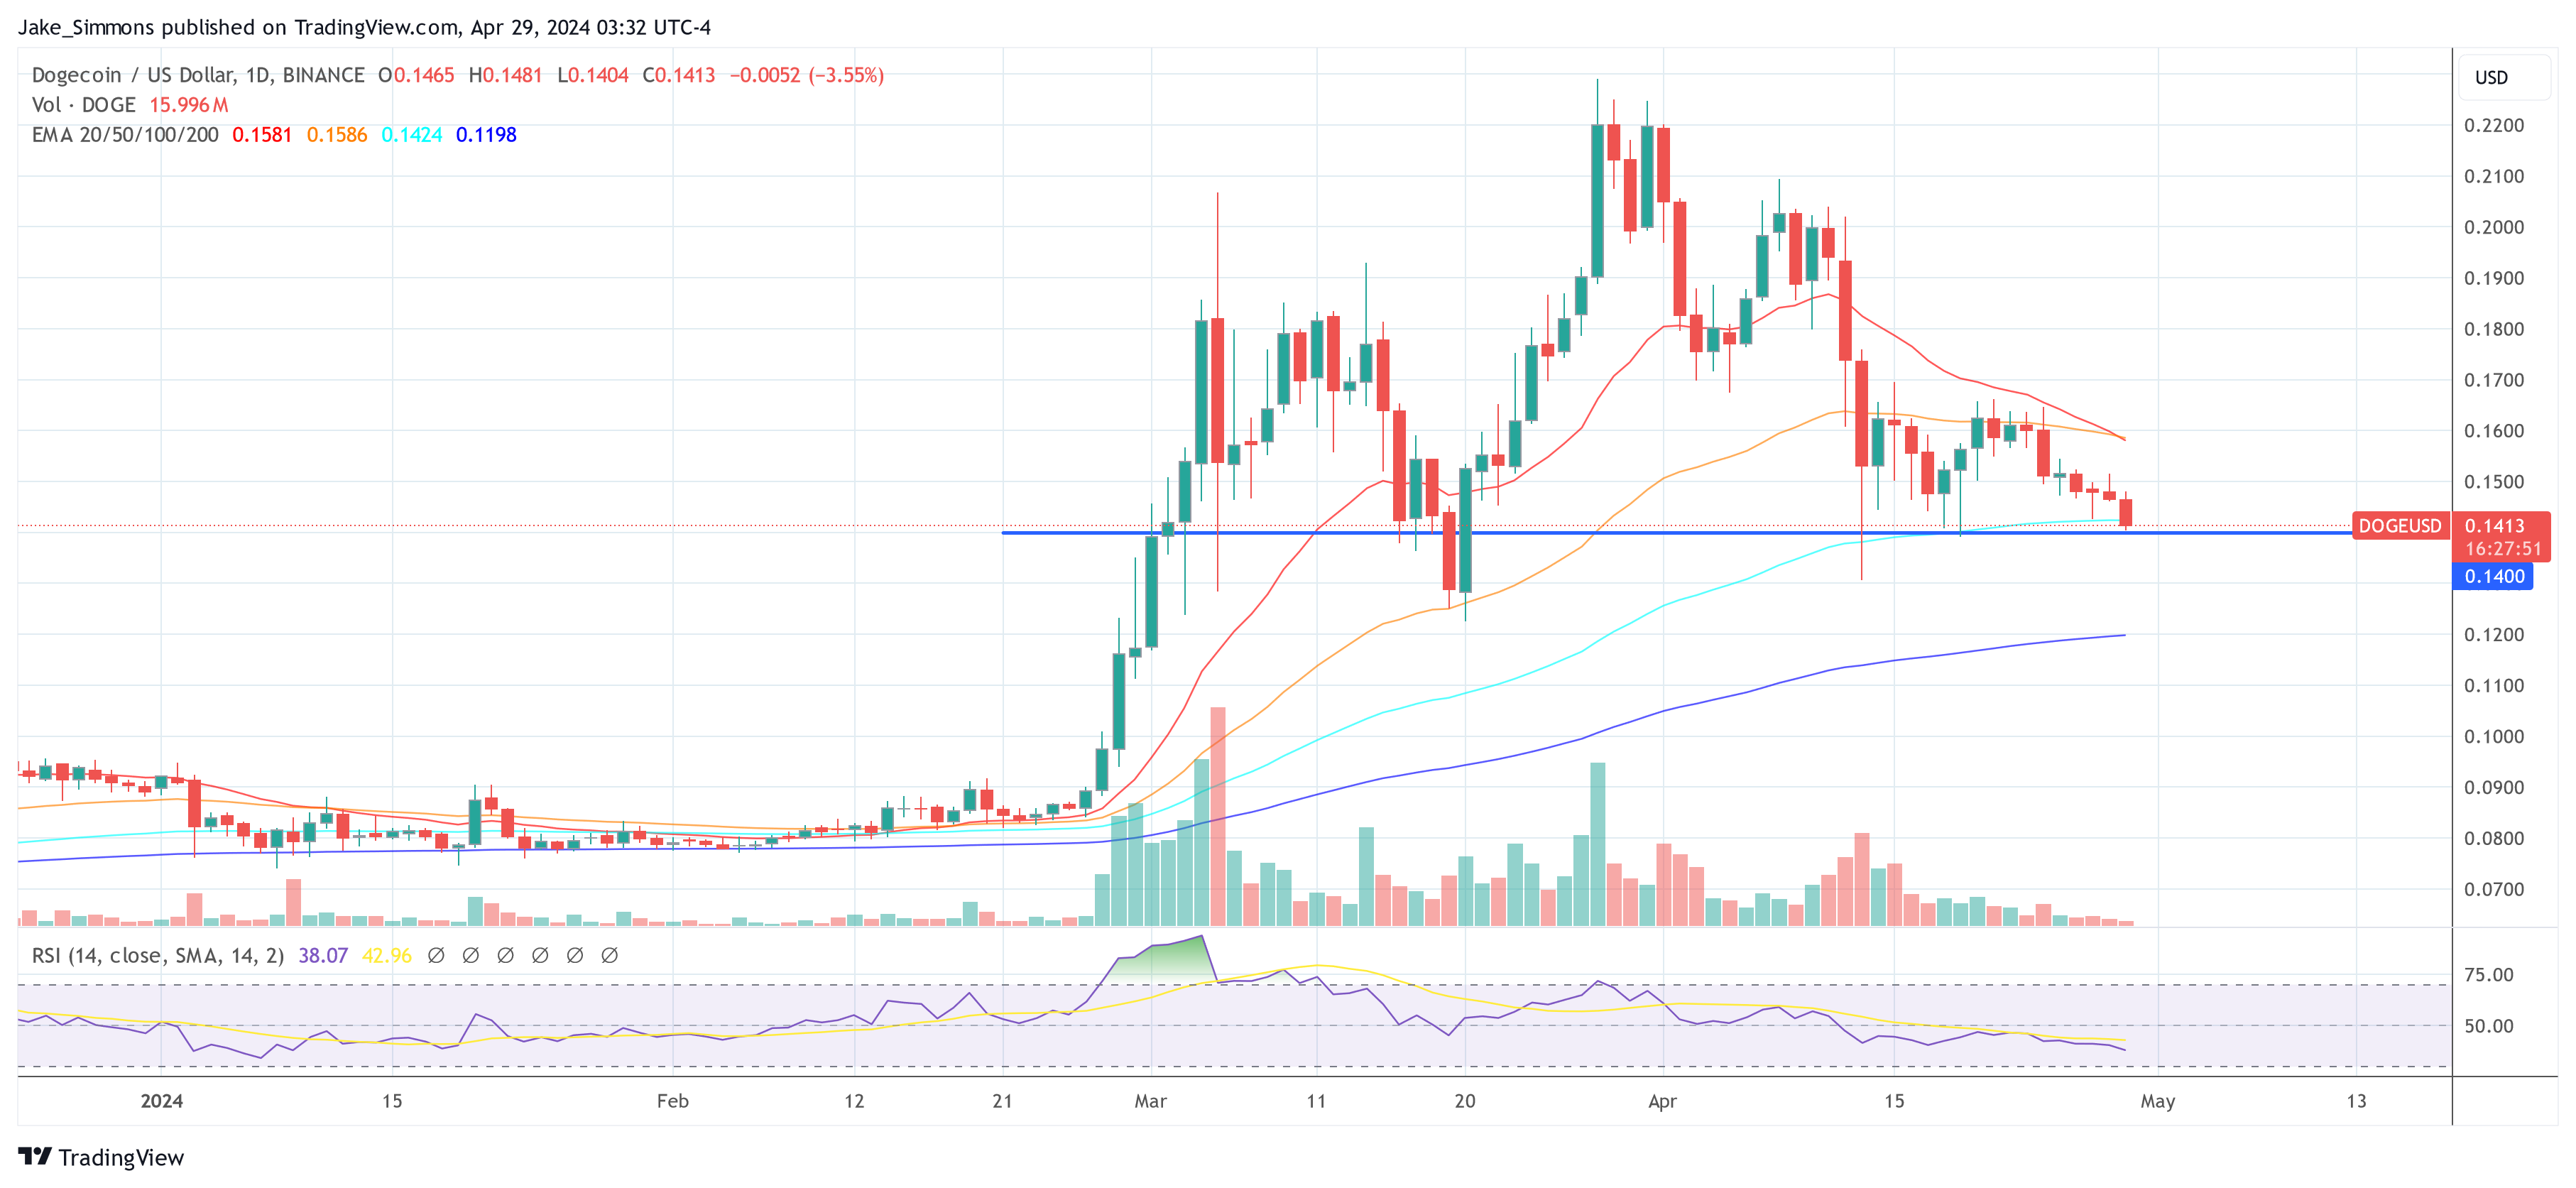
Head And Shoulders Alert: Dogecoin Could See A Price Crash Soon
Crypto analysts are sounding the alarm on Dogecoin as a classic chart pattern, known for predicting bearish trends, has emerged. Technical analyst Josh Olszewicz, @CarpeNoctom, flagged a potential Head and Shoulders (H&S) formation on the DOGE/USD 12-hour chart on X, hinting at a possible significant price drop if the pattern validates.
The H&S pattern is a technical indicator traditionally viewed as a bearish signal within the trading community. The pattern is composed of three peaks, with the central peak (the head) being the highest and the two outside peaks (the shoulders) being lower and approximately equal in height. The line connecting the lowest points of the two troughs (the neckline) can be horizontal or sloped and represents a critical support level.
Dogecoin Must Hold .14
In the case of Dogecoin’s 12-hour chart, the price has completed the left shoulder and the head, with the right shoulder currently forming. The neckline of this H&S pattern is identified at approximately .14, as annotated by Olszewicz. This level is crucial; a decisive break below could confirm the bearish forecast suggested by the H&S formation.
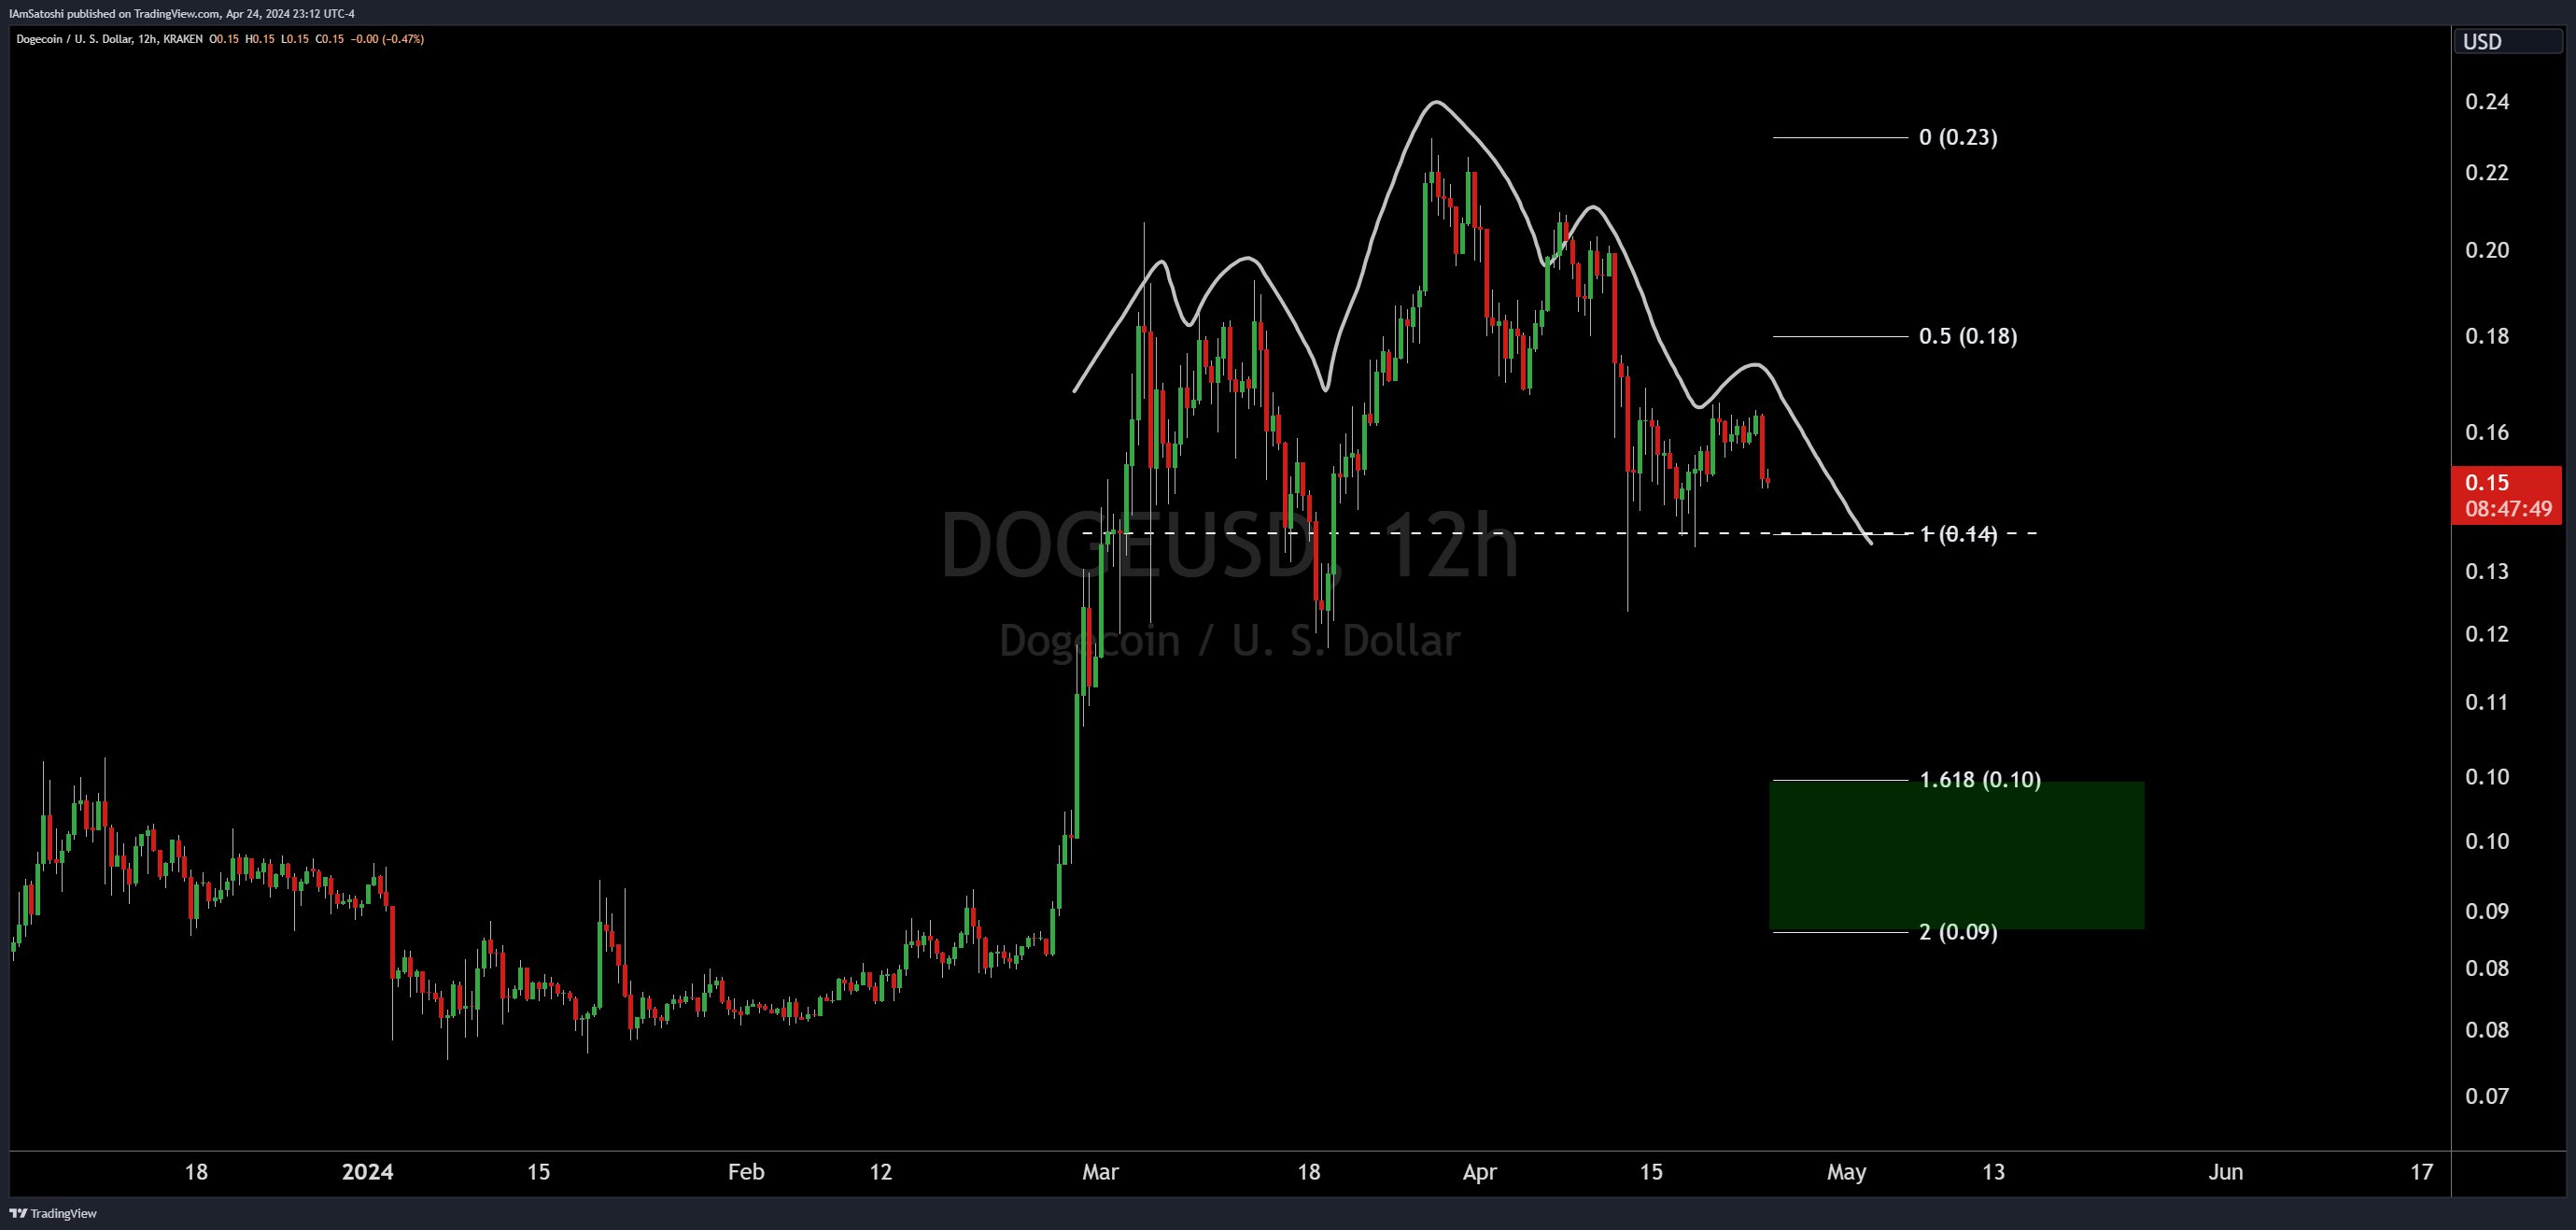
Another technical detail present on the chart is the Fibonacci retracement levels, which are horizontal lines indicating where support and resistance are likely to occur. They are based on Fibonacci numbers, a sequence famous in mathematics and nature for its proportionality.
Here, the 0.5 Fibonacci level aligns with the left shoulder around .18, while the 0 level coincides with the peak at approximately .23. These levels are key to determining the potential support and resistance areas in the market.
Olszewicz has also highlighted a projected target area based on the H&S pattern’s typical behavior. This bearish target is identified using the height of the pattern from the head’s peak to the neckline, projected downward from the point of the neckline break. The target box, marked in green, shows a potential decline to .10 to .09, coinciding with the 1.618 and 2.0 Fibonacci extension levels. A fall to this level could lead to a price crash of 40%.
The importance of the H&S pattern lies in its reliability as a trend reversal signal. It validates when the price breaks below the neckline following the formation of the right shoulder. For traders and investors alike, this pattern serves as a cautionary tale to brace for potential downside risks.
As of the latest chart by Olszewicz, the neckline has not been breached, and the pattern has yet to be confirmed. It is critical for observers to watch the .14 level closely, as a break below it would likely activate a sell-off, fulfilling the H&S prophecy. However, until such a break occurs, the pattern remains a watchful indicator rather than a confirmed trend reversal.
In summary, Dogecoin’s price chart is showing signs that could concern bullish investors. If history is any guide, the emerging H&S pattern, closely watched by analysts like Olszewicz, suggests a possible downward move in Dogecoin’s value in the near future. However, only a decisive break below the neckline will validate this pattern, turning a watchful eye into a bearish outlook.
At press time, DOGE traded at .1509.
Stablecoin Market Hits $160 Billion, Reaching Heights Not Seen Since Terra’s Crash
 This week, the value of the fiat-pegged cryptocurrency economy has climbed to 0 billion, a peak last observed in May 2022, shortly before Terra’s UST detached from its intended parity on May 9, 2022. In the past month, various stablecoins have experienced an increase in supply, with Ethena’s USDE at the forefront, registering a […]
Bitcoin News