 As ethereum continues its price fluctuations, technical indicators on the 1-hour, 4-hour, and daily charts suggest a bearish outlook with mixed trading signals. Despite some bullish undercurrents, the predominant sentiment remains cautious. Ethereum Ethereum’s (ETH) price action has shown a downward trend on the 1-hour chart, marked by a series of lower highs and lower […]
Bitcoin News
Timing The Breakout: When Will Bitcoin Escape The Post-Halving Consolidation?
Bitcoin (BTC), the largest cryptocurrency in the market, has been trading within a re-accumulation range between the ,000 and ,000 price levels for the past month and a half.
Crypto analyst Rekt Capital recently shared its perspective on this phase and its potential duration, drawing from historical patterns and data in a post on social media platform X (formerly Twitter).
Breakout Timing And Historical Patterns
According to Rekt’s analysis, Bitcoin tends to experience a re-accumulation range following the Halving event, which occurs every four years to counteract any inflationary effect on Bitcoin by lowering the reward amount for miners and maintaining scarcity.
Historically, This consolidation phase lasts up to 150 days before Bitcoin breaks into a parabolic uptrend. Based on this pattern, if Bitcoin continues to consolidate for the next 150 days, Rekt suggests a breakout would be expected in September 2024.
The ideal duration of a re-accumulation range is crucial in determining Bitcoin’s future trajectory. Rekt Capital noted that when Bitcoin reached a new all-time high (ATH) of ,700 in mid-March, it accelerated its cycle by 260 days. However, with over 49 days of consolidation, the acceleration has reduced to approximately 210 days.
Resetting The Bitcoin Halving Cycle
Repeating historical trends, where Bitcoin consolidates for 150 days after the Halving, would still indicate an acceleration in the current cycle, albeit by a lesser extent of 60 days.
Nevertheless, Rekt contends that Bitcoin would ideally need to consolidate for at least 210 days to fully resynchronize with its historical Halving cycles and reset the current acceleration in this cycle to 0. This would bring the rate of acceleration to 0 days and potentially lead to a breakout around November 2024.
The analyst further suggested that to achieve a 200+ day post-Halving consolidation and fully resynchronize with historical Halving cycles, Bitcoin would need to replicate its mid-2023 re-accumulation range, which lasted 224 days before a new uptrend emerged. Rekt concluded:
Overall, how long this current Re-Accumulation Range will last will dictate the remaining acceleration in this cycle and ultimately influence where Bitcoin will finally peak in its Bull Market.
The largest cryptocurrency, with a market capitalization of .2 billion, is currently trading at ,400, showing minimal fluctuations compared to Thursday’s price movements.
Recently, Bitcoin has encountered resistance at the ,000 level, hindering its ability to consolidate above this threshold. Conversely, the ,400 level may serve as a support base for the cryptocurrency in the event of heightened downward volatility over the weekend.
Featured image from Shutterstock, chart from TradingView.com
XRP Price Ready For 70% Breakout As Long-Term Consolidation Nears Its End
The XRP price has seen some level of recovery over the last two days that has seen positive sentiment returning to the latocin once again. This has carried forward with the expectation that the price will continue to surge. One crypto analyst in particular, who goes by RLinda, has revealed why the cryptocurrency is set to surge 70%.
XRP Price Completes A False Breakdown
In the analysis that was posted on the TradingView website, crypto analyst RLinda outlined a number of reasons why the XRP price may be getting ready for a surge. One of these reasons is the fact that the altcoin has completed a false breakdown.
This is referring to the price crash that sent the price falling from .7 to .42, recording an almost 50% crash. However, the crypto analyst believes that this crash was bullish for the coin as it was basically a false breakdown, followed by a breakout.
In scenarios such as this, the XRP price could be headed for a breakout similar to the breakdown and eventual recovery between August and November 2023. Such a case could see the price rise 50% with a higher end of 70%.
Additionally, the XRP price has also been in long term consolidation, another factor that could contribute to this breakout. “XRPUSDT is forming a technical false break of support, in the long term consolidation above the zone should be formed with the purpose of continuation of growth, the potential of which can be opened by 50-70%,” the analyst stated.
The State Of XRP
XRP has already seen investors returning once it was clear the worst of the crash. Crypto whales, in particular, have been making their bets, moving 600 million XRP tokens. As NewsBTC reported, whales holding between 10 million and 100 million XRP increased their holdings by 30 million in just one week. But even more interesting is the fact that they have moved up to 600 million tokens in the space of two weeks.
These moves come ahead of crypto analysts prediction major upside for the cryptocurrency. One of those is crypto analyst Egrag Crypto who predicted that the XRP price is ready to spike as high as .4. This would mean an over 100% increase in price.
However, XRP has not exactly been the market favorite in recent times. Its daily trading volume has seen a notable decline, with Coinmarketcap reporting a 20% drop to .33 billion in the last day. Nevertheless, the altcoin remains the 7th-largest in the space, with a market cap of .3 billion.
Bitcoin Technical Analysis: Upper Resistance Holds Strong Amidst Consolidation Phase
 As bitcoin flirts with the ,556 mark, its oscillation between ,900 and ,391 within the last 24 hours suggests a battleground for bulls and bears alike. Amidst a trading volume of .37 billion, the cryptocurrency giant showcases a current market capitalization of .36 trillion. Bitcoin Bitcoin’s current trading landscape, through the lens of oscillators and […]
Bitcoin News
Bitcoin Technical Analysis: BTC Consolidation Points to Potential Shifts Ahead
 On March 29, 2024, with a trading price of ,075, and oscillating within a 24-hour range of ,362 to ,754, bitcoin’s current market behavior reveals significant consolidation and neutrality. Bitcoin Bitcoin’s 1-hour chart reveals recent volatility, with a significant bounce from a low of approximately ,362, suggesting a strong support level. Conversely, the resistance near […]
Bitcoin News
Ethereum Price Starts Consolidation – Why Pullbacks Could Be Limited
Ethereum price is still struggling to clear the ,000 resistance zone. ETH might consolidate for some time above ,600 before the bulls gain strength.
- Ethereum traded to a new multi-month high above ,980.
- The price is trading near ,850 and the 100-hourly Simple Moving Average.
- There is a short-term breakout pattern forming with resistance at ,950 on the hourly chart of ETH/USD (data feed via Kraken).
- The pair could resume its increase if it clears the ,950 resistance zone.
Ethereum Price Revisits K
Ethereum price extended its rally above the ,900 level, like Bitcoin. ETH cleared the ,950 level and traded close to the ,000 resistance zone. It traded to a new multi-month high above ,990 and recently started a consolidation phase.
There was a pullback below the ,920 level. The price tested the 23.6% Fib retracement level of the recent wave from the ,211 swing low to the ,9983 high. Ethereum price is now consolidating near ,850 and the 100-hourly Simple Moving Average.
There is also a short-term breakout pattern forming with resistance at ,950 on the hourly chart of ETH/USD. If the pair stays above the ,800 level, it could attempt another increase. Immediate resistance on the upside is near the ,900 level.
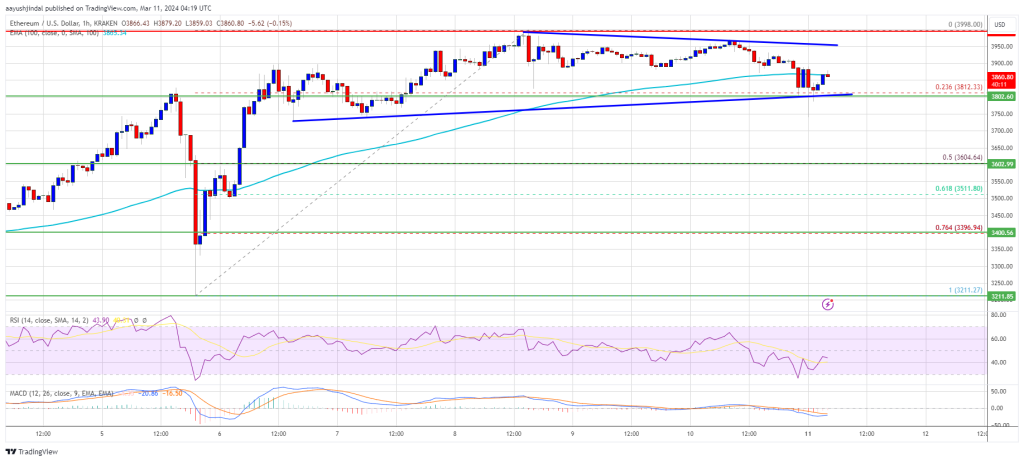
Source: ETHUSD on TradingView.com
The first major resistance is near the ,940 level. The next major resistance is near ,000, above which the price might gain bullish momentum. In the stated case, Ether could rally toward the ,120 level. If there is a move above the ,120 resistance, Ethereum could even rise toward the ,220 resistance. Any more gains might call for a test of ,350.
Are Dips Limited In ETH?
If Ethereum fails to clear the ,950 resistance, it could start another downside correction. Initial support on the downside is near the ,800 level.
The first major support is near the ,600 zone or the 50% Fib retracement level of the recent wave from the ,211 swing low to the ,9983 high. The next key support could be the ,400 zone. A clear move below the ,400 support might send the price toward ,250. Any more losses might send the price toward the ,120 level.
Technical Indicators
Hourly MACD – The MACD for ETH/USD is losing momentum in the bullish zone.
Hourly RSI – The RSI for ETH/USD is now below the 50 level.
Major Support Level – ,800
Major Resistance Level – ,950
Bitcoin Technical Analysis: BTC Bulls Show Strength After Recent Consolidation Period
 Bitcoin’s price has seen a period of consolidation after its recent high of around ,884, according to price data from Feb. 19, 2024. Technical indicators suggest the leading crypto asset remains in an uptrend and may be poised for a further move higher after this sideways trading range. Shorter timeframe charts point to strengthening bullish […]
Bitcoin News
Analyst Predicts Bitcoin Consolidation, Eyes Long-Term Price Target Of $500,000
In the last day, Bitcoin (BTC) has notched up minor gains to the tune of 0.7%, pushing its market price above the ,000 mark. Investors in the world’s leading cryptocurrency are likely encouraged by this recent price gain, following the 20% price decline that trailed the highly anticipated approval of the Bitcoin spot ETFs earlier in January.
Amidst many speculations on BTC’s next movement, popular crypto analyst Michaël van de Poppe has released a prediction that indicates Bitcoin’s movement may be restricted for the coming months. Albeit, he projects a massive price surge in future years.
Bitcoin Potential Consolidation Paves The Way For Altcoin Boom
In a post on X on January 27, van de Poppe shared an intriguing forecast on Bitcoin’s price trajectory, as he predicted the digital asset to soon enter a consolidation state. According to the crypto analyst, Bitcoin is likely to trade between ,000 – ,000 for the next few months. If this prediction holds true, BTC could maintain its current upward trajectory and head for the ,000 zone before experiencing any major pullback.
#Bitcoin dominance peaking a few months prior to the Bitcoin halving.
History repeating itself.
It has happened in 2016, 2020 and seems likely to happen in 2024 as well.
Once #Bitcoin bottoms out, I expect altcoins to start outperforming. pic.twitter.com/82VkuFr4Tq
— Michaël van de Poppe (@CryptoMichNL) January 20, 2024
Interestingly, van de Poppe also stated that a possible Bitcoin consolidation would lead to altcoins recording significant market gains. In a previous prediction, the crypto enthusiast shared a similar belief explaining that BTC is gradually approaching its peak market dominance with the Bitcoin halving event just a few months away.
Based on historical data from 2016 and 2020, when BTC attains its highest level of market dominance, the altcoins embark on a bullish run and even outperform the market leader. Michaël van de Poppe is projecting a similar occurrence in the coming months, accompanied by a BTC consolidation phase.
Analyst Remains Optimistic About Long-Term ETF Impact On BTC
In the same post on X on January 27, de Poppe also commented on the potential effects of the Bitcoin spot ETF on the asset’s price. The analyst expressed much confidence in the newly introduced exchange-traded products (ETP) stating they had the potential to spur BTC to a market price of 0,000 to 0,000 in the coming years.
His prediction comes as the Bitcoin spot ETF market is currently witnessing a decline in outflows following a rather perturbing start which saw over .786 billion exit the novel market within its first 10 trading days.
On January 26 (trading 11), the BTC spot ETF recorded a new minimum outflow of 5.1 million, according to data from BitMEX Research. At the time of writing, total net flows in the ETF market stand at 9.4 million with Bitcoin trading at ,088. If de Poppe’s forecast proves true, investors in both markets could record massive profits in the coming years.
Bitcoin Technical Analysis: BTC Reclaims $41K Mark Following Short-Term Consolidation

At present, the price of bitcoin is ,106, marking a significant climb from its 24-hour low of ,538 and peaking at ,474. This upward movement signifies a 3% gain within the last day, reflecting a surge of optimistic sentiment among investors in the short term. Yet, when expanding the view to include a broader timeframe, the picture shifts: there’s a marginal 0.5% decrease over the previous week, a more pronounced 10% fall in the past fortnight, and an aggregate drop of 4.3% since the preceding month.
Bitcoin
As of Friday, bitcoin’s market capitalization stands impressively at 6 billion, bolstered by a vigorous 24-hour trading volume of .44 billion. A glance at the 1-hour chart reveals bitcoin’s recent upward trajectory, marked by significant price increases underpinned by strong trading volume, vital for maintaining this upward trend.
However, recent declines hint at a moderate retraction from its highest point, likely a standard correction after a steep rise. The 4-hour chart offers a broader view, depicting a stagnant market pattern before the rally, indicative of horizontal trading. The ensuing sharp increase in price, coupled with a noticeable rise in volume, indicates a powerful market movement with the potential for further development, although a slight pullback is currently evident.
On the daily chart, the wider market mood is discernible. Prior to the latest price activity, bitcoin experienced a downward trend and then entered a consolidation phase. The escape from this phase was characterized by a substantial jump but was soon followed by a decline, suggesting persistent selling pressure.
Current oscillators shed light on BTC’s market dynamics. The relative strength index (RSI) is at 45, suggesting a neutral market. The Stochastic and commodity channel index (CCI) reinforce this neutral position, showing values of 28 and -69, respectively. Meanwhile, the momentum indicator indicates positive market sentiment at -2001, while the current moving average convergence/divergence (MACD) level at -807 points towards bearish tendencies, presenting a market with conflicting dynamics.
The moving averages (MAs) provide a varied outlook. Short-term exponential moving averages (EMAs) and simple moving averages (SMAs) for 10 days reflect a positive trend, mirroring the recent upward shifts. In contrast, the 20, 30, and 50-day EMAs and SMAs suggest a bearish trend, underscoring the downturns in these periods. However, the longer-term 100 and 200-day EMAs and SMAs lean towards bullish territory, indicating a fundamental strength in the market.
Bull Verdict:
From a bullish perspective, bitcoin’s recent price action, characterized by a 3% rise in the last 24 hours and a strong rebound from its 24-hour low, demonstrates a resilient market presence. The substantial trade volume and a robust market capitalization of 6 billion further reinforce the underlying strength of bitcoin’s market standings. The short-term bullish signals in moving averages and positive momentum indicators suggest the potential for further upward movement.
Bear Verdict:
On the bearish side, bitcoin’s performance over broader time frames cannot be overlooked. The 0.5% decline over the past week, coupled with a 10% drop in the last two weeks and a 4.3% decrease since last month, paints a picture of lingering uncertainty and potential downward pressure. The mixed signals from oscillators and the negative indications in longer-term moving averages suggest a cautious approach.
Register your email here to get weekly price analysis updates sent to your inbox:
What do you think about bitcoin’s market action on Friday? Share your thoughts and opinions about this subject in the comments section below.
Bitcoin Technical Analysis: BTC in Consolidation Phase as Upper Resistance Strengthens

The leading cryptocurrency, bitcoin, has remained within a limited price range since yesterday. This followed yesterday’s quick surge to the K level, which then declined in the early trading hours of Thursday. Although there was a transient increase to the K mark, the value has stayed under the K threshold since that point. Notably, there has been minimal market movement and volume recorded at 8:00 a.m. Eastern Time on Friday morning.
Bitcoin
On the 1-hour chart, bitcoin (BTC) exhibited a dramatic surge, touching a peak of approximately ,048 on Jan. 11, 2024, indicative of a strong buying interest or a response to yesterday’s ETF listing news. This spike was followed by a swift decline, with the price finding support near ,304. The current trend shows a downward trajectory in a tight range, potentially signaling a phase of consolidation following the earlier substantial movement.
Bitcoin’s 4-hour chart offers a broader perspective, depicting a period of consolidation preceding the spike and subsequent formation of lower highs, a classic indication of a downtrend in this timeframe. Notably, a much firmer support level around ,454 emerges as crucial, previously acting as a springboard for price rebounds. At press time, the price of BTC is coasting along at ,745 per unit at 9:00 a.m. Eastern Time on Friday.
Interestingly, an analysis of the 4-hour chart shows a rising consolidation pattern, where the price of bitcoin is steadily nearing the K resistance level. This trend suggests a finely balanced tug-of-war between buyers and sellers. An ascending flag formation is becoming evident, with its top border coinciding with the critical K resistance. Meanwhile, the path of least resistance appears to be on the downside.
The daily chart strips away the ‘noise’ of shorter timeframes, presenting a clear uptrend from the previous Nov. 21, 2023 low of around ,561. However, this ascent is not without its volatility, as evidenced at the current levels. The ,048 mark from Jan. 11, 2024, stands as a formidable short-term resistance, challenging the currency’s upward momentum.
Oscillator analysis further enriches our understanding. The relative strength index (RSI) and Stochastic present a neutral to bearish stance at 59 and 68, respectively. However, the commodity channel index at 105 suggests more bearish action is in the cards, while the moving average convergence/divergence (MACD) level at 1,113 leans toward bullish optimism, displaying the multifaceted nature of market sentiment.
Moving averages (MAs) paint a bullish picture as well, with both exponential moving averages (EMAs) and simple moving averages (SMAs) across various periods (10, 20, 30, 50, 100, 200-day) unanimously indicating positive market sentiment. This consistency across time frames emphasizes a strong underlying bullish sentiment in the market, albeit juxtaposed against the backdrop of the oscillators’ mixed signals.
Bull Verdict:
In conclusion, the bull verdict for bitcoin’s performance on January 12, 2024, is decidedly optimistic. The consistent bullish signals from moving averages across multiple timeframes, coupled with the ascending consolidation pattern on the 4-hour chart, point towards a strong underlying bullish momentum. Despite some resistance encountered at the ,048 mark, the overall trend suggests a robust buying interest that could potentially propel the price to new heights.
Bear Verdict:
Conversely, the bear verdict paints a more cautious picture for BTC prices. The observed lower highs on the 4-hour chart, combined with the mixed signals from oscillators, suggest an underlying market uncertainty. The resistance level at ,048 appears formidable, potentially signaling a ceiling for the current uptrend. Furthermore, the consolidation phase and the delicate balance between buyers and sellers indicate a market that could be primed for a downturn.
Register your email here to get weekly price analysis updates sent to your inbox:
What do you think about bitcoin’s market action on Friday? Share your thoughts and opinions about this subject in the comments section below.