 According to the seven-day simple moving average (SMA) statistics regarding Bitcoin’s hashrate, the network hashrate has stayed below the 600 exahash per second (EH/s) mark for approximately one week. The recent rise in bitcoin’s price has positively influenced the overall hashprice as the value of 1 petahash per second (PH/s) daily has climbed above the […]
Bitcoin News
Michael Saylor Foresees U.S. Pension Funds’ Bitcoin Adoption
 Michael Saylor, co-founder of Microstrategy and a prominent Bitcoin advocate, recently suggested in a social media post that U.S. pension funds, which collectively manage approximately trillion in assets, will need to incorporate bitcoin into their portfolios. He stated, “There are thousands of pension funds in the United States managing ~ trillion in assets. They […]
Bitcoin News
Report: CME Group to Launch Bitcoin Trading Amid Rising Demand From Wall Street
 CME Group, the world’s largest futures exchange, is planning to launch bitcoin trading to capitalize on the surging demand among Wall Street money managers for exposure to the cryptocurrency sector, according to a report from the Financial Times. The Chicago-based group has reportedly been in discussions with traders interested in buying and selling the cryptocurrency […]
Bitcoin News
Most Important Bitcoin Indicator Nears Bullish Flip: $150,000 Soon?
In a recent analysis, James Coutts, Chief Crypto Analyst at Realvision, signaled a potential bullish turn in Bitcoin’s near future, attributing the forecasted change to shifts in global liquidity measures, specifically the Global Money Supply (M2) index which is widely seen as most important price catalyst. Coutts detailed this anticipation in a thread on X, where he examined the relationship between major economic indicators and Bitcoin’s price cycles.
Global Money Supply And Its Correlation With Bitcoin
Coutts’ analysis begins with the M2 money aggregates, which consist of cash, checking deposits, and easily convertible near money. He tracks these aggregates across the 12 largest economies, all adjusted to USD. This measure, he suggests, is central to understanding liquidity flows within the global fiat, credit-based financial system. According to Coutts, “The money stock often moves in one direction, with significant drops like those seen in 2022 being rare and typically brief.”
Currently, the Global M2 is neutral, but Coutts predicts imminent changes: “There is a sea of red across my macro & liquidity dashboard, but signs are emerging that this is about to change. Global M2 holds the key for the next leg of the cycle due to its high correlation with $BTC bull cycles.”
The rate of change in M2 money supply is more critical than its nominal value. Coutts noted, “The chart confirms what our MSI performance table suggests: Bitcoin usually moves with shifts in M2 momentum.” He explained that despite the global money supply MSI indicator being in an uptrend, the momentum remains sluggish, maintaining a Neutral MSI. For a shift to a bullish MSI signal, an increase in momentum is necessary, requiring a combination of dollar depreciation, credit expansion, and increased government debt issuance.
Coutts pointed out the crucial role of credit conditions, as evidenced by corporate bond spreads (BBB/Baa) compared to the US 10-year Treasury yield, which have historically aligned with significant inflections in Bitcoin’s cycle. “These spreads are currently narrowing, indicating that corporations are managing to issue and roll over debt despite the high interest rates resulting from the record hikes in 2022 and 2023,” he observed.
Using the chameleon trend indicator on the corporate spread index, Coutts suggests a strategy: “Long Bitcoin when the index shows a bearish trend (red) and stay alert for potential trend reversals (turning green).”
The Role Of the Dollar And Future Outlook
A key to this cycle, according to Coutts, is the behavior of the DXY (Dollar Index), which measures the US dollar against a basket of foreign currencies. “The Dollar is range-bound. A break below 101 would be rocket fuel for Bitcoin,” he asserted, emphasizing that market sentiment on liquidity is often reflected in real-time by DXY movements.
Coutts also touched upon the US debt situation, suggesting that without a conservative shift in Congress advocating for fiscal responsibility, more deficit spending is likely on the horizon, which could further influence liquidity conditions favorable to Bitcoin.
Coutts concluded with a note of caution mixed with optimism: “While my framework needs 2/3 MSI indicators to turn Bullish for macro headwinds to turn into tailwinds, Bitcoin price action will probably sniff out this inflection in the macro before most indicators react.”
His analysis suggests that if Bitcoin breaks above its all-time highs, it would be unwise to bet against it, anticipating potential climbs towards 0,000 in this cycle. “The DXY holds the key to the Bitcoin cycle as it prices in mkt expectations on liquidity in real time. And liquidity is coming. Watch the 101/102 level on DXY If that breaks, then we should see ~0k btc this cycle,” he remarked.
At press time, BTC traded at ,090.
Early Bitcoin Proponent Erik Voorhees: Crypto Will Be the Currency of AI
 Erik Voorhees, an early bitcoin proponent and entrepreneur, believes that crypto will be the currency of artificial intelligence (AI) agents. At Unchained, Laura Shin’s crypto podcast, Voorhees explained that, as soon as AI agents start interacting economically, they only will be able to manage cryptocurrency. “An AI agent can’t go set up a bank account. […]
Bitcoin News
Vanguard CEO Salim Ramji Sticks to Firm’s Anti-Crypto Stance, No Plans for Bitcoin ETF
 Salim Ramji, the new CEO of Vanguard and former head of Blackrock’s global ETF business, has affirmed the company’s position against launching a spot bitcoin exchange-traded fund (ETF), emphasizing the need for consistency with Vanguard’s investment philosophy that views crypto as a speculative and immature asset class. Despite Ramji’s prior involvement in launching Blackrock’s successful […]
Bitcoin News
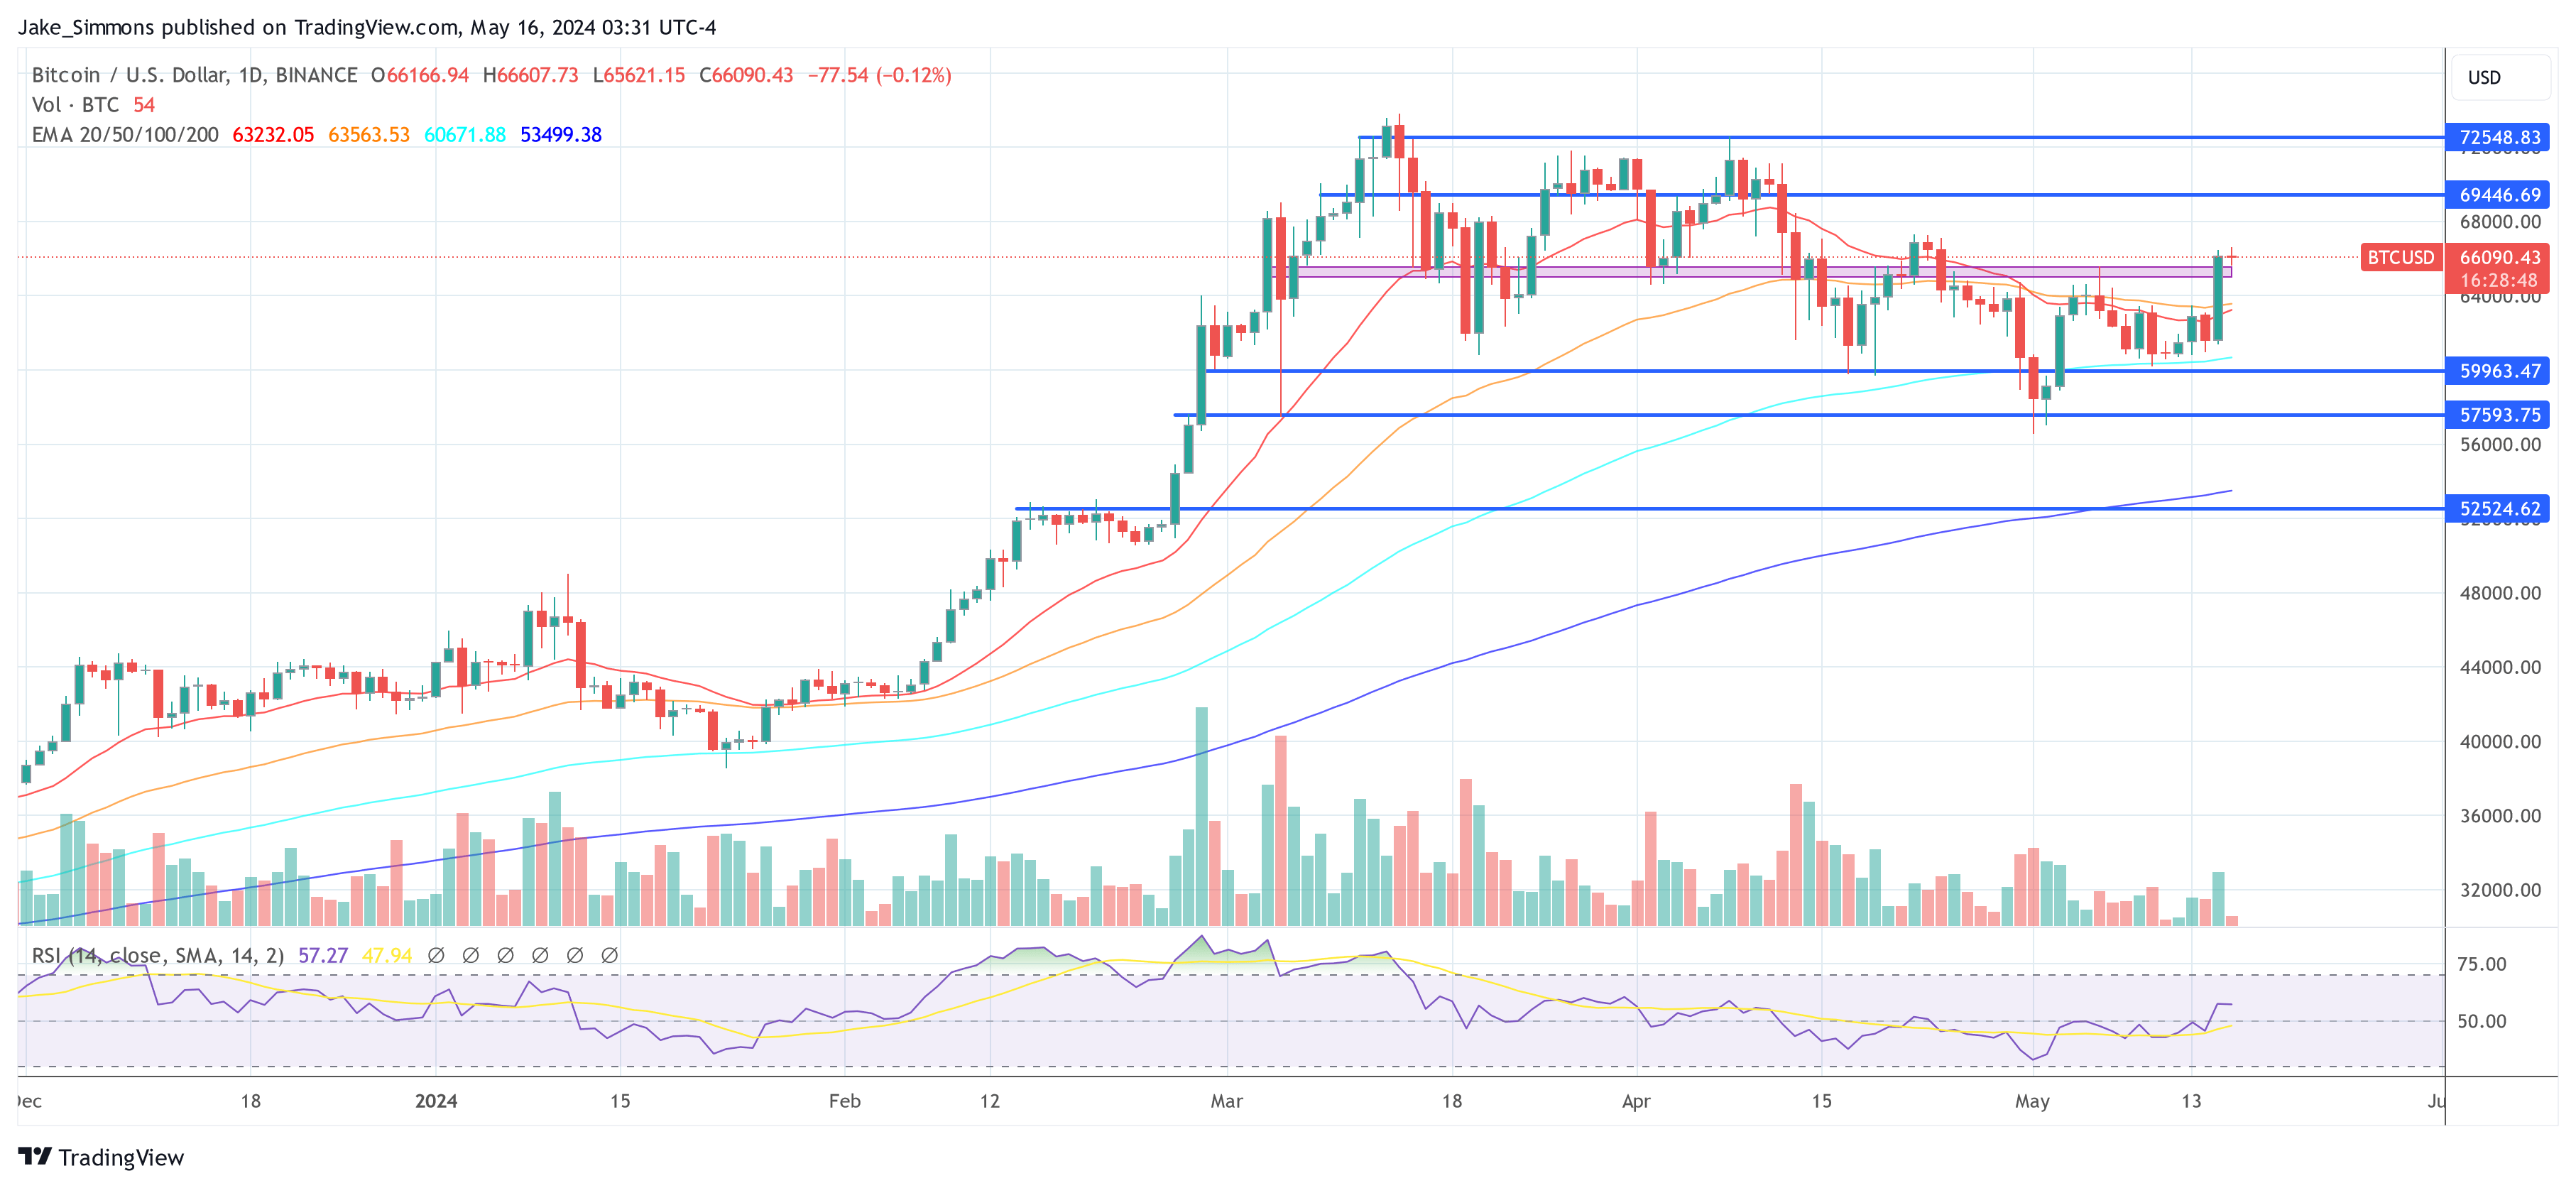
Bitcoin Breaks Free: Emerging from Bearish Sentiment, Crypto Market Optimism Rises
Bitcoin price is up nearly 8% and it broke many hurdles. BTC is now consolidating gains and might correct in the short term toward ,000.
- Bitcoin started a strong increase and cleared the ,500 resistance zone.
- The price is trading above ,000 and the 100 hourly Simple moving average.
- There was a break above a key bearish trend line with resistance at ,500 on the hourly chart of the BTC/USD pair (data feed from Kraken).
- The pair could correct gains but the bulls might be active near ,000 and ,500.
Bitcoin Price Jumps 8%
Bitcoin price remained strong above the ,000 support zone. BTC formed a base and started a fresh increase above the ,000 level. There was a break above a key bearish trend line with resistance at ,500 on the hourly chart of the BTC/USD pair.
The pair rallied over 6% and broke many hurdles near the ,500 resistance. It even cleared the ,500 resistance. A new weekly high was formed at ,411 and the price is now consolidating gains.
It is holding gains above the 23.6% Fib retracement level of the recent wave from the ,073 swing low to the ,411 high. Bitcoin price is also trading above ,000 and the 100 hourly Simple moving average.
Immediate resistance is near the ,400 level. The first major resistance could be ,850. The next key resistance could be ,200. A clear move above the ,200 resistance might send the price higher. In the stated case, the price could rise and test the ,000 resistance.
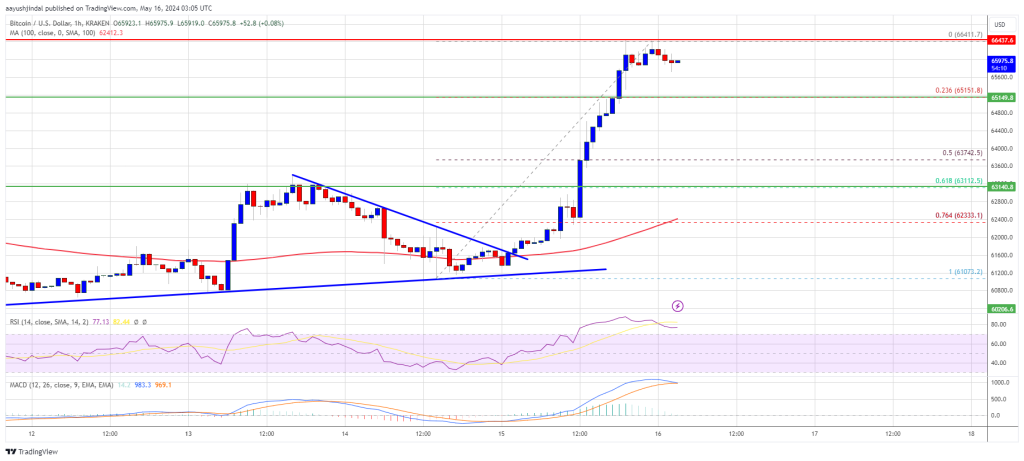
If there is a close above the ,000 resistance zone, the price could continue to move up. In the stated case, the price could rise toward ,000.
Are Dips Limited In BTC?
If Bitcoin fails to climb above the ,400 resistance zone, it could start a downside correction. Immediate support on the downside is near the ,150 level.
The first major support is ,500. If there is a close below ,500, the price could start to drop toward ,500 or the 50% Fib retracement level of the recent wave from the ,073 swing low to the ,411 high. Any more losses might send the price toward the ,000 support zone in the near term.
Technical indicators:
Hourly MACD – The MACD is now gaining pace in the bullish zone.
Hourly RSI (Relative Strength Index) – The RSI for BTC/USD is now above the 50 level.
Major Support Levels – ,150, followed by ,500.
Major Resistance Levels – ,400, ,800, and ,200.
EOS Network Foundation Founder: Bitcoin Halving Spurs Development of Solutions Enhancing Network Efficiency
 With Bitcoin transaction fees recently becoming a more critical component of miner revenue, Yves La Rose, CEO of Exsat, believes there is “an increased incentive to adopt and develop solutions that enhance transaction throughput and network efficiency.” According to La Rose, this can be achieved by integrating advanced layer two (L2) solutions which expand the […]
Bitcoin News
Bitcoin Not Out Of Danger Yet, NVT Golden Cross Warns
On-chain data shows the Bitcoin Network Value to Transactions (NVT) Golden Cross still has a high value, a sign that may be bearish for BTC.
Bitcoin NVT Golden Cross Is Still Near Historical Top Zone
In a CryptoQuant Quicktake post, an analyst discussed the recent trend in the NVT Golden Cross for BTC and its implications for the price.
The NVT ratio is an indicator that tells us about how the Bitcoin market cap compares against its transaction volume. The metric is generally used to judge whether the asset’s price is fair or not right now.
When the indicator’s value is high, it suggests the network’s value (that is, the market cap) is high compared to its ability to transact coins (the volume). Such a trend implies that the asset may be overpriced currently.
On the other hand, the low metric means the cryptocurrency’s price may be undervalued due to a rebound as the market cap is low compared to the volume.
In the context of the current topic, the NVT ratio itself isn’t of interest; rather, it is a modified form called the NVT Golden Cross. This metric compares the short-term trend (the 10-day moving average) with the long-term trend (30-day MA) of the NVT ratio to identify tops and bottoms.
Here is a chart that shows the trend in this Bitcoin indicator over the past couple of years:

In the graph, the quant has highlighted the two relevant zones for the Bitcoin NVT Golden Cross. It would appear that when this metric is above 2.2, a top can be probable for the cryptocurrency as its price is overvalued in this zone. Similarly, the NVT Golden Cross being under -1.6 can lead to a bottom formation for the asset.
The Bitcoin NVT Golden Cross has ventured into the red territory for the last couple of months. Each time it has seen a decline out of the zone, it has followed up with another rise into the zone. As such, it hasn’t been able to visit the bullish region yet.
At present, the metric has just made another exit out of the top zone, but its value is still quite near it. Thus, while a top may not be especially probable now, a lasting uptrend is also unlikely to happen.
It’s possible that Bitcoin won’t be completely out of danger of observing more price drawdowns until the NVT Golden Cross can see a decrease in the green zone.
It now remains to be seen how the indicator develops in the near future and whether its changes will affect the BTC price.
BTC Price
At the time of writing, Bitcoin is floating around the ,900 mark, up more than 4% over the past week.
Bitcoin Soaring Toward $84,000: Insights From Glassnode Co-Founders
In a remarkable turn of events, Bitcoin (BTC) has broken out of its recent trading range, recording a 7% surge in the past 24 hours alone. The cryptocurrency tests the ,000 resistance level, setting the stage for a potential move toward higher targets.
The latest momentum shift in Bitcoin’s price action has caught the attention of industry experts, particularly the co-founders of on-chain analytics firm Glassnode. According to their analysis, the trigger for a larger market structure release has been in the works since the March highs.
Bitcoin Breaks Out
The co-founders of Glassnode believe this breakout has been coming for a long time. They state that they have been waiting for the trigger to unleash a major bullish structure since the March highs when Bitcoin reached its current all-time high (ATH) of ,700, and it looks like the market has finally done so.
They believe the trigger was the recent lower-than-expected US inflation figures and weaker retail sales data, which could prompt a more “dovish stance” from the Federal Reserve.
According to the Glassnode co-founders, this opens the door to a more dovish stance from the Fed. They explain that Bitcoin and the market liked this, and now they expect the price to reach ,000 before ,000 and then up towards ,000. They also believe the altcoins will follow this move strongly.
However, not all analysts are as bullish in the immediate term. Crypto trader and analyst Justin Bennett suggests that Bitcoin needs to hold the ,000 level as new support, cautioning that the ,000 and ,000 price levels could act as resistance and liquidity pockets. He warns that if Bitcoin loses the ,000 support, it’s back to the “chopfest” – further consolidation and volatility.
Andrew Tate Considers Dumping Fiat For BTC
In a surprising move, popular internet personality and self-proclaimed “Top G” Andrew Tate has announced his intention to abandon fiat currency and invest over 0 million into Bitcoin. In a post on social media platform X, formerly known as Twitter, Tate declared, “I’m about to leave fiat completely and ape over 100M into BTC.”
Tate, who has faced numerous legal issues and has been banned from several social media platforms, cited his frustrations with the traditional banking system and fiat currency as the driving force behind this potential decision.
“I’m done with the banks. I’m done with their money. Done with the scams,” he wrote in the post.
In a follow-up post, Tate acknowledged that he has not finalized this decision, as he currently holds more cryptocurrency than fiat currency in his portfolio.
However, he hinted that he might “leave fiat completely,” suggesting that his preference for Bitcoin and other digital assets is growing.
As of press time, Bitcoin is testing the ,900 mark, having regained its bullish momentum. It remains to be seen how far the current rally can extend and whether the bullish momentum can survive potential selling pressure at higher price levels.
Featured image from Shutterstock, chart from TradingView.com