 Between November 2023 and April 10, the number of active cryptocurrency users from the Middle East and North Africa using the Bitget platform grew by more than 1,400%. Bitget’s strong performance in the Middle East and North Africa is attributed to the region’s perceived high adoption rates and the generally friendly landscape for cryptocurrencies. Support […]
Bitcoin News
Anticipation Builds as Bitcoin Stands Less Than 1,400 Blocks From Monumental Halving
 According to the latest data, we are now less than 1,400 blocks away from the anticipated Bitcoin halving event, which will decrease the block reward from 6.25 bitcoin to 3.125 bitcoin. Bitcoin’s value soared to a new all-time high on March 14, reaching ,794 per bitcoin, but has since seen a 6.5% decline. Observers are […]
Bitcoin News
Shiba Inu Burn Rate Surges Over 1,400%, As Price Recovers
Shiba Inu, an Ethereum-based meme coin, is presently in the limelight as its burn initiative has witnessed a significant surge in its token burn rate in the past day, suggesting increased engagement from the community.
Shiba Inu Daily Burn Rate Skyrockets
Data from Shibburn reveals that the last 24 hours have seen a notable spike in the Shiba Inu burn rate. The tracker reported that the burn rate has recorded a massive 1,411% increase today, January 30.
According to the platform, over 61 million SHIB tokens have been incinerated in the last 24 hours. The increase in burn rate coincides with a recent rally in the price of Shiba Inu.
Shibburn shows that the present rise in burn rate was caused by two large burn transactions. It was discovered that the two transactions destroyed a total of 48.9 million SHIB in less than one hour.
The first transaction orchestrated by the wallet address 0x85a860003705c56…7eb2f4bcc7 witnessed about 21 million SHIB being destroyed. Meanwhile, the second transaction carried out by another wallet address 0x85a860003705c56…7eb2f4bcc7 saw over 27 million SHIB tokens being burned.
The Shiba Inu burn rate might have been up in the past day, but in the past week, the rate appears to have been down. From the hourly SHIB burn update on X (formerly Twitter), the rate is down by over 48% in the past week. Furthermore, the report noted that over 113.42 million Shiba Inu tokens have been destroyed in the past seven days.
Even though tokens have been burned virtually every day for more than a year now, the burn rate has not made a crater in the supply that is in circulation. So far, Shiba Inu has burned over 410.70 trillion SHIB since the initiative was introduced.
Currently, the overall supply in circulation is about 581.29 trillion SHIB. This indicates more work to be done by the SHIB community before the incineration has a weighty effect.
SHIB Prices Recovers Amid Burn Rate Rise
Shiba Inu price, as of today, appears to have recovered from a lengthy bearish trend it has been struggling with. However, there is no solid proof that the rise in burn rate had any impact on the crypto asset’s recent rally.
As of the time of writing, the price of Shiba Inu was sitting at .000009254, indicating a 2.24% rise in the past 24 hours. CoinMarketCap reveals that its market cap and trading volume are up by 2.19% and 45.16% in the past day.
Furthermore, the digital asset is now ranked 17th overall in terms of market cap due to its recent price recovery. With the recovery, SHIB has attracted attention from investors and sparked fresh sentiments over possible long-term growth.
FCA Has Dealt With 1,400 Cases Related to Unregulated Crypto Activity, UK Regulator Reveals

The U.K. Financial Conduct Authority (FCA) has revealed that it has dealt with over 1,400 crypto cases between January 2020 and June 2023. The regulator noted that “a shortage of crypto skills meant the FCA took longer than planned to register crypto-asset firms under money laundering regulations.”
1,400 Cases Related to Unregulated Crypto-Asset Activity
The U.K. National Audit Office (NAO) issued a report on Friday titled “Financial services regulation: Adapting to change.” The NAO, which examines public spending for Parliament, operates independently of the government and the civil service.
“The financial services sector is also undergoing significant changes: whole new sets of products, such as crypto-assets, and rapid advances in technology, such as AI, provide opportunities for innovation but also risks to businesses and consumers which the FCA [Financial Conduct Authority] must plan for,” the report details, adding that there were:
1,400 cases related to unregulated crypto-asset activity that the FCA has dealt with between January 2020 and June 2023.
The FCA began supervising crypto firms in January 2020 through money laundering regulations. Any firm wishing to exchange currency for crypto, vice versa, or safeguard crypto assets in the U.K. must register and be supervised by the FCA. Existing firms had to register by January 2021, while new firms must do so before operation.
“The FCA assessed 158 applications between 2020 and 2021. Only 29 firms were registered, and the others were withdrawn, refused or rejected. The FCA created a temporary registration regime for firms to continue to operate after the deadline while it completed their assessments, and all cases were resolved by March 2022,” the NAO report states. “While the FCA has required crypto-asset firms to comply with anti-money laundering regulations since January 2020, and began supervision work including engaging with unregistered firms, it did not begin taking enforcement action against illegal operators of crypto ATMs until February 2023.”
The report further explains, “There can be a significant delay between the FCA identifying an issue to tackle, and it taking regulatory action,” elaborating:
The FCA is aware it needs to maintain specialist skills to avoid causing delays in its work — for example, a shortage of crypto skills meant the FCA took longer than planned to register crypto-asset firms under money laundering regulations.
The FCA also monitors firms for violations of the financial promotions regulations. The report notes that the FCA has “a dedicated team to tackle high risk and illegal financial promotions,” adding that more than 3,150 crypto-asset scams were reported in 2020, rising to more than 6,300 in 2021 and more than 3,900 in the first half of 2022. “The FCA published a public list of unauthorised firms and since this list has been published more than 300 firms have been flagged by the FCA,” the report notes.
What do you think about the U.K. regulatory environment for crypto? Let us know in the comments section below.
Bitcoin, Ethereum Technical Analysis: BTC Above $20,000, ETH Beyond $1,400 on Saturday
Bitcoin rose back above ,000 on Saturday, despite markets still being spooked by the collapse of yet another banking institution. Silicon Valley Bank was shut down by U.S. regulators on Friday, causing many institutions to lose access to capital. This includes USDC issuer Circle, which led to a USDC depegging. Ethereum also rebounded on Saturday.
Bitcoin
Bitcoin (BTC) rose back above ,000 on Saturday, despite overall volatility in financial markets being at historic highs.
This comes as the Federal Deposit Insurance Corporation (FDIC) confirmed it was shutting down Silicon Valley Bank.
Despite this, BTC/USD raced to an intraday high of ,792.53, less than 24 hours after trading at a low of ,628.25.
Overall, today’s marginal rally in price comes as the 14-day relative strength index (RSI) found a floor at the 27.00 level.
At the time of writing, the index is tracking at 28.46, with bitcoin at ,279.45, as earlier gains have eased.
Market volatility will likely remain higher in the coming days, leading to bitcoin moving above and below ,000 throughout the weekend.
Ethereum
Ethereum (ETH) was also significantly higher to start the weekend, as prices rose back above ,400.
Following a two-month low at ,378.53 yesterday, ETH/USD moved to a peak at the ,481.32 level on Saturday.
The move comes as ethereum bulls bought yesterday’s dip, as price strength moved deep into oversold territory.
Friday saw ethereum’s RSI fall to 28.30, which was its weakest point since last June, however the index has since rallied.
As of writing, it is now tracking at 32.26, and appears to be heading towards a long-term floor at 34.00.
Should it reach this point, there is a strong possibility that ethereum will be back above ,500.
Register your email here to get weekly price analysis updates sent to your inbox:
Will today’s rebound extend into the remainder of the weekend? Leave your thoughts in the comments below.
Bitcoin, Ethereum Technical Analysis: BTC Under $20,000 as ETH Sinks Below $1,400 on Friday

Bitcoin fell below the ,000 level for the first time since January, as markets continued to react to the liquidation of Silvergate Bank. This comes ahead of a pivotal U.S. nonfarm payrolls report, which could decide how aggressive the Federal Reserve acts in its upcoming meeting. Ethereum moved under ,400 in today’s session.
Bitcoin
Bitcoin (BTC) fell for a fifth straight session on Thursday, as markets continued to react to the Silvergate Bank liquidation.
The bank confirmed that it will be winding down its operations, leading U.S. Senator Elizabeth Warren to blame crypto as a whole.
As such, less than 24 hours after hitting a hit at ,796.12, BTC/USD fell to an intraday low of ,669.92 earlier today.
The plunge in price pushed bitcoin to its weakest point since January 13, when it bottomed out at ,714.
Another catalyst of the sell-off was the 14-day relative strength index (RSI), which fell below a key floor at the 32.00 mark.
At the time of writing, the index is tracking at 26.11, which is deep in oversold territory, and the lowest reading in price strength since November 9.
Ethereum
Ethereum (ETH) was also significantly lower in Friday’s session, with market volatility also higher due to this afternoon’s nonfarm payrolls report.
It is expected that 205,000 jobs were added to the U.S. economy last month, down from January’s 517,000 total.
The decline could act as an overall positive, as the Federal Reserve could hike rates less aggressively depending on the result.
ETH/USD fell to a low of ,378.53 earlier in the session, which comes a day after trading at a peak of ,543.69.
Overall, ETH is now down by nearly 10% in the last week, with today’s decline sending the price to its weakest point since mid-January.
The RSI is now tracking at 28.30 as a result of this sell-off, which is its weakest point since last June.
Register your email here to get weekly price analysis updates sent to your inbox:
Will a weak nonfarm payrolls number help boost crypto prices? Leave your thoughts in the comments below.
Ethereum Price Consolidates Near $1,400 As The Bulls Aim $1,500
Ethereum climbed higher above the ,400 resistance zone against the US Dollar. ETH is consolidating gains and might rise further towards the ,500 level.
- Ethereum started a fresh increase above the ,350 and ,400 resistance levels.
- The price is now trading above ,400 and the 100 hourly simple moving average.
- There is a major bullish trend line forming with support near ,365 on the hourly chart of ETH/USD (data feed via Kraken).
- The pair could rise further unless there is a clear move below the ,350 support.
Ethereum Price Turns Green
Ethereum price started a strong increase above the ,320 resistance. ETH was able to clear the ,350 resistance zone to move into a positive zone, similar to bitcoin above ,200.
The price even climbed above the ,400 resistance zone. A high is formed near ,437 and the price is now consolidating gains. Ether price is now trading above ,400 and the 100 hourly simple moving average. There is also a major bullish trend line forming with support near ,365 on the hourly chart of ETH/USD.
Recently, there was a downside correction below the ,420 level. The price declined below 23.6% Fib retracement level of the upward move from the ,351 swing low to ,437 high.
However, the price is stable near the ,400 zone. An immediate resistance is near the ,435 level. The next major resistance is near the ,500 level. An upside break above the ,500 resistance zone could set the pace for more gains.
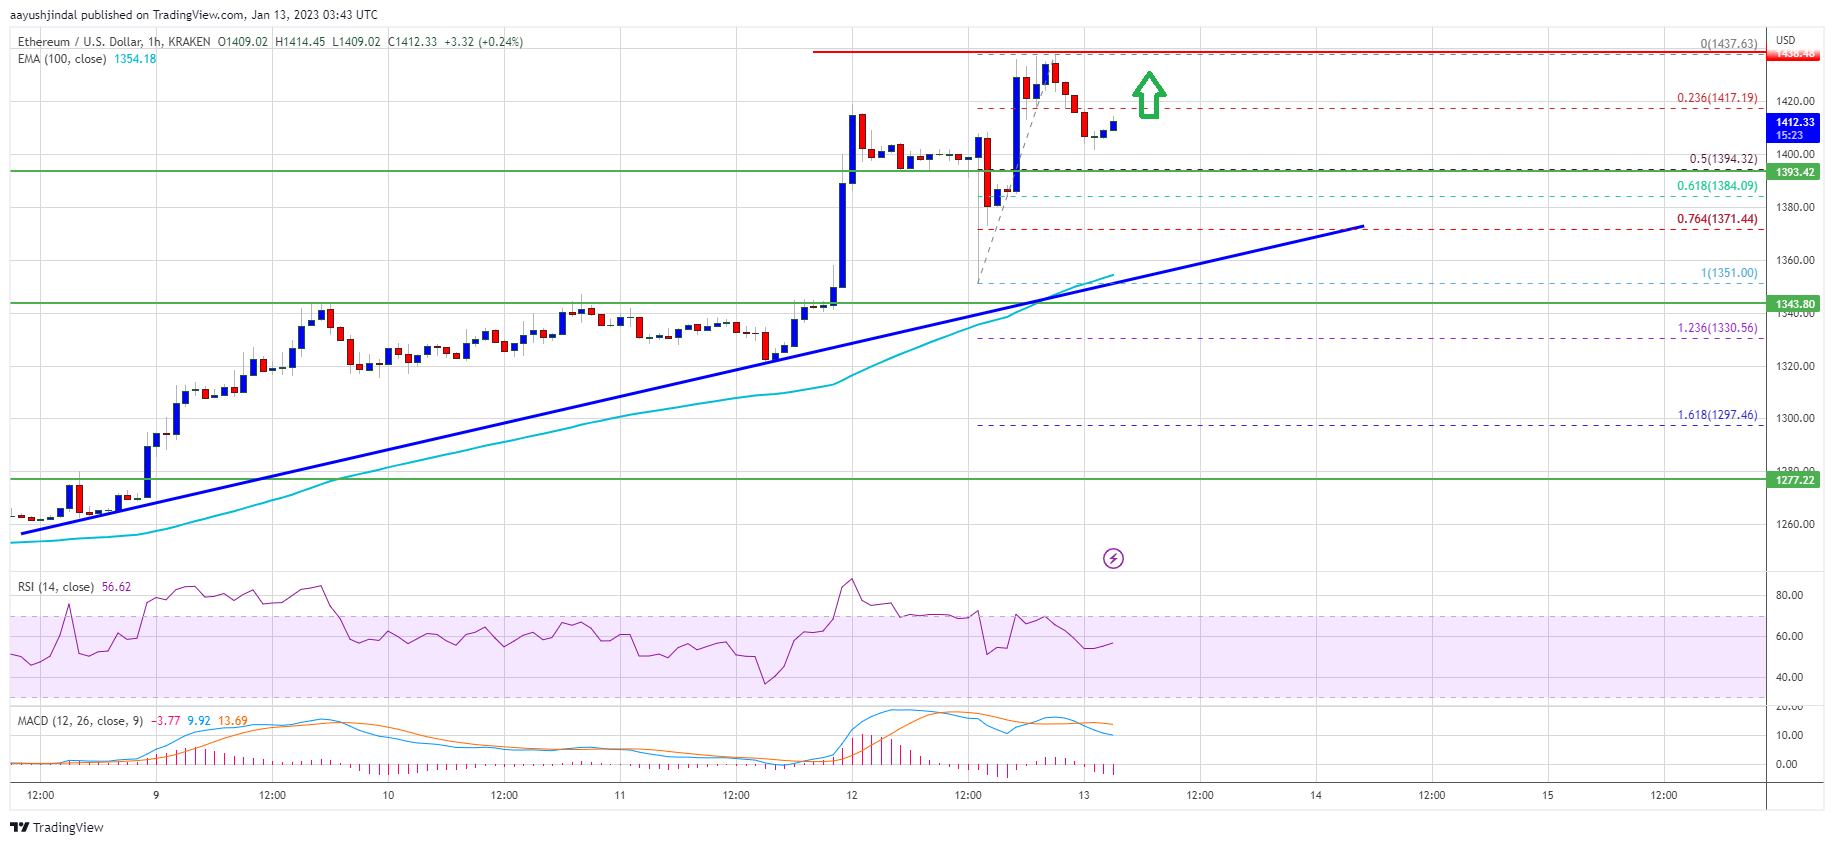
Source: ETHUSD on TradingView.com
In the stated case, the price may perhaps rise towards the ,550 resistance. Any more gains might send the price towards ,600 or even ,620 in the near term.
Dips Supported in ETH?
If ethereum fails to clear the ,430 resistance, it could start a downside correction. An initial support on the downside is near the ,394 level.
The next major support is near the ,370 level and the trend line. It is near the 76.4% Fib retracement level of the upward move from the ,351 swing low to ,437 high. If there is a move below ,370, the price might test the ,350 support. Any more losses might call for a test of the ,300 zone.
Technical Indicators
Hourly MACD – The MACD for ETH/USD is now losing momentum in the bullish zone.
Hourly RSI – The RSI for ETH/USD is now above the 50 level.
Major Support Level – ,370
Major Resistance Level – ,430
Ethereum Rallies Above $1,400 As Sharks Accumulate
Ethereum has rallied above ,400 today as on-chain data shows ETH sharks have been busy accumulating recently.
Ethereum Shark Addresses Have Grown By 3,000 In the Last Two Months
As per data from the on-chain analytics firm Santiment, the current number of shark addresses in the market is the highest since February 2021. The relevant indicator here is the “ETH Supply Distribution,” which tells us which coin groups have how many wallets.
These coin groups are ranges that define the number of coins the addresses currently hold in a particular group. For example, the 1-10 coins cohort includes all wallets holding at least one and at most 10 ETH. The Supply Distribution metric for this group would then track the total number of addresses falling inside this range.
In the context of the current topic, the coin group of interest is the 100-10,000 coins cohort (which is made up of two separate groups, 100-1,000 coins, and 1,000-10,000 coins; they have just been merged). Now, here is a chart that shows the Supply Distribution data for this Ethereum coin group:

It looks like the value of this metric has observed some uptrend in recent weeks | Source: Santiment on Twitter
This coin group’s lower and upper bounds convert to around 0,000 and million. The Ethereum investors who hold amounts in this range are called the sharks, and although they aren’t as crucial as the whales, movements from these holders can still have significant implications on the market.
As shown in the above graph, the Ethereum sharks were taking profits during September and October last year as their total number of addresses declined to a low. However, over the past few months, accumulation has rapidly taken place in the market as 3,000 new shark addresses have been created on the network.
ETH has been rallying in recent days as these sharks have been accumulating, and for now, these investors aren’t showing any signs of stopping either. The total number of addresses belonging to this cohort is 48,556, the highest level the indicator has seen since February 2021, almost two years ago.
If these sharks budge here and take some profits while the prices are high, the rally might lose steam and end. However, if these investors keep this accumulation up instead, it would be a bullish sign for Ethereum, and the rally may continue.
ETH Price
At the time of writing, Ethereum is trading around ,400, up 12% in the last week.

The value of the crypto seems to have sharply surged in the last few days | Source: ETHUSDT on TradingView
Featured image from Gerald Schömbs on Unsplash.com, charts from TradingView.com, Santiment.net
Craziest Bitcoin Price Predictions For 2023, 1,400% Rally Possible?
The start of a new year kicked off Bitcoin price and crypto market forecasts across social media and mainstream media platforms. Experts are debating whether bulls or bears will drive 2023’s price action. Last year, bears took over and sent the benchmark crypto back to its 2020 levels.
As of this writing, the Bitcoin price trades at ,700, recording a small profit during today’s trading session. On higher timeframes, the cryptocurrency continues to record sideways price action. The latter could operate as the dominant price action for 2023.

The Best Is Yet To Come For The Bitcoin Price
Per a report from CNBC, the Bitcoin price is bound for an extreme shift in its trajectory. Optimistic experts, such as BTC bull Tim Draper, believe the cryptocurrency will trend higher from its current levels.
Draper believes the benchmark crypto will experience a 1,400% rally, reclaim previously lost territory, and break above 0,000 by mid-2023. The BTC bulls believe macroeconomic conditions will push adoption much higher.
One demographic will lead this potential new wave of adoption that will coincide with the upcoming Bitcoin halving. This event is scheduled for 2024, but in the past, the market has priced its impact much earlier. Draper said:
My assumption is that since women control 80% of retail spending, and only 1 in 7 bitcoin wallets are currently held by women that the dam is about to break.
Professor of finance at Sussex University, Carol Alexander, believes Bitcoin could see two short-term rallies. The first could take the Bitcoin price back to ,000, and the second to ,000 on the back of less trading volume and prominent players.
As FTX and Three Arrows Capital collapse, Alexander expects less competition in the market, which could provide other prominent players with room to push BTC upwards. The professor explained:
There will be a managed bull market in 2023, not a bubble — so we won’t see the price overshooting as before. We’ll see a month or two of stable trending prices interspersed with range-bounded periods and probably a couple of short-lived crashes.
Exploring Less Favorable Scenarios, How Low Can BTC Go?
Better macroeconomic landscape, adoption, halving and supply squeeze, and less competition. These are the factors that could work in favor of the cryptocurrency.
On the other hand, Eric Robertsen from Standard Charted claims the Bitcoin price could return to its 2020 levels and touch ,000. A lack of trust from investors and more capitulation from crypto companies could prompt this scenario.
The low liquidity levels in the sector make things worse. The current state of the market could experience another leg lower if the U.S. Federal Reserve (Fed) doubles down on its hawkish monetary policy.
According to Mark Mobius, who successfully predicted the BTC crash from ,000 to ,000 in 2022, if the Fed continues to tighten, the cryptocurrency could drop to around ,000. Mobius said:
With higher interest rates, holding or buying Bitcoin or other cryptocurrencies becomes less attractive since just holding the coin does not pay interest.
Ethereum Price Bulls Hold Strong, Indicators Suggest Fresh Rally To $1,400
Ethereum bulls defended the ,220 support zone against the US Dollar. ETH is rising and might aim a strong bullish wave above the ,300 resistance zone.
- Ethereum remained well bid and strong above the ,220 zone.
- The price is now trading above ,250 and the 100 hourly simple moving average.
- There was a break above a major bearish trend line with resistance near ,245 on the hourly chart of ETH/USD (data feed via Kraken).
- The pair is showing positive signs and might eye an upside break above the ,300 resistance.
Ethereum Price Remains Stable
Ethereum price extended its decline below the ,250 level. ETH even moved below the ,240 support level and the 100 hourly simple moving average, similar to bitcoin.
However, the bulls were active near the ,220 support zone. They defended more losses and slowly ether price moved higher. There was a move above the ,240 and ,250 levels. There was a break above the 50% Fib retracement level of the key decline from the ,304 swing high to ,220 low.
Besides, there was a break above a major bearish trend line with resistance near ,245 on the hourly chart of ETH/USD. The pair is now trading above ,250 and the 100 hourly simple moving average.
It is consolidating near the 76.4% Fib retracement level of the key decline from the ,304 swing high to ,220 low. An immediate resistance on the upside is near the ,290 level. The first major resistance is near the ,300 zone.
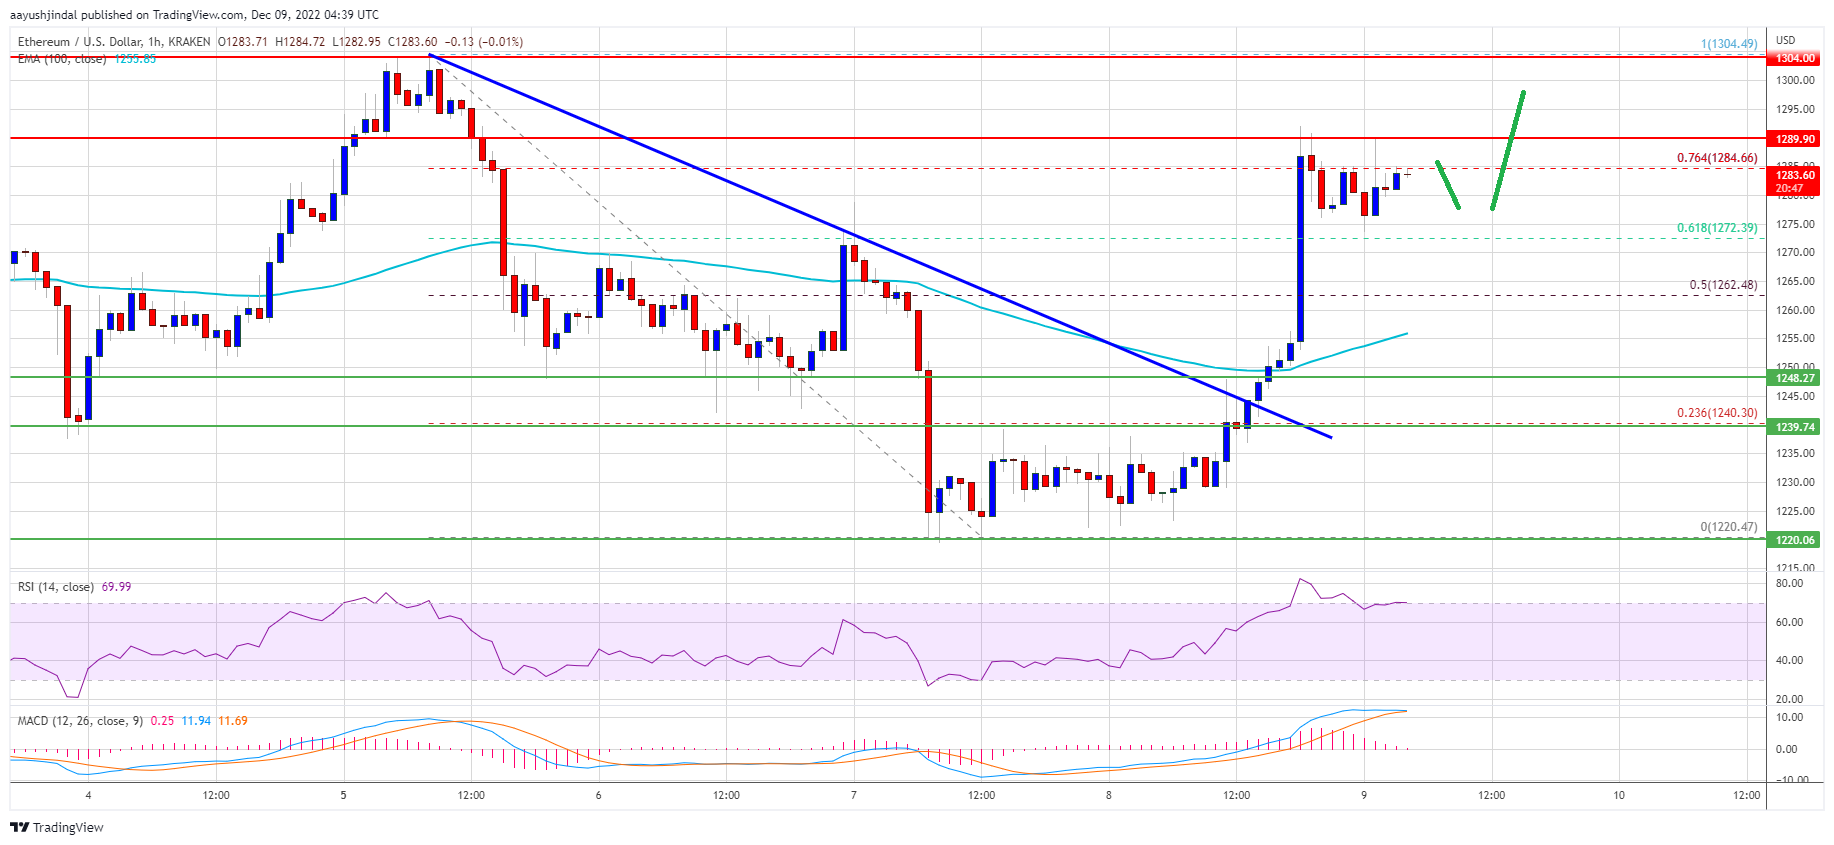
Source: ETHUSD on TradingView.com
A close above the ,300 resistance might start a fresh increase. The next major resistance is near the ,320 level, above which ether price could gain bullish momentum for a move to ,400. Any more gains might send the price towards the ,450 resistance zone.
Fresh Decline in ETH?
If ethereum fails to climb above the ,300 resistance, it could start another drop. An initial support on the downside is near the ,260 level and the 100 hourly simple moving average.
The next major support is near the ,220 level. If there is a break and close below ,220, the price could drop towards the ,200 support. Any more losses could lead the price towards the ,165 support.
Technical Indicators
Hourly MACD – The MACD for ETH/USD is now gaining momentum in the bullish zone.
Hourly RSI – The RSI for ETH/USD is now correcting from the overbought zone.
Major Support Level – ,220
Major Resistance Level – ,300