 Sales volumes of non-fungible tokens (NFTs) recorded a more than 37% increase to 7 million in the seven-day period ending April 11. Six of the top 10 collections with the largest sales volumes were Bitcoin-based NFTs. Some experts attribute the renewed interest in NFTs to the rise of real-world assets and NFTs with built-in utility. […]
Bitcoin News
Bitcoin Retests Resistance: Here’s The Level A Break Could Lead To
Data shows Bitcoin is currently retesting a major on-chain resistance level, and a break above which can potentially lead to a surge in its price.
Bitcoin Has Major On-Chain Resistance Around ,000
As pointed out by analyst Ali in a post on X, BTC may be able to see a rise towards the ,900 level if the asset can break the current on-chain resistance barrier.
In on-chain analysis, any level’s potential to act as support or resistance is measured using the amount of Bitcoin that was acquired/bought by the investors around said level.
The analyst has shared the chart for the “UTXO Realized Price Distribution” (URPD) indicator from Glassnode, that reveals how the various levels around the current spot value of BTC are looking like right now based on the density of supply that was last bought at them.

The URPD here is “ATH partitioned,” which means that the price ranges here are defined by dividing the levels between zero and the current all-time high (ATH) into 100 equal partitions.
From the chart, it’s visible that the partition around the ,990 level carries the cost basis of a notable amount of the supply right now (1.3%). This also happens to be the range BTC is retesting at the moment.
Generally, the cost basis is a special level for investors, and thus, they tend to be more likely to show some reaction when a retest takes place. If a large number of holders share their cost basis inside the same narrow range, then this reaction may result in a scale that could be relevant for the market.
As for what direction this reaction from the holders would be probable to happen depends on the side the retest is happening from. A retest from under (meaning that these holders had been in loss prior to the retest) could lead to a selling reaction in the market.
This is because these investors may not want to risk the cryptocurrency declining again in the future, so exiting while they have the opportunity to at their break-even might be tempting.
As such, retests like these can lead to the asset feeling some degree of resistance. In the current case, the range is notably filled up with coins, so it’s possible that the strength of this resistance would be just as powerful.
From the chart, it’s visible that after this range, the asset potentially faces no strong on-chain resistance barriers until the ,879 level, which hosts the cost basis of about 1.61% of the supply. “If Bitcoin can break past ,990, it will likely rise toward ,880!” says Ali.
BTC Price
Bitcoin has been climbing up in the past day, with its price now reaching the ,200 level. Should this surge be sustained, the asset would be through the current resistance block.
Runestone NFTs Lead the Charge in Multi-Chain Marketplace Sales
 According to the latest data, the Runestone non-fungible token (NFT) compilation has emerged as the leading NFT collection across various multi-chain support marketplaces. As of now, a Runestone NFT’s base price fluctuates between 0.047 and 0.048 bitcoin, which translates to approximately ,163 based on the current bitcoin exchange rates. Runestone NFT Collection Achieves Top Spot […]
Bitcoin News
This Bitcoin Indicator Has Hit Levels That Often Lead To Corrections
On-chain data shows a Bitcoin metric has recently hit levels that have historically led to corrections in the cryptocurrency’s price.
Bitcoin Is Currently 40% Above The Cost Basis Of Short-Term Holders
CryptoQuant Netherlands community manager Maartunn explained in a post on X that the BTC price is currently 40% above the cost basis of the short-term holders.
The indicator of interest here is the “Market Value to Realized Value (MVRV) ratio,” which is an indicator that keeps track of the ratio between the Bitcoin market cap and the realized cap.
The “realized cap” refers to a capitalization model for the asset that assumes that the real value of any coin in circulation isn’t equal to the current spot price but rather the price when it was last transacted on the blockchain.
The previous transfer of any coin was likely the last point at which it changed hands, so the price at that time would act as its current cost basis. As such, the realized cap is essentially the sum of the cost basis of the entire supply.
Therefore, the metric’s value can measure the total capital the holders have put into the asset. And since the market cap is the value they are currently carrying, its comparison against the realized cap in the MVRV ratio can tell us about the amount of profits or losses the investors hold.
In the current discussion, the MVRV ratio of the entire market isn’t of interest but rather of a particular segment of it: the “short-term holders” (STHs). The STH cohort includes all investors who bought their coins within the past 155 days.
The below chart shows the trend in the Bitcoin MVRV ratio specifically for these investors over the history of the cryptocurrency:
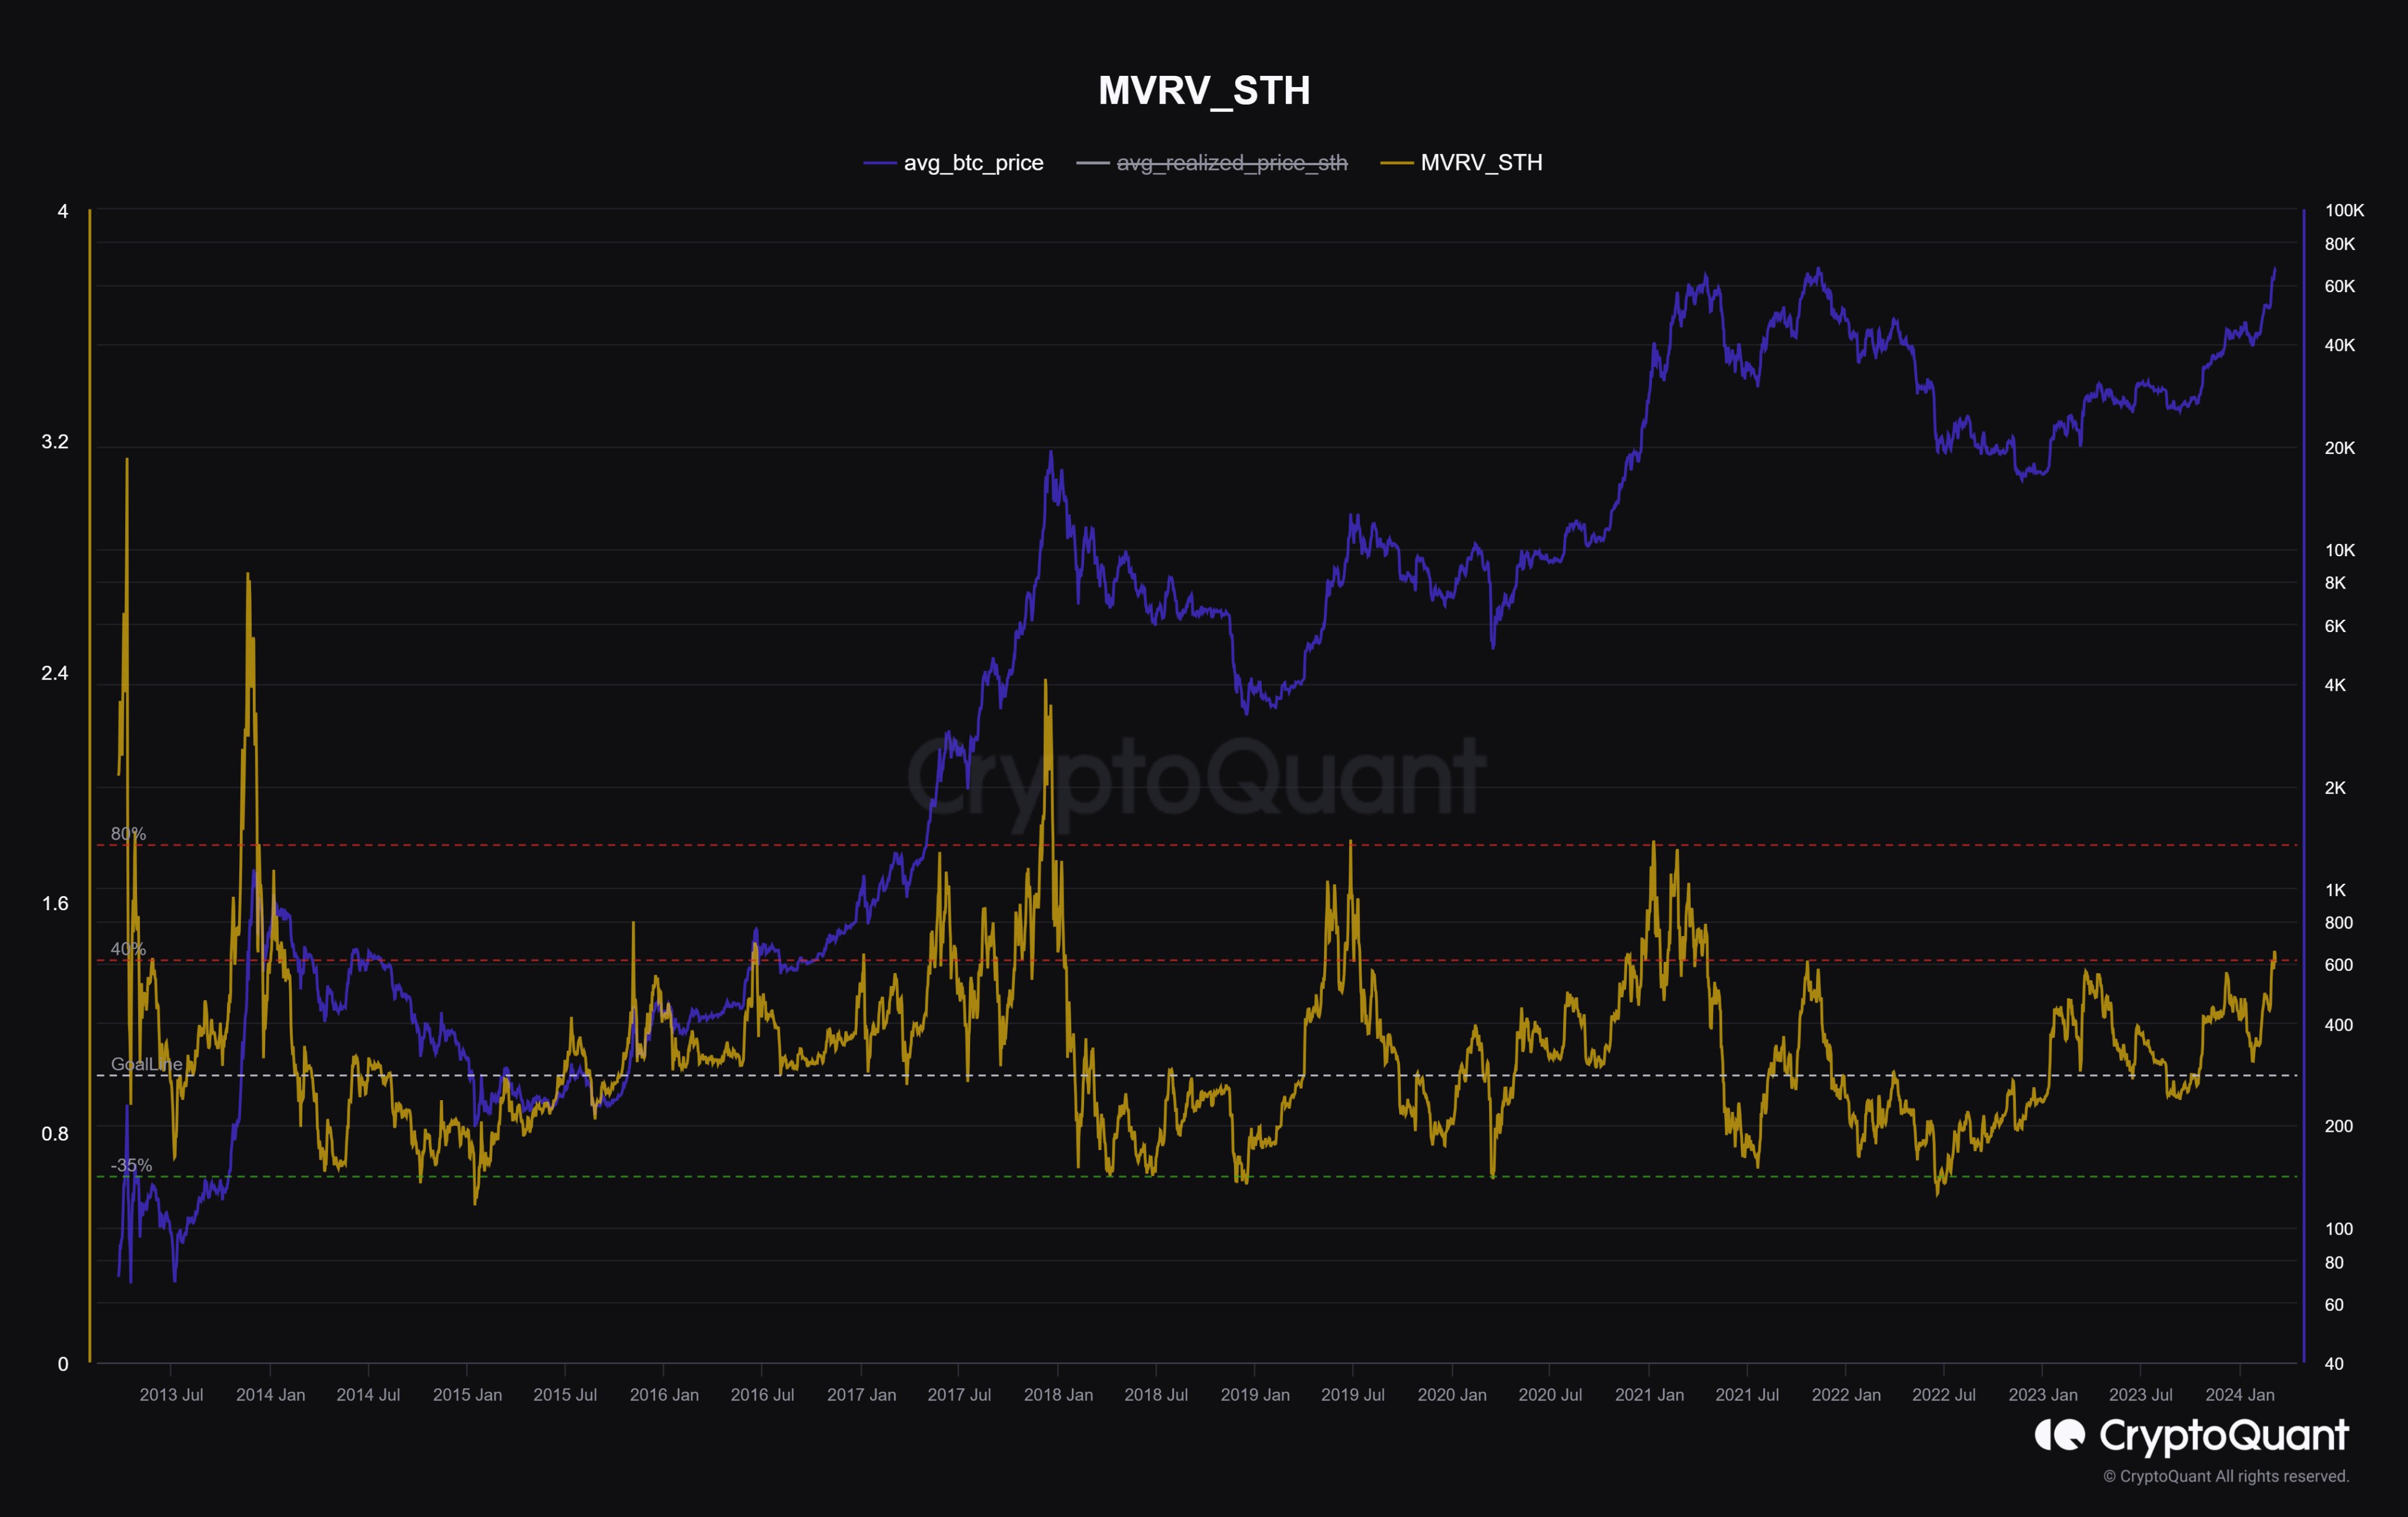
As displayed in the above graph, the Bitcoin STH MVRV has been greater than 1 for a while now as the STHs have been carrying net profits, but with the latest rally in the asset, the indicator has shot up to especially high levels.
The BTC spot price has recently been 40% over this cohort’s average cost basis. The chart shows that this same level has led to asset corrections a few times in the past.
Naturally, this doesn’t mean that the coin would necessarily see a correction here, but given the historical pattern, there is a chance one would occur.
The likely reason behind this pattern is that Bitcoin investors are more likely to give in to the allure of profit-taking the larger their profits grow.
BTC Price
Bitcoin has gone through some significant volatility since setting its brand new all-time high above the ,000 level, with its price now trading around ,700.
Shiba Inu Lead Dev Co-Signs Prediction That Would Send SHIB To $100 Billion
Shiba Inu saw a massive rally over the past month, going from below .00001 to above .00004, just 50% below its all-time high price. This has strengthened bullish resolve among investors in SHIB as crypto analysts continue to call for higher prices, one of which has been co-signed by Shiba Inu lead developer Shytoshi Kusama.
Shiba Inu Market Cap Headed For 0 Billion
In a post on X (formerly Twitter), crypto analyst Jake Gagain made a very bullish prediction for the Shiba Inu price. According to him, the meme coin could see its market cap rise as high as 0 billion in the bull market. “$SHIB Will Reach 100 Billion This Cycle,” the post read.
Related Reading: Institutions Can’t Get Enough Of Crypto As Trading Volumes Hit New Billion Record
This prediction caught the attention of Shiba Inu’s lead developer, Shytoshi Kusama, who took to the social media platform to lend his support. The quote response featured a GIF which said, “Your words, not mine,” something that is often used to support a statement by another person.
https://t.co/aUePEauoUo pic.twitter.com/vp0gk4FDtv
— Shytoshi Kusama
(@ShytoshiKusama) March 5, 2024
Gagain’s prediction is interesting because it would mean that the market cap of SHIB would be three times higher than what it was during its last all-time high. If it does come to fruition, then the SHIB price at this high market cap would see it climb above .0002.
Reaching this price point would mean that the price of SHIB would have to climb another 500% from its current value of .000037.
SHIB At .0001 Is Possible
Gagain is not the only crypto analyst who sees the price of Shiba Inu eventually crossing the .0001 level. Another analyst, Oscar Ramos, recently shared their own bullish prediction for the SHIB price, which he believes would cross .0001.
As Ramos explains, some of the facts that will drive this rally will be retail investors as they flock back into the market. This influx of funds, the analyst explains, could send the SHIB price above .0001. Additionally, Ramos points to the previous performance of SHIB as evidence of how much the price can grow in a short time. For Ramos, SHIB at .0001 is a certainty this cycle.
However, despite being bullish on the Shiba Inu price, the crypto analyst also reeled in unrealistic expectations for the price. He explains that the meme coin rising to .1 or even is not possible in this bull market. For now, the cryptocurrency has to focus on reaching a billion market cap, which would help it cross .0001.
As for when to sell, the analyst cautions that investors should be looking to exit their position at around the .0002 mark, as this could mark the peak.
Bitcoin MVRV Hits Levels That Lead To Parabolic Bull Run In 2020
On-chain data shows the Bitcoin MVRV ratio is currently at the same high levels as those that led to the parabolic bull run back in 2020.
Bitcoin MVRV Ratio Has Shot Up As Latest Rally Has Occurred
As pointed out by CryptoQuant founder and CEO Ki Young Ju in a post on X, the MVRV ratio has just hit a value of 2.5. The “Market Value to Realized Value (MVRV) ratio” is a popular on-chain indicator that keeps track of the ratio between the Bitcoin market cap and the realized cap.
The “realized cap” here refers to a capitalization model for BTC that assumes that the real value of any token in circulation is not its current spot price (as the market cap takes it to be), but rather the value at which the coin was last transferred on the network.
The previous transaction for any coin may be considered the last time it changed hands, which implies that the price at the time would be its current cost basis. As such, the realized cap adds up the cost basis of every token in circulation.
This means that the realized cap essentially keeps track of the total amount of capital that the investors have used to purchase their Bitcoin. Since the MVRV ratio compares the market cap (that is, the value the investors are holding right now) against this initial investment, its value can tell us about the amount of profit or loss the investors as a whole are currently carrying.
Now, here is a chart that shows the trend in the Bitcoin MVRV ratio over the history of the cryptocurrency:
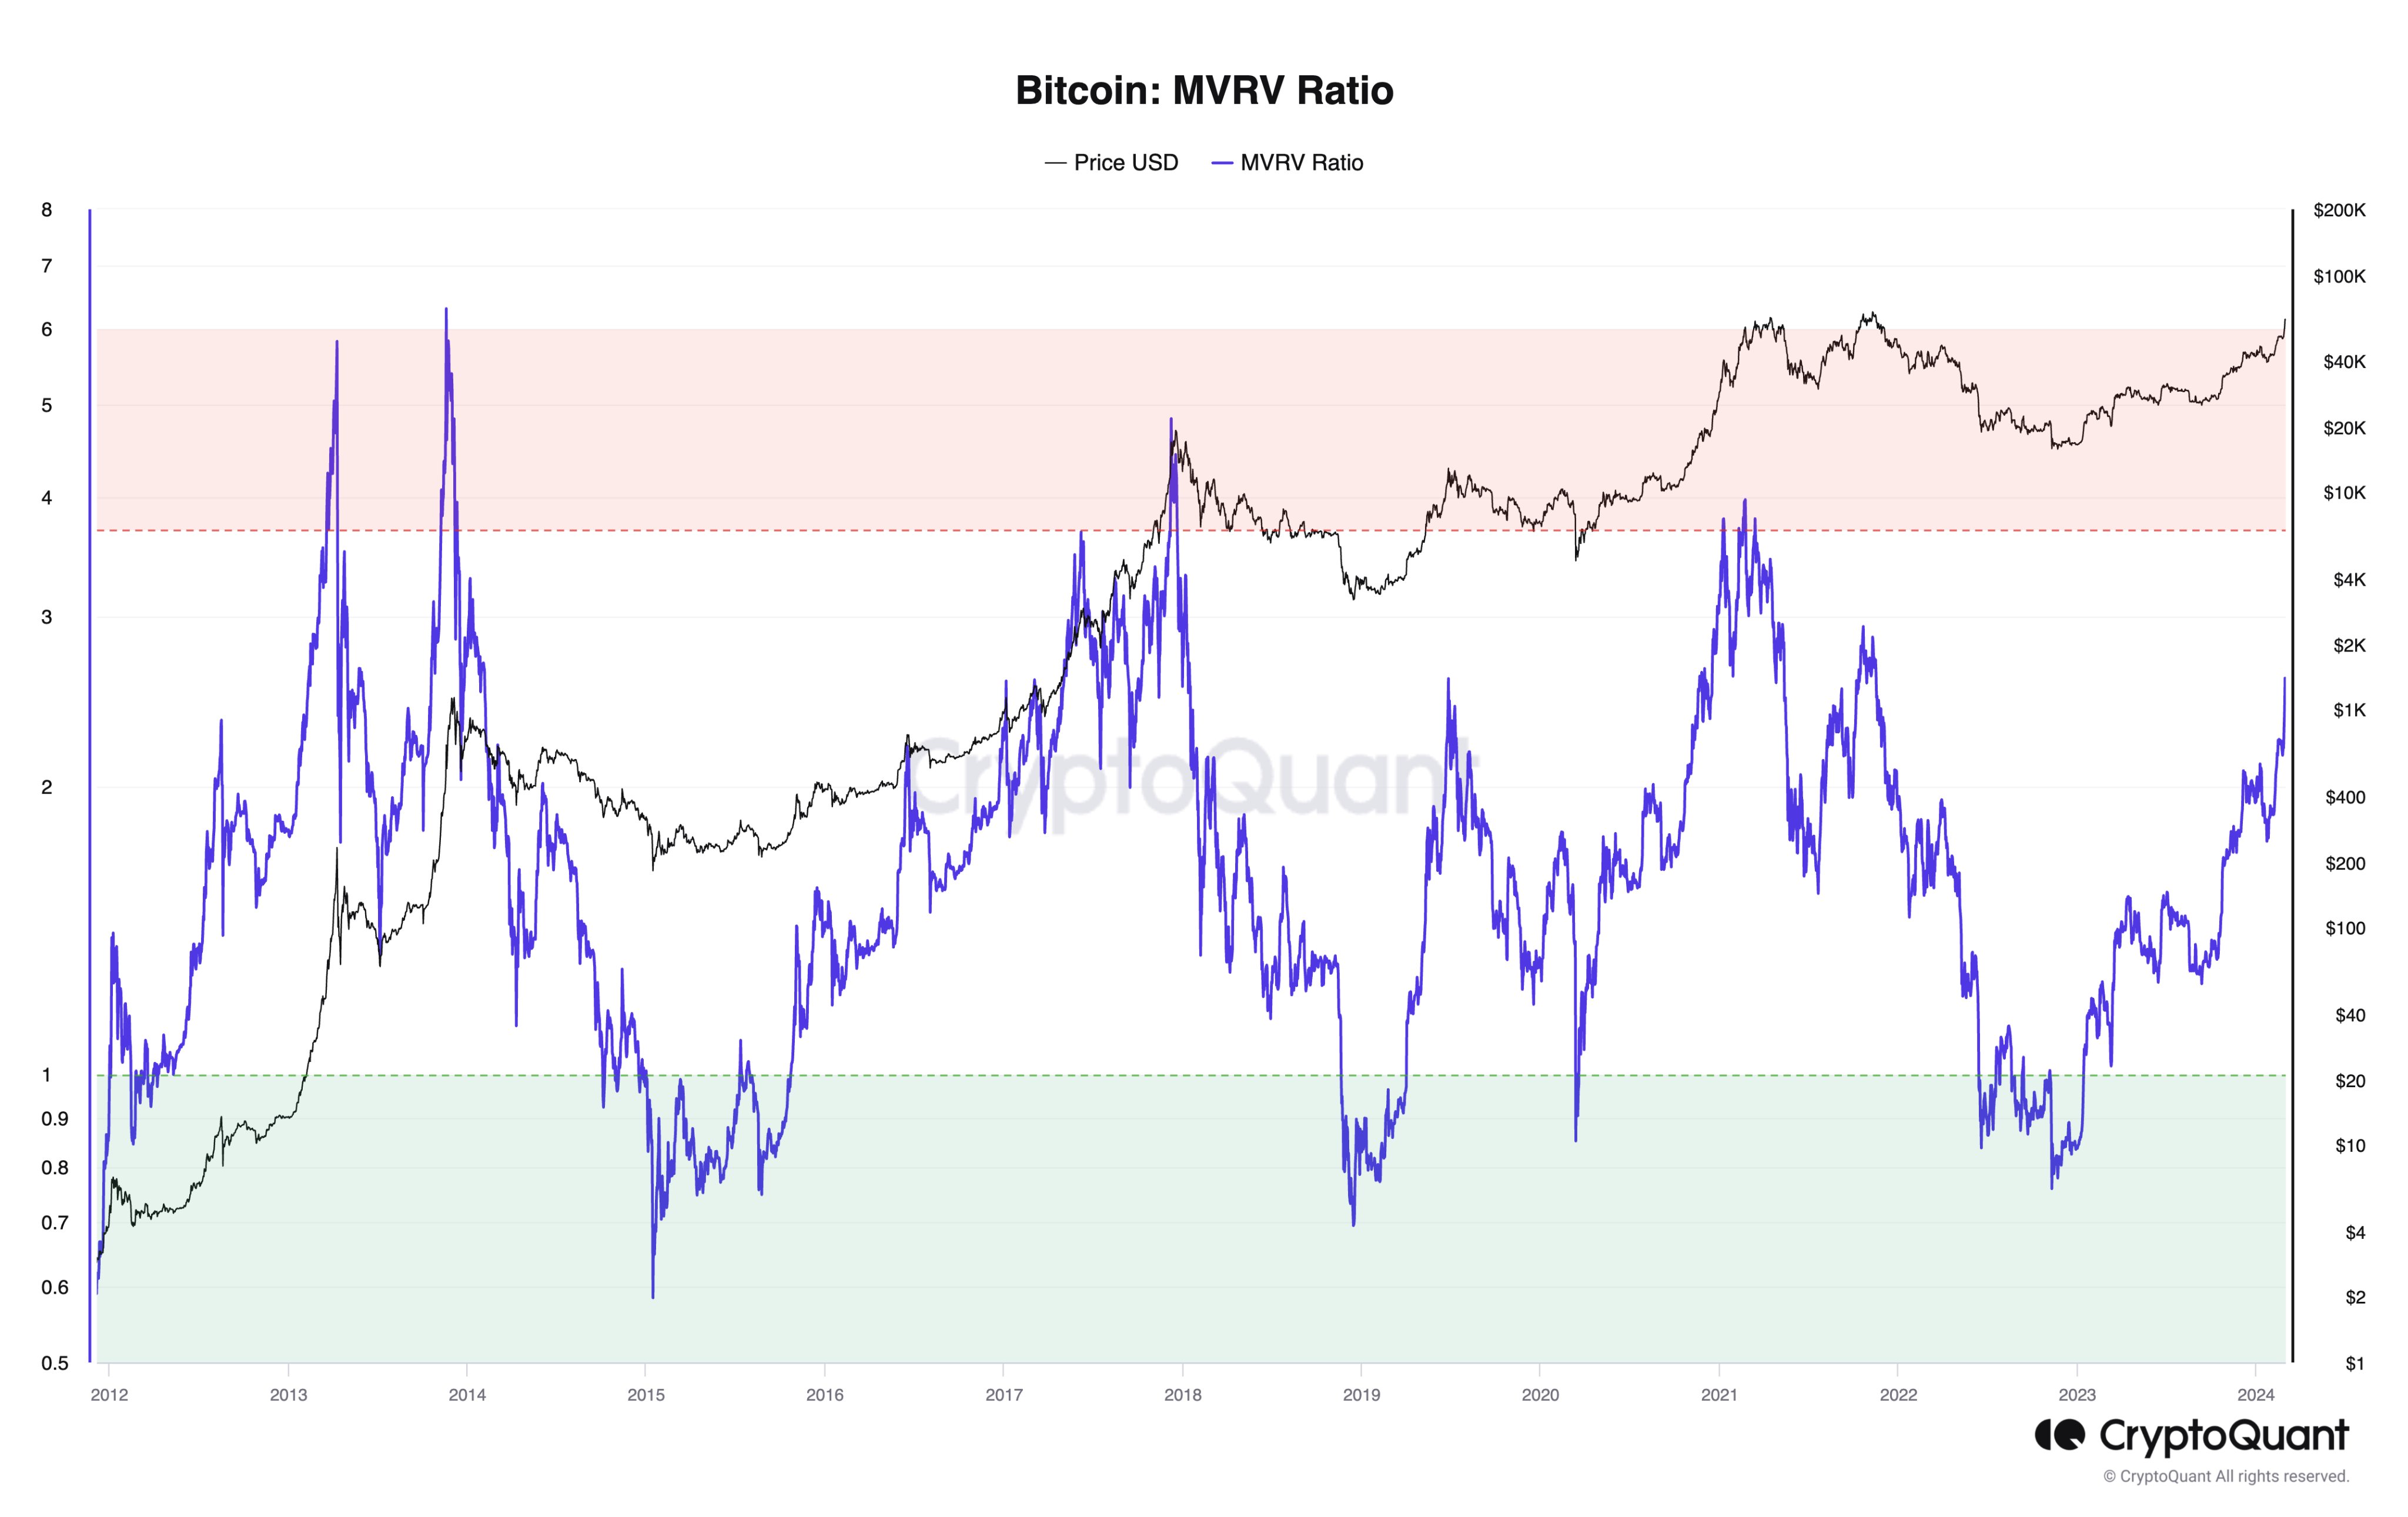
As is visible in the graph, the Bitcoin MVRV ratio has rapidly climbed up as the asset’s price has gone through its latest rally. In this surge, the metric has managed to exceed the 2.5 level.
When the ratio is greater than 1, it means that the market cap is higher than the realized cap right now, and thus, the overall market is holding its coins at some profit. A value of 2.5 implies the average wallet is currently carrying gains of 150%.
“In Nov 2020, MVRV was 2.5 at K, preceding the all-time high and parabolic bull run,” explains Ju. Back in that bull run, the peak of the first half of 2021 wasn’t hit until the MVRV ratio crossed the 3.7 mark, just like the two bull runs preceding it.
The top in November 2021, however, didn’t follow this pattern, as it formed close to the 3.0 level. It now remains to be seen which path Bitcoin would take in its current rally, if it is at all similar to either of these.
BTC Price
Following Bitcoin’s impressive 22% rally over the past week, the asset’s price is now trading around the ,800 level, not very far from setting a new all-time high now.
Where Are We In This Bitcoin Cycle? Galaxy Lead Researcher Answers
In a comprehensive analysis shared via X (formerly Twitter), Alex Thorn, the Head of Firmwide Research at Galaxy, delved into the intricacies of the current Bitcoin market cycle, answering the question “Where Are We In This Bitcoin Cycle?” As Bitcoin trades robustly around ,000, with a notable spike to .000 yesterday, the crypto landscape is witnessing unprecedented dynamics, marked by a surge in ETF inflows, strategic acquisitions by corporate entities, and a palpable shift in investor sentiment towards digital assets.
Thorn emphasized how different this cycle is:
Effectively, the bull runs of 2017 and 2020 hadn’t yet begun at this stage in Bitcoin’s supply schedule.
52 days before 2nd Halving (9-JUL-16) BTCUSD 5.22 (-59.86% from ATH)
52 days before 3rd Halving (11-MAY-20) BTCUSD ,174 (-68.56% from ATH)
52 days before 4th Halving (20-APR-24) BTCUSD ,330 (-12.16% from ATH)
Why This Bitcoin Cycle Is Different
Central to his analysis is the record-breaking influx of capital into spot Bitcoin ETFs, with Thorn highlighting, “The BTC ETFs took in a whopping net 6m of BTC yesterday (Tuesday Feb. 27), with BlackRock alone seeing 0m of inflows, its largest ever day.” This significant movement of funds not only underscores the growing institutional interest in Bitcoin but also marks a pivotal moment in the cryptocurrency’s journey towards mainstream financial recognition.
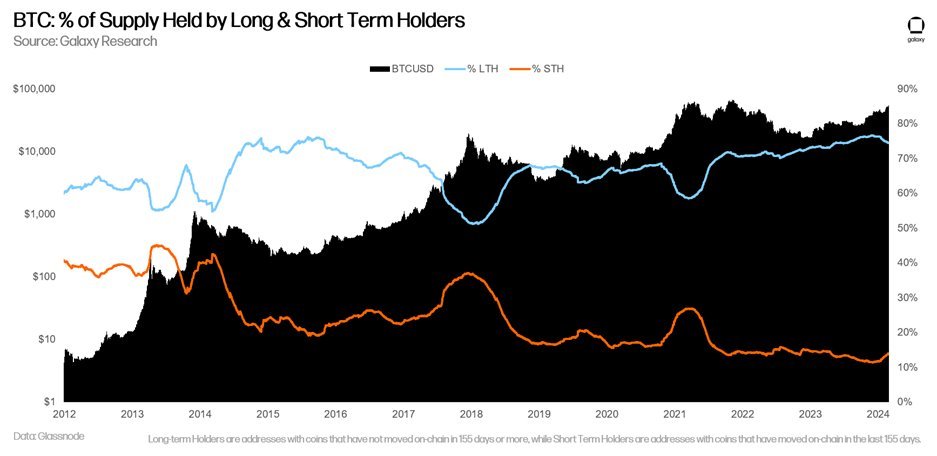
A key aspect of Thorn’s analysis is the unwavering strength of Bitcoin’s long-term holder base, which he estimates to hold about 75% of the total BTC supply. “Long-term holders are still mostly holding strong,” Thorn notes, emphasizing the community’s resilience and faith in Bitcoin’s long-term value proposition. This demographic, characterized by their ‘diamond hands’, plays a crucial role in stabilizing the market and buffering against the volatility that often defines the crypto space.
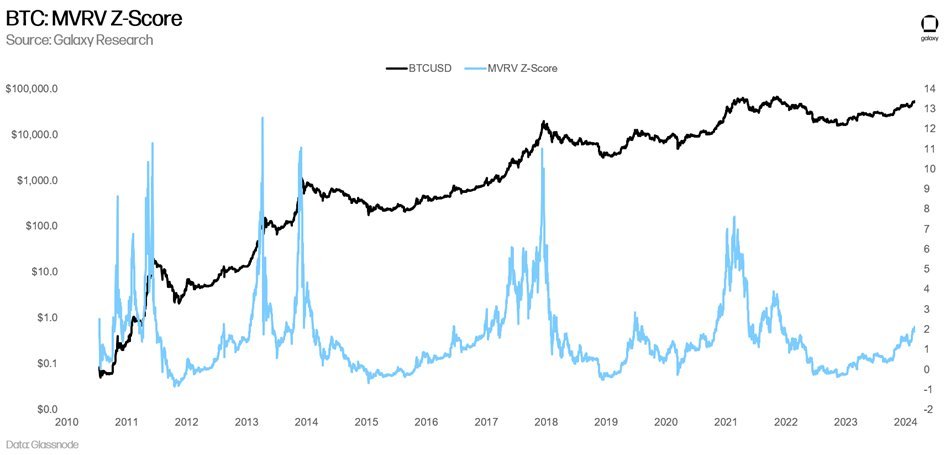
Thorn further elaborates on the analytical tools and metrics that provide insight into Bitcoin’s market behavior. He introduces the MVRV Z-Score, a novel approach to understanding the cyclicality of Bitcoin’s price action by comparing its market value to its realized value. This metric offers a window into the perceived overvaluation or undervaluation of Bitcoin at any given point. Currently, the MVRV Z-Score is close to 2, while previous cycle tops saw the metric spike to 8 (in 2021) or even above 12 (in prior halving cycles).
Addressing the speculation around the acceleration of the Bitcoin cycle, Thorn firmly dispels concerns that the market is prematurely peaking. He argues against the notion that we are “speedrunning the ‘cycle’”, instead asserting that the advent of Bitcoin ETFs in the United States represents a transformative shift with far-reaching implications. “This time is different,” Thorn asserts, pointing to the ETFs’ disruption of traditional Bitcoin price cycles and their impact on investor behavior and intra-crypto dynamics.
The Spot Bitcoin ETF Effect
Thorn underscored the transformative impact of Bitcoin ETFs, positing that we are merely at the beginning of a significant shift in how Bitcoin is accessed and invested in, particularly by the institutional sector. “Despite incredible volumes and flows, there’s plenty of reason to believe that the Bitcoin ETF story is still just getting started,” he stated, pointing to the untapped potential within the wealth management sector.
In their October 2023 report titled “Sizing the Market for the Bitcoin ETF,” Galaxy laid out a compelling case for the future growth of Bitcoin ETFs. The report highlights that wealth managers and financial advisors represent the primary net new accessible market for these vehicles, offering a previously unavailable avenue for allocating client capital to BTC exposure.
The magnitude of this untapped market is substantial. According to Galaxy’s research, there is approximately trillion of assets under management (AUM) across banks and broker/dealers that has yet to activate access to spot BTC ETFs. This includes .1 trillion managed by broker-dealers, .9 trillion by banks, and .3 trillion by registered investment advisors, cumulating to a total US Wealth Management AUM of .3 trillion as of October 2023. This data underscores the vast potential for Bitcoin ETFs to penetrate deeper into the financial ecosystem, catalyzing a new wave of investment flows into Bitcoin.
Thorn further speculated on the upcoming April round of post-ETF-launch 13F filings, suggesting that these filings might reveal significant Bitcoin allocations by some of the largest names in the investment world. “In April, we will also get the first round of post-ETF-launch 13F filings, and (I’m just guessing here…) we are likely to see some huge names have allocated to Bitcoin,” Thorn anticipated. This development, he argues, could create a feedback loop where new platforms and investments drive higher prices, which in turn attracts more investment.
The implications of this feedback loop are profound. As more wealth management platforms begin to offer access to Bitcoin ETFs, the influx of new capital could significantly impact BTC’s price dynamics, liquidity, and overall market structure. This transition represents a key moment in the maturation of Bitcoin as an asset class, moving from a speculative investment to a staple in diversified portfolios managed by financial advisors and wealth managers.
We Are Still Early
Thorn’s optimism extends beyond the immediate market indicators to the broader implications of Bitcoin’s integration into the financial mainstream. He anticipates a new all-time high for Bitcoin in the near term, fueled by a combination of factors including the ETFs’ momentum, increasing acceptance of BTC as a legitimate asset class, and the anticipatory buzz surrounding the upcoming halving event. “All this is to say, my answer to that burning question – where are we in the cycle? – is that we haven’t even begun to reach the heights this is likely to go,” he concludes.
Thorn’s analysis culminates in a bullish forecast for Bitcoin. As the community stands on the cusp of the fourth BTC halving, Thorn’s insights offer a compelling vision of a market poised for unprecedented growth, driven by a confluence of technological innovation, regulatory evolution, and shifting global economic currents. “Bitcoin is prime time now, and while it might be hard to believe, things are just starting to get exciting,” Thorn declares, capturing the essence of a market at the threshold of a new era.
At press time, BTC traded at ,065.
Arweave and Aptos Lead Crypto Market Surge With Stellar Gains as BTC Nears All-Time High
 Bitcoin experienced a 6.8% increase on Wednesday, reaching a peak of ,000. This upturn also propelled several other digital assets upwards, notably arweave (AR) with a 50.3% increase and aptos (APT) with a 23.5% appreciation against the U.S. dollar. AR, APT, FET, DOGE, PEPE, and ORDI Post Impressive Gains Amidst Crypto Upswing As of 2 […]
Bitcoin News
Who Let The DOGE Out? Dog-Themed Coins Soar By 12%, WIF And FLOKI Lead The Way
The crypto market seems to be going nowhere but up. Bitcoin nears ,000, Ether has been surfing above the ,000 wave for four days, currently sitting at the ,330 level, and the rest of the market continues to gain momentum.
Significant developments and a strong bullish sentiment have built up over the past couple of months, and as a result, the top gainers during this bull run are coming from every sector of the market. This is the case of Dog-themed coins, which currently sit among the cryptocurrencies with the best performance over the last few days.
Dog-Themed Coins Are Soaring
Dog-inspired cryptocurrencies are some of the most popular coins among the crypto community. The trend started with the popular internet doge meme and has inspired some of the most recognizable memecoins in the market.
The largest by market capitalization in this category, Dogecoin, currently stays out of the top ten cryptocurrencies by this metric. However, it has remained close to the top with its 11th place.
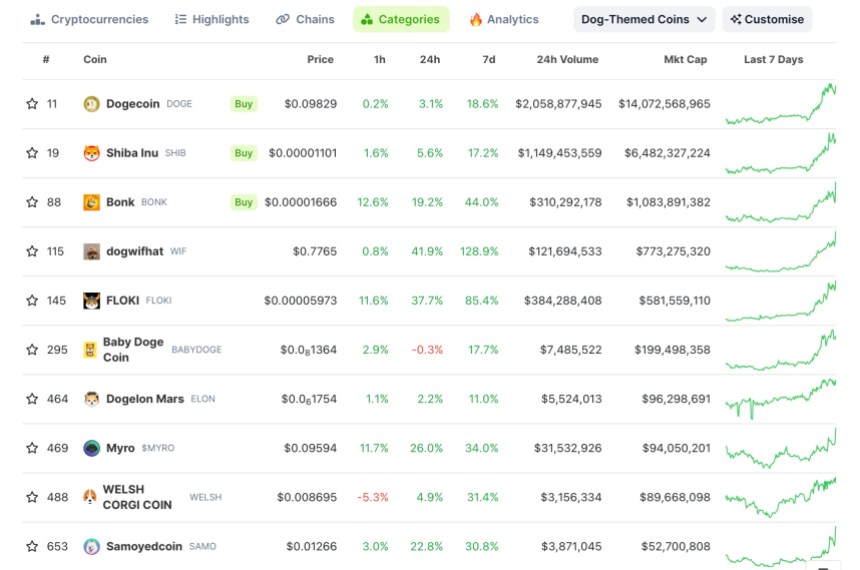
The Dog-themed market cap has shown a 12.8% growth in the last 24 hours, as CoinGecko data shows. The sector’s market capitalization sits at an impressive .8 billion, and the dog-based coins trading volume reached over .25 billion in the last 24 hours.
The chart above shows that the top ten dog-inspired cryptocurrencies display positive performance, with green numbers all over the board in the last 7 days.
Impressive Performance From WIF, FLOKI And More
Dogecoin, Shiba Inu, and Bonk lead the dog-inspired market. However, none of these tokens are among the top five gainers on the last day or week.
At writing time, the coins that have seen the best performance in this category include dogwifhat (WIF), FLOKI (FLOKI), Samoyedcoin (SAMO), Myro (MYRO), and Chihuahua Chain (HUAHUA). Let’s take a look at the 3 top gainers:
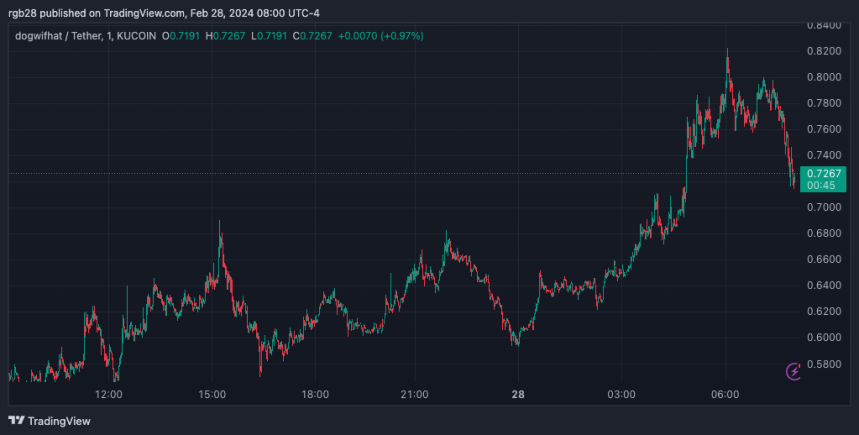
Dogwifhat (WIF)
WIF’s price jumped 41.9% during the last day and now trades at .7765. Earlier today, the coin’s price recorded a new all-time high (ATH) after reaching .79.
Just last week, a crypto analyst predicted that the price of WIF was about to go “turbo parabolic” and possibly reach . Fans of the project have shown their excitement by suggesting that investors “keep their hats on” during this leg of the rally.
Dogwifhat’s daily trading volume of 3.5 million represents a 34.30% increase from one day ago. This hints at a recent rise in “hats being put on” after the token has shown an impressive 117.8% and 137.8% price jump in the last 7 and 30 days, respectively.
FLOKI
As previously reported, FLOKI has been soaring after DWF Labs announced its plans to strengthen its partnership with the project. The digital assets investment firm will purchase million worth of FLOKI tokens directly from the project’s treasury over two years.
Since then, the token’s price has risen 37.7% in the last 24 hours. Currently trading at .00005973, FLOKI has maintained its gains over the week with an 85.4% price increase. Additionally, its performance recorded a 100.1% jump in the 30-day time frame.
According to CoinGecko data, FLOKI is outperforming the global crypto market with its performance in the last week. Similarly, it has increased its trading volume by 116.6% in 24 hours, with over 2 million.
Chihuahua Chain
Chihuahua Chain surprised the crypto community after becoming one of the largest global earners on the last day. Members of the ‘HUAHUA Army’ speculated if the token would break out of the downtrend seen after the token’s massive pump in December.
HUAHUA experienced a massive 48.4% price jump in the last 24 hours. The token went from its .00018 price to trade at .0003411. Its daily trading volume massively increased by 140.4% and currently sits at .017 million. This performance has been sustained over the last month, as the token’s price has grown 50.3%.
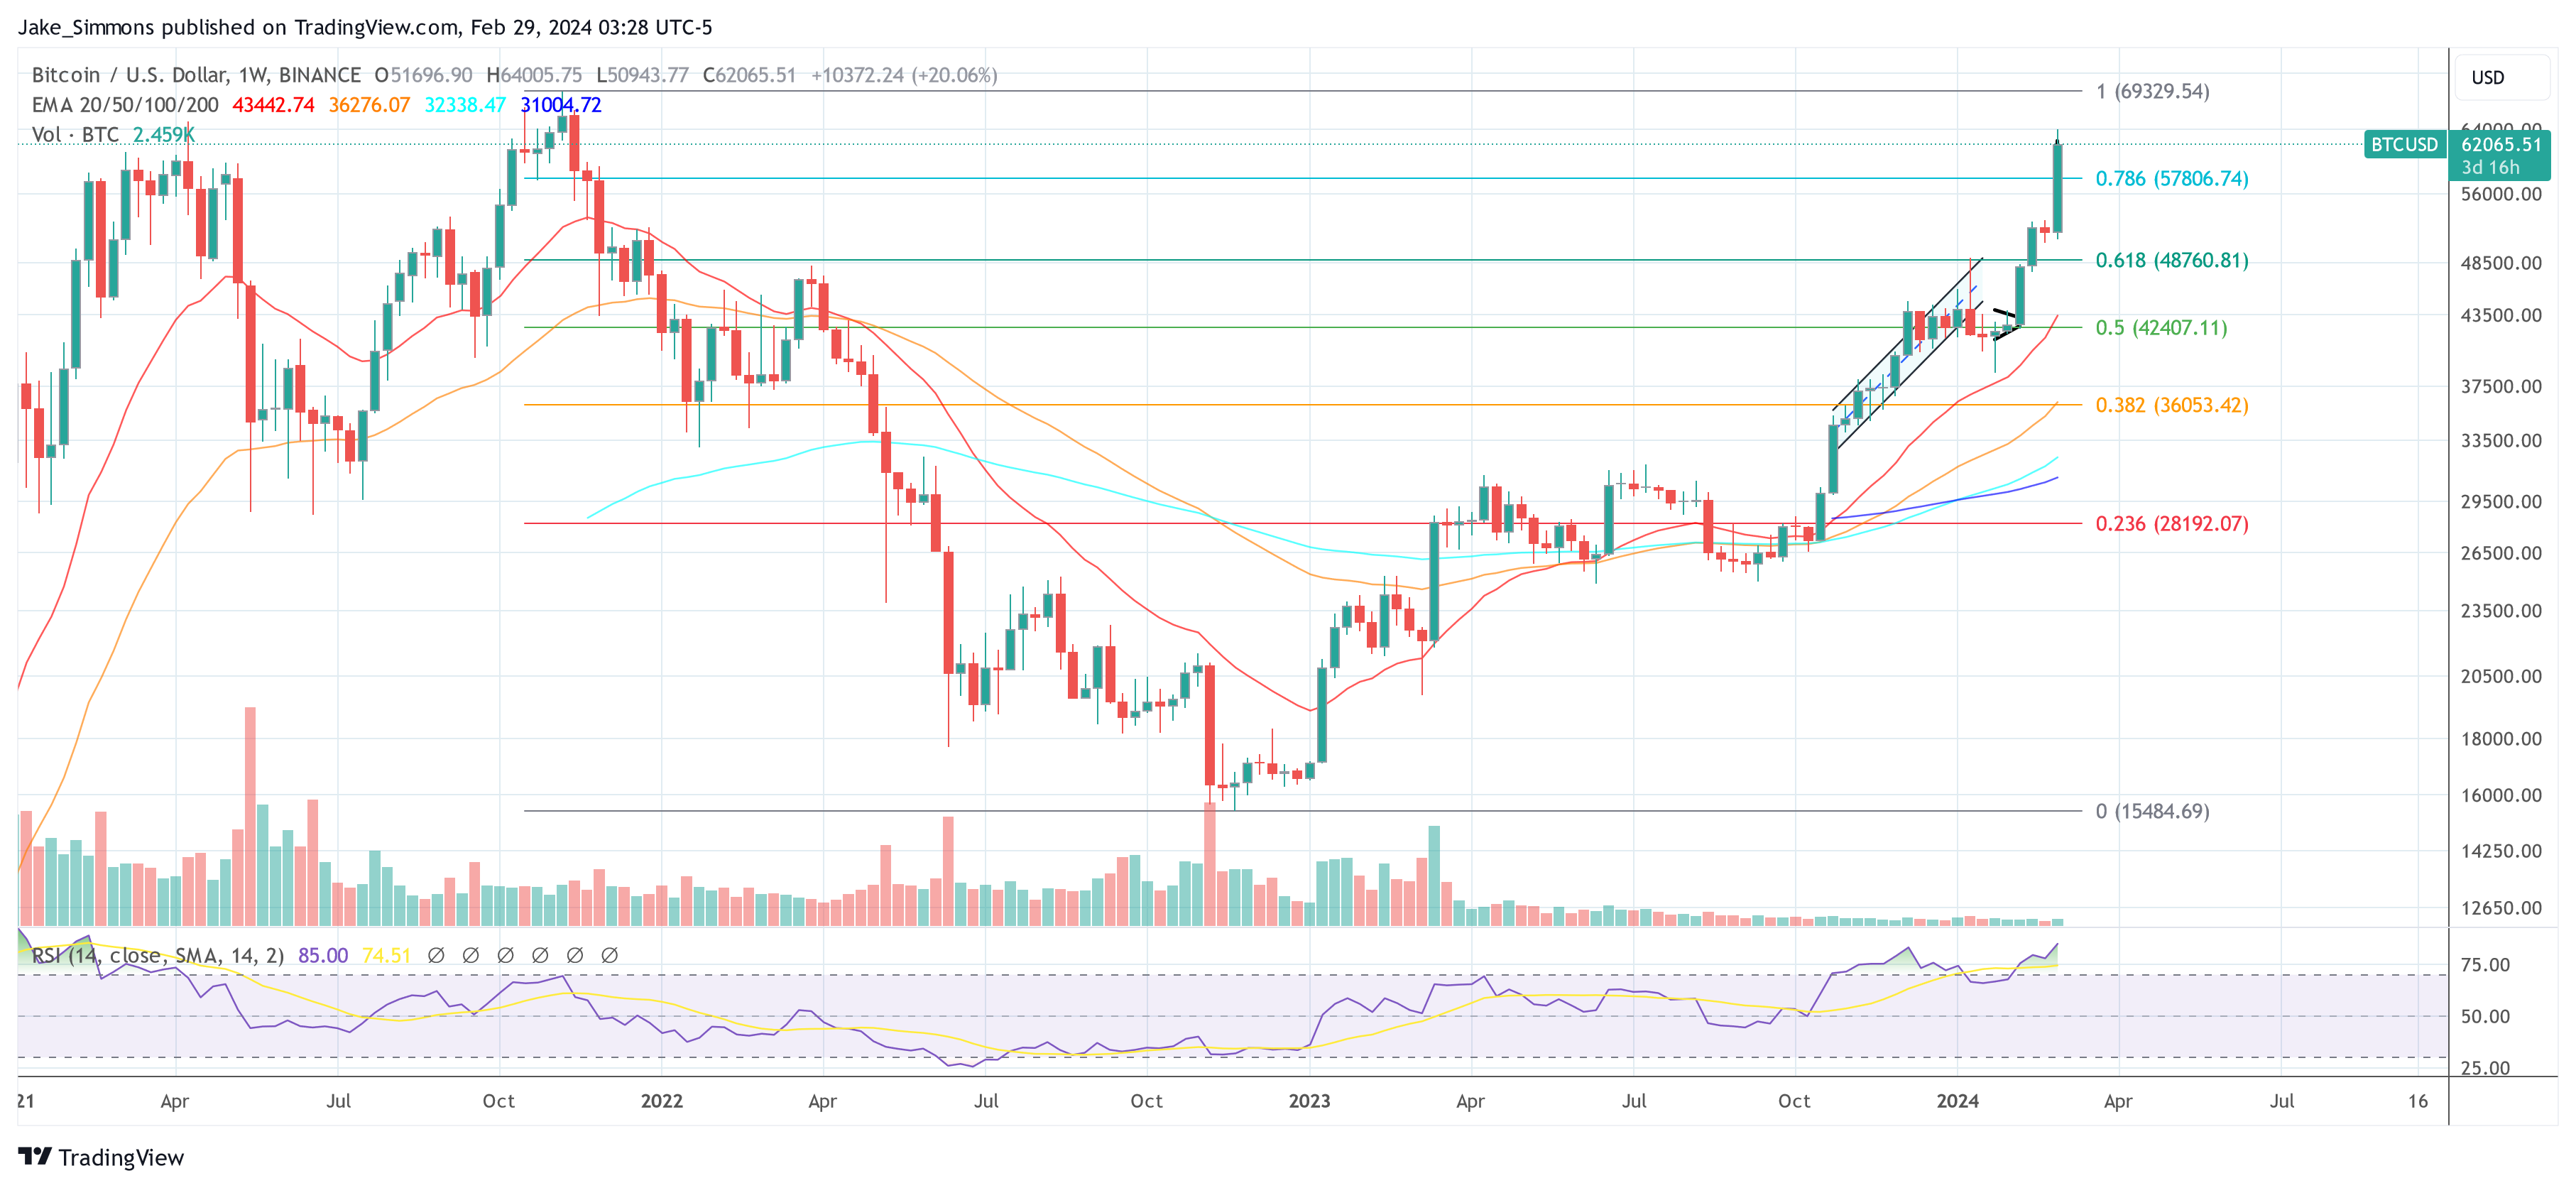
Ethereum Breaks Back Above $3,000, Will FOMO Lead To Top Again?
Ethereum has once again broken above the ,000 level after previous attempts ended in failure as FOMO took over the investors.
Ethereum Has Rallied 3% In Past Day To Break Back Above ,000
Earlier, Ethereum had made two attempts at the ,000 level, but both of them had turned out to be brief as the asset quickly retraced back to lower levels. In the past day, ETH has once again made a push towards the mark, as the chart below shows.
In this latest surge, ETH has seen a sharp recovery of more than 3% from around the ,900 mark to the current levels. The coin is now up 8% in the past week, making it the second-best performer among the top 10 cryptocurrencies, just behind BNB’s 10% profits.
From the graph, it’s visible that Ethereum is now within touching distance of setting a new high for the year. But ETH investors would be wondering if this rally would sustain or if it would end up losing steam, just like the previous ones. If data is anything to go by, market sentiment may have been the reason behind the demise of the last surges.
ETH’s Previous Surges Topped Out As FOMO Took Over Traders
According to data from the analytics firm Santiment, the latest top above ,000 occurred as the crowd euphoria spiked. The indicator of interest here is the “Social Volume,” which keeps track of the total amount of discussion that social media users are participating in around a given term or topic.
The metric calculates this value by counting up the number of posts/threads/messages across the major social media platforms that are making at least one mention of the topic.
The below chart shows the data of the Social Volume related to two Ethereum topics:
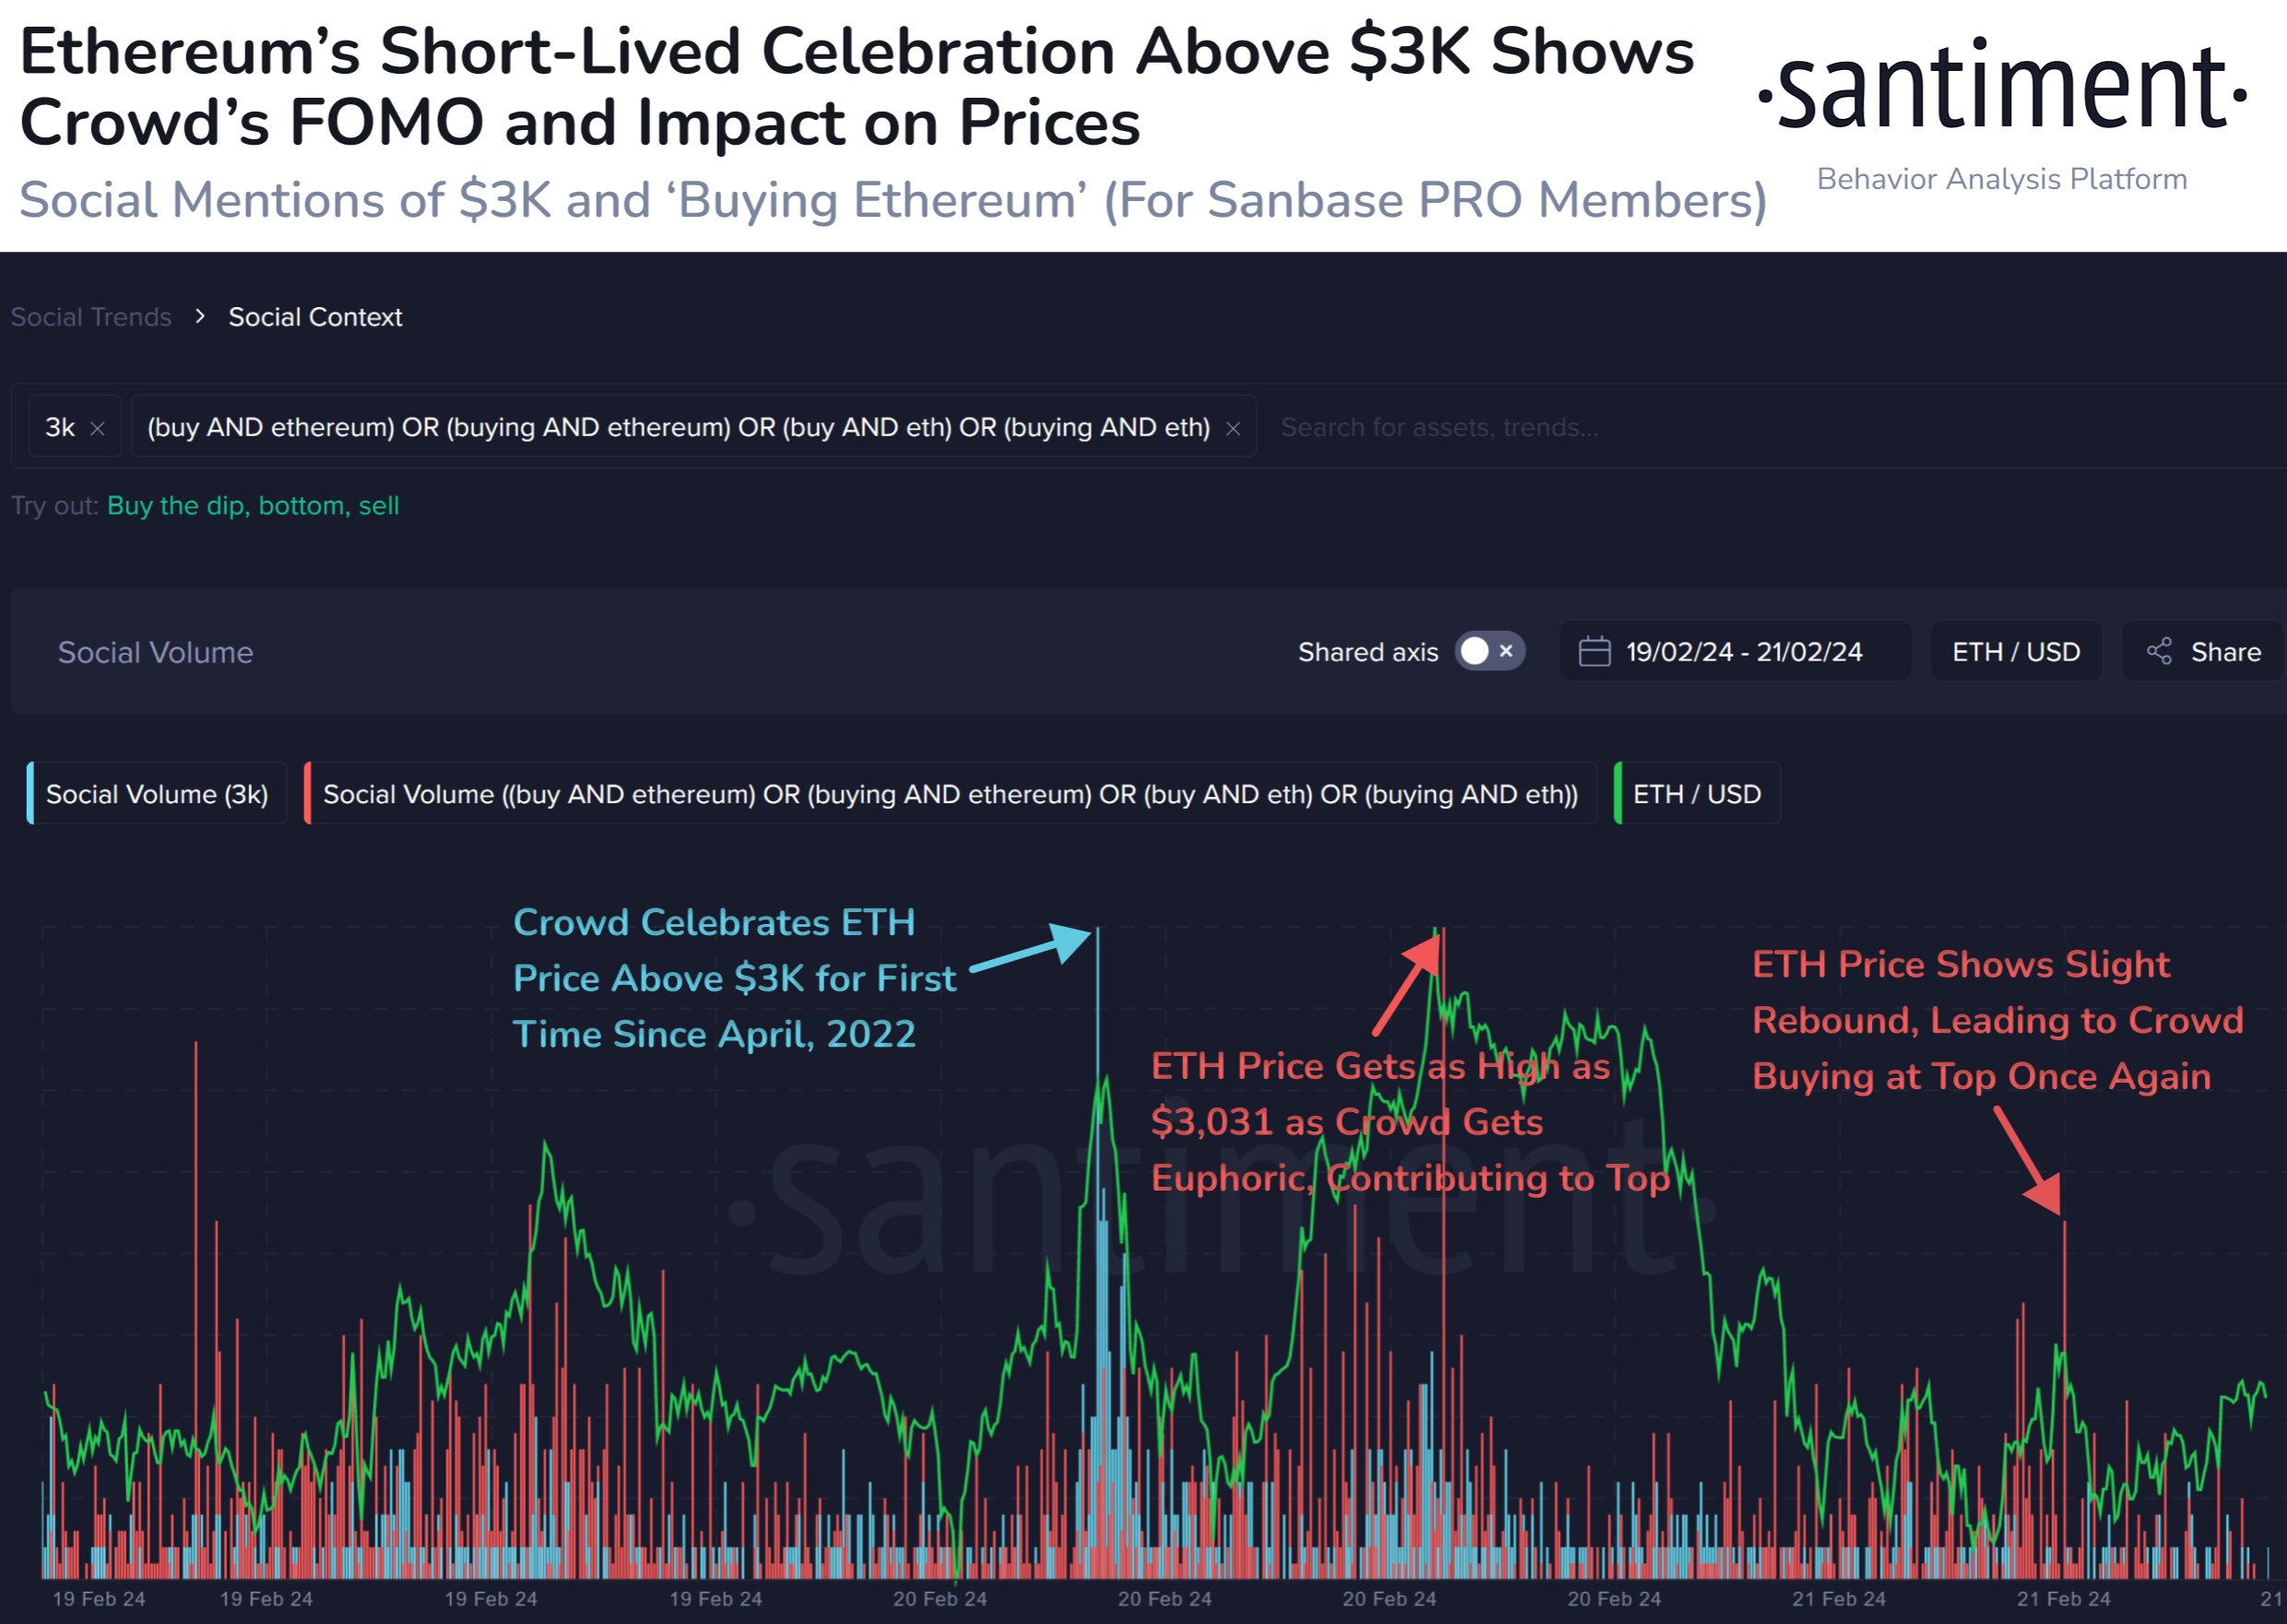
The first Social Volume here has been filtered for ,000. As is visible in the graph, this metric spiked as ETH broke above ,000 for the first time since April 2022 a couple of days back.
This would suggest that discussions around the topic had spiked high as traders had celebrated the break. As it had turned out, though, the surge was pretty short-lived.
In the second attempt, the Social Volume related to terms like “buy Ethereum” had registered a large spike, implying that FOMO had developed among the traders.
Historically, FOMO has been something that has made tops likely, as ETH’s price has tended to go contrary to the expectations of the crowd. This is likely the reason why the top coincided with this spike.
A similar phenomenon occurred with the small recovery surge observed yesterday, as Santiment has highlighted in the chart. It would seem that greed had once again led to the coin topping out.
It now remains to be seen how the market reacts to the latest rally above ,000. If FOMO around Ethereum once again spikes on social media, then it may very well be a sign that this surge, too, may only be temporary.