 Salim Ramji, the new CEO of Vanguard and former head of Blackrock’s global ETF business, has affirmed the company’s position against launching a spot bitcoin exchange-traded fund (ETF), emphasizing the need for consistency with Vanguard’s investment philosophy that views crypto as a speculative and immature asset class. Despite Ramji’s prior involvement in launching Blackrock’s successful […]
Bitcoin News
Bitcoin Breaks Free: Emerging from Bearish Sentiment, Crypto Market Optimism Rises
Bitcoin price is up nearly 8% and it broke many hurdles. BTC is now consolidating gains and might correct in the short term toward ,000.
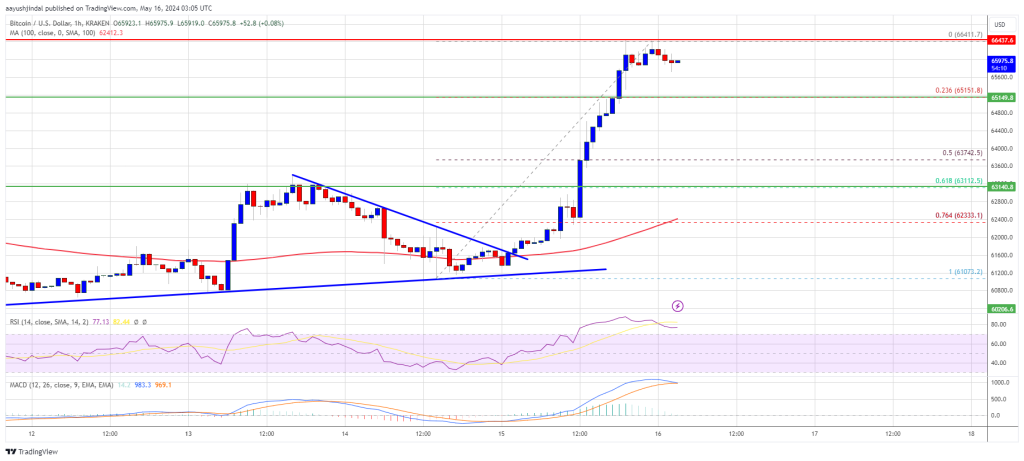
- Bitcoin started a strong increase and cleared the ,500 resistance zone.
- The price is trading above ,000 and the 100 hourly Simple moving average.
- There was a break above a key bearish trend line with resistance at ,500 on the hourly chart of the BTC/USD pair (data feed from Kraken).
- The pair could correct gains but the bulls might be active near ,000 and ,500.
Bitcoin Price Jumps 8%
Bitcoin price remained strong above the ,000 support zone. BTC formed a base and started a fresh increase above the ,000 level. There was a break above a key bearish trend line with resistance at ,500 on the hourly chart of the BTC/USD pair.
The pair rallied over 6% and broke many hurdles near the ,500 resistance. It even cleared the ,500 resistance. A new weekly high was formed at ,411 and the price is now consolidating gains.
It is holding gains above the 23.6% Fib retracement level of the recent wave from the ,073 swing low to the ,411 high. Bitcoin price is also trading above ,000 and the 100 hourly Simple moving average.
Immediate resistance is near the ,400 level. The first major resistance could be ,850. The next key resistance could be ,200. A clear move above the ,200 resistance might send the price higher. In the stated case, the price could rise and test the ,000 resistance.
If there is a close above the ,000 resistance zone, the price could continue to move up. In the stated case, the price could rise toward ,000.
Are Dips Limited In BTC?
If Bitcoin fails to climb above the ,400 resistance zone, it could start a downside correction. Immediate support on the downside is near the ,150 level.
The first major support is ,500. If there is a close below ,500, the price could start to drop toward ,500 or the 50% Fib retracement level of the recent wave from the ,073 swing low to the ,411 high. Any more losses might send the price toward the ,000 support zone in the near term.
Technical indicators:
Hourly MACD – The MACD is now gaining pace in the bullish zone.
Hourly RSI (Relative Strength Index) – The RSI for BTC/USD is now above the 50 level.
Major Support Levels – ,150, followed by ,500.
Major Resistance Levels – ,400, ,800, and ,200.
EOS Network Foundation Founder: Bitcoin Halving Spurs Development of Solutions Enhancing Network Efficiency
 With Bitcoin transaction fees recently becoming a more critical component of miner revenue, Yves La Rose, CEO of Exsat, believes there is “an increased incentive to adopt and develop solutions that enhance transaction throughput and network efficiency.” According to La Rose, this can be achieved by integrating advanced layer two (L2) solutions which expand the […]
Bitcoin News
Bitcoin Not Out Of Danger Yet, NVT Golden Cross Warns
On-chain data shows the Bitcoin Network Value to Transactions (NVT) Golden Cross still has a high value, a sign that may be bearish for BTC.
Bitcoin NVT Golden Cross Is Still Near Historical Top Zone
In a CryptoQuant Quicktake post, an analyst discussed the recent trend in the NVT Golden Cross for BTC and its implications for the price.
The NVT ratio is an indicator that tells us about how the Bitcoin market cap compares against its transaction volume. The metric is generally used to judge whether the asset’s price is fair or not right now.
When the indicator’s value is high, it suggests the network’s value (that is, the market cap) is high compared to its ability to transact coins (the volume). Such a trend implies that the asset may be overpriced currently.
On the other hand, the low metric means the cryptocurrency’s price may be undervalued due to a rebound as the market cap is low compared to the volume.
In the context of the current topic, the NVT ratio itself isn’t of interest; rather, it is a modified form called the NVT Golden Cross. This metric compares the short-term trend (the 10-day moving average) with the long-term trend (30-day MA) of the NVT ratio to identify tops and bottoms.
Here is a chart that shows the trend in this Bitcoin indicator over the past couple of years:

In the graph, the quant has highlighted the two relevant zones for the Bitcoin NVT Golden Cross. It would appear that when this metric is above 2.2, a top can be probable for the cryptocurrency as its price is overvalued in this zone. Similarly, the NVT Golden Cross being under -1.6 can lead to a bottom formation for the asset.
The Bitcoin NVT Golden Cross has ventured into the red territory for the last couple of months. Each time it has seen a decline out of the zone, it has followed up with another rise into the zone. As such, it hasn’t been able to visit the bullish region yet.
At present, the metric has just made another exit out of the top zone, but its value is still quite near it. Thus, while a top may not be especially probable now, a lasting uptrend is also unlikely to happen.
It’s possible that Bitcoin won’t be completely out of danger of observing more price drawdowns until the NVT Golden Cross can see a decrease in the green zone.
It now remains to be seen how the indicator develops in the near future and whether its changes will affect the BTC price.
BTC Price
At the time of writing, Bitcoin is floating around the ,900 mark, up more than 4% over the past week.
Bitcoin Soaring Toward $84,000: Insights From Glassnode Co-Founders
In a remarkable turn of events, Bitcoin (BTC) has broken out of its recent trading range, recording a 7% surge in the past 24 hours alone. The cryptocurrency tests the ,000 resistance level, setting the stage for a potential move toward higher targets.
The latest momentum shift in Bitcoin’s price action has caught the attention of industry experts, particularly the co-founders of on-chain analytics firm Glassnode. According to their analysis, the trigger for a larger market structure release has been in the works since the March highs.
Bitcoin Breaks Out
The co-founders of Glassnode believe this breakout has been coming for a long time. They state that they have been waiting for the trigger to unleash a major bullish structure since the March highs when Bitcoin reached its current all-time high (ATH) of ,700, and it looks like the market has finally done so.
They believe the trigger was the recent lower-than-expected US inflation figures and weaker retail sales data, which could prompt a more “dovish stance” from the Federal Reserve.
According to the Glassnode co-founders, this opens the door to a more dovish stance from the Fed. They explain that Bitcoin and the market liked this, and now they expect the price to reach ,000 before ,000 and then up towards ,000. They also believe the altcoins will follow this move strongly.
However, not all analysts are as bullish in the immediate term. Crypto trader and analyst Justin Bennett suggests that Bitcoin needs to hold the ,000 level as new support, cautioning that the ,000 and ,000 price levels could act as resistance and liquidity pockets. He warns that if Bitcoin loses the ,000 support, it’s back to the “chopfest” – further consolidation and volatility.
Andrew Tate Considers Dumping Fiat For BTC
In a surprising move, popular internet personality and self-proclaimed “Top G” Andrew Tate has announced his intention to abandon fiat currency and invest over 0 million into Bitcoin. In a post on social media platform X, formerly known as Twitter, Tate declared, “I’m about to leave fiat completely and ape over 100M into BTC.”
Tate, who has faced numerous legal issues and has been banned from several social media platforms, cited his frustrations with the traditional banking system and fiat currency as the driving force behind this potential decision.
“I’m done with the banks. I’m done with their money. Done with the scams,” he wrote in the post.
In a follow-up post, Tate acknowledged that he has not finalized this decision, as he currently holds more cryptocurrency than fiat currency in his portfolio.
However, he hinted that he might “leave fiat completely,” suggesting that his preference for Bitcoin and other digital assets is growing.
As of press time, Bitcoin is testing the ,900 mark, having regained its bullish momentum. It remains to be seen how far the current rally can extend and whether the bullish momentum can survive potential selling pressure at higher price levels.
Featured image from Shutterstock, chart from TradingView.com
Microstrategy Joins MSCI World Index Amid Bitcoin Rally
 MSCI Inc. has announced the May 2024 Index Review, which includes adding the bitcoin-focused Microstrategy to the MSCI World Index. This decision follows the Nasdaq-listed software intelligence firm’s stock outperforming bitcoin and other major investments. Microstrategy currently holds over 214K bitcoins. MSCI World Index Adds Microstrategy MSCI Inc. (NYSE: MSCI), a premier operator of global […]
Bitcoin News
Over 50,000 Traders Liquidated as Bitcoin Price Surges Past $66,000 Amid Bullish Run-Up
 On Wednesday, the price of bitcoin demonstrated strong growth, escalating by more than ,200 from its daily low. This 7.1% increase against the U.S. dollar propelled bitcoin past the ,000 threshold, reaching a peak of ,461 per coin on Bitstamp. Consequently, the entire cryptocurrency market rose by 6.2%, resulting in the liquidation of 51,567 traders […]
Bitcoin News
Bitcoin Long-Term Holders Buy The Blood, Snatch Up 70,000 BTC
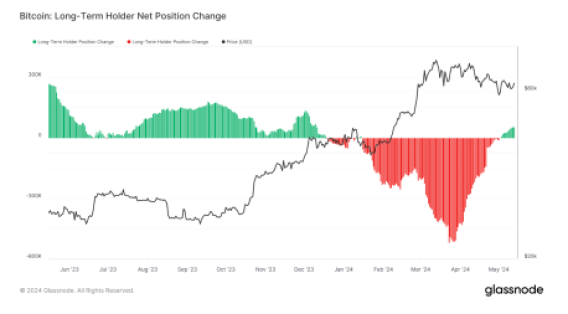
Glassnode data has revealed that Bitcoin long-term holders are taking advantage of the cryptocurrency’s lower price to significantly increase their holdings. This accumulation further strengthens the belief that this group of Bitcoin investors anticipate a potential upside for Bitcoin despite its recent volatility.
Long-Term Holders Pay .3 Billion For 70,000 BTC
According to Glassnode, long-term Bitcoin holders who had previously sold 1 billion BTC in the latter part of 2023 are accumulating once again. This buying activity could be interpreted as a potential bullish signal for Bitcoin.
Traditionally, Bitcoin long-term holders sell their holdings during peak prices and buy new tokens during periods of correction or substantial declines. When these seasoned investors buy cryptocurrencies during market lows, it usually indicates their expectations of a potential rebound, leading to profits.
On the other hand, short-term holders are known to buy cryptocurrencies during sporadic price surges, often signaling that a cryptocurrency is nearing its peak.
With Bitcoin presently stabilizing above ,000, long-term Bitcoin holders probably see the cryptocurrency’s value as a prime buying opportunity. They have recently added a staggering 70,000 BTC valued at over .3 billion to their holdings.
This sentiment for Bitcoin’s potential rally is also shared by a few crypto analysts who have predicted that the cryptocurrency would surge to new all-time highs during the approaching bull market. Earlier in March, before Bitcoin’s halving event, the cryptocurrency skyrocketed above ,000, marking a new historic all-time high.
With the bull market still on the way, Bitcoin could see further upsides as market conditions improve and investor demand rises. This could potentially lead to profits for long term holders who had purchased the cryptocurrency earlier.
Moreover, the upcoming United States inflation report, set for release on May 15, could also be another primary factor driving long-term investors’ substantial BTC accumulation. With the US Consumer Price Index (CPI) remaining historically high, and the Federal Reserve (FED) unchanged rates, Bitcoin is seen as a possible hedge against inflationary pressures, protecting investors’ wealth against decline.
Bitcoin Whales Display Opposite Trend
Reports from blockchain analytics platform Santiment reveal that Bitcoin whales are showing an opposite trend from long-term holders.
The analytics platform noted that Bitcoin whales appear to be taking a break from accumulating BTC, as the number of large-scale transactions has been decreasing significantly.
This trend coincides with the cryptocurrency’s reduced on-chain activities and its declining value over the past few weeks.
Crypto analyst Ali Martinez has also shared a similar report, emphasizing that Bitcoin’s accumulation trend score is currently displaying a value closer to zero, indicating that larger investors were distributing their holdings rather than buying.
Despite the downtrend, Martinez has disclosed that Bitcoin’s current TD sequential is signaling a buying opportunity and the cryptocurrency was poised for a rebound soon. At the time of writing, the cryptocurrency’s price is trading below ,000, receiving a decrease of about 6.38% in the last month, according to CoinMarketCap.
Oklahoma Enacts Landmark Bill to Regulate Digital Assets, Protect Bitcoin Rights, Foster Crypto Innovation
 The governor of the U.S. state of Oklahoma has approved House Bill 3594, a landmark bill that protects bitcoin rights and fosters cryptocurrency innovation. The legislation addresses the regulation and promotion of blockchain technology and cryptocurrency in the state. The bill defines key terms such as blockchain, blockchain protocol, and digital assets, which include virtual […]
Bitcoin News
Bitcoin: Will Prices Easily “Explode” Past $74,000 Or Dump Due To Miner Capitulation?
Bitcoin prices have been trending lower in the past couple of weeks and generally remain within a bearish formation. Although momentum appears to be picking up, bulls are not out of the woods just yet.
Analysts are not losing hope and remain overly upbeat, expecting a surge that would take the world’s most valuable coin to new levels.
Bitcoin Forms A “Cup And Handle” Formation In The Weekly Chart
In a post on X, one of them, MikybullCrypto, said Bitcoin has formed a “cup and handle” reversal pattern, suggesting an imminent surge towards new all-time highs. This formation is a glimmer of hope for optimistic traders, especially now that prices have been moving lower and sideways, erasing gains posted in March.
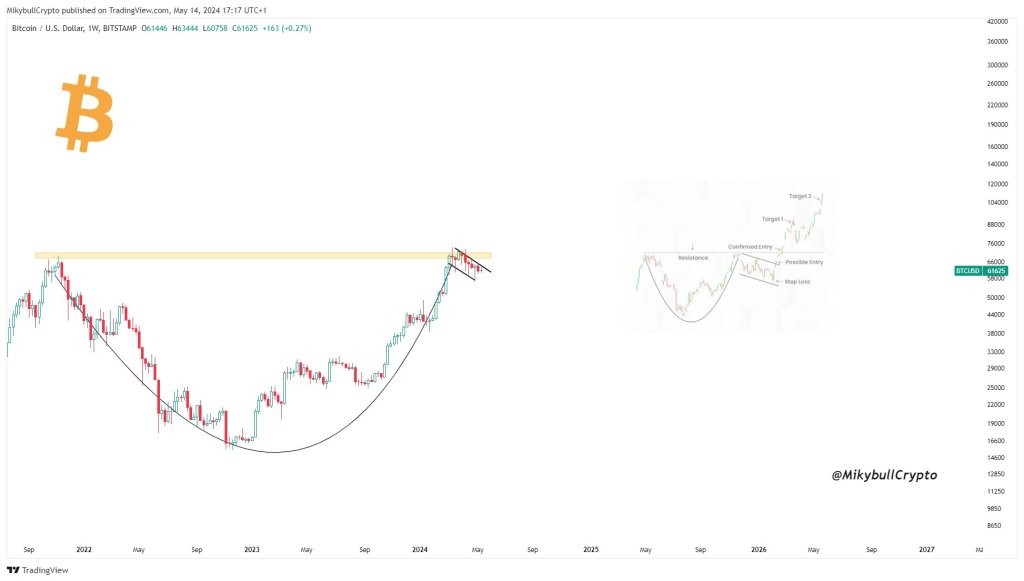
The “cup and handle” formation is a technical pattern chartists use to identify potential reversals and confirm trend continuations. In the current setup, as identified by the trader on the weekly chart, the “handle” was formed after the recent price drop from all-time highs. The “cup” follows the price decline in 2022 and the subsequent recovery in 2023.
Historically, if there is a breakout above the handle and the rim of the cup, prices tend to rally to new levels. For this reason, the analyst says that if buyers press on from spot rates, the breakout above the current range and all-time highs of ,800 will be “explosive.”
For now, prices remain in a descending channel with clear resistance levels marked out in the immediate term at around ,000 and ,000. A breakout, reading from the candlestick formation in the daily chart, above these liquidation levels could spark demand, lifting the coin to new levels.
Will Miners Dump BTC And Force Prices Lower?
However, lurking beneath the optimistic outlook is a potential storm cloud: declining on-chain activity. After the brief spike in on-chain activity on Halving Day due to the launch of the Runes protocol, transaction fees have been declining.
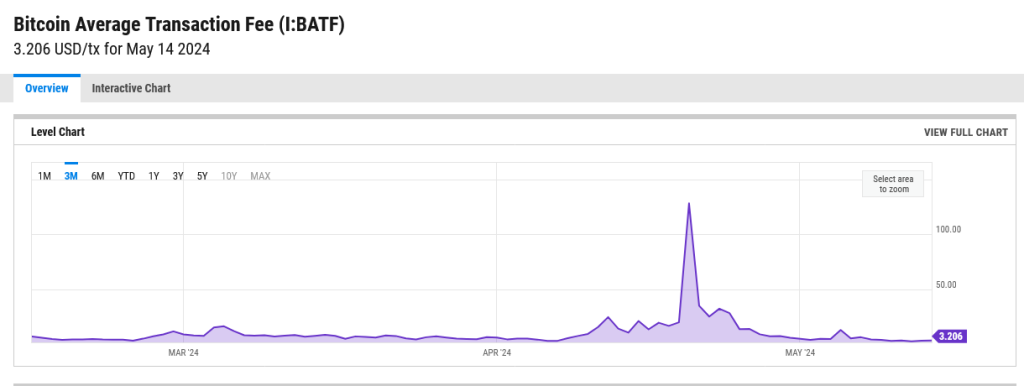
According to YCharts, it is currently at .206, down from over 8 on April 20. This contraction means miners are getting less revenue, heaping more pressure now that there is more pressure on margins post-Halving.
Now that miners are feeling the pinch of slashed block rewards and declining transaction fees, it is likely that they might liquidate some of their BTC to stay afloat. Their participation, especially in the secondary market, would heap more pressure on BTC, forcing prices lower.