 Coinbase, one of the largest U.S.-based cryptocurrency exchanges, reported a system-wide outage in its services, affecting customers’ crypto operations. On its status site, Coinbase stated that it was aware that “some users may experience failures when sending crypto or withdrawing fiat,” and declared it was working to fix this issue. Later, the exchange recognized experiencing […]
Bitcoin News
World Wide Web Inventor Tim Berners-Lee Says Crypto Is ‘Really Dangerous’ but Can Be Useful for Remittances

World Wide Web inventor Sir Tim Berners-Lee says cryptocurrency is “really dangerous” and “only speculative.” While claiming that crypto is for those who “want to have a kick out of gambling,” he noted that it could be useful for remittances.
Sir Tim Berners-Lee on Crypto
Sir Tim Berners-Lee, the British computer scientist who is widely credited with the invention of the World Wide Web, shared his thoughts about cryptocurrency on CNBC’s “Beyond the Valley” podcast, published last week.
Berners-Lee called cryptocurrency “dangerous” and likened it to gambling. Claiming that “cryptocurrency can be 100% speculative” and “not linked to anything at all,” he opined:
It’s only speculative. Obviously, that’s really dangerous.
He asserted that crypto is for “if you want to have a kick out of gambling, basically.” He also compared cryptocurrency to the dot-com bubble, noting that people were valuing various internet stocks “because of what they imagined other people will value them in the future, so in other words it wasn’t based on revenue or anything real so the bubble came.” He further stressed: “Investing in certain things, which is purely speculative, isn’t what, where I want to spend my time.”
However, Berners-Lee said cryptocurrencies could be useful for remittances. He shared:
Having been using it for remittances, that seems to be the most useful thing, if you transfer stuff into blockchain because you can get that immediately to your family.
The British computer scientist emphasized: “Just don’t keep the currency … get rid of it, put it back into USD.”
What do you think about Tim Berners-Lee’s view on crypto? Let us know in the comments section below.
Russia Can Avoid Sanctions By Using A Wide Range Of Cryptocurrency Tools
As the Biden administration slaps economic sanctions against Russia to contain the crisis in Ukraine, Russia is using various cryptocurrency tools to maintain access to foreign capital.
As Russia attacked Ukraine, cryptocurrency prices fell sharply. On Thursday morning, Bitcoin prices declined to more than 8%, to settle at ,702.18, marking its lowest level in around a month.
Ether fell more than 8% to trade around ,407.47.
Related Reading | Quant Explains How Bitcoin NUPL Can Help Predict Bull Cycles
That’s A Lot Of Money
Economists have approximated that the U.S. sanctions would cost Russia around billion annually.
However, the Russian government seemed to have prepared themselves for the worst by connecting with financial networks who are willing to work with them.
One of which is linking with digital currency firms who do not undergo any government regulation and function independently on blockchains.
“Russia has had a lot of time to think about this specific consequence. It would be naïve to think that they haven’t gamed out exactly this scenario,” Michael Parker, a former federal prosecutor in an interview with the New York Times, said.
BTC total market cap at 0.906 billion in the daily chart | Source: TradingView.com
Using Cryptocurrency Tools Vs. Sanctions
Economic sanctions are some of the most powerful suppression tools that many Western countries have used in times of war and crises.
During the Russian invasion of Crimea, the United States restricted its banks from dealing business with Russian oil, ghas and financial institutions, the latter’s economy was badly impacted.
Related Article | Bitcoin Investors Haven’t Responded To Russia-Ukraine War With Large Inflows (Yet)
While the US is the one to initiate, the way to make sanctions effective is through the global financial system.
International banks monitor the flow of money and are tasked with blocking transactions on sanctioned nations.
This is rendered impossible, however, as the Russian government is set to launch its own central bank for the digital Rubble. It seeks to trade directly with countries without having to go through the American currency.
Under The Radar
To cover their activities from blockchain recording mechanisms, Russia also developed new technology to hide their transactions, even from third-party investigators.
A similar move has been done by North Korea which made use of cryptocurrencies to fund its nuclear and ballistic missile program, according to Reuters.
Iran was also reported to be gaining money from crypto mining to make up for its revenue loss due to its ability to sell oil because of sanctions.
The Russian Blockchain Empire
Presently, Russia is growing a ransomware and blockchain industry.
Last year, entities connected to Russia earned about 74% of total global income, more than 0 million worth of cryptocurrency, according to a Feb. 14 report by the blockchain-tracking firm Chainalysis.
Since Russian President Vladimir Putin announced a military operation in the Donbas region on Wednesday, Bitcoin prices declined to ,000, indicating a drop of more than 8% compared to a day earlier.
Bitcoin was trading at ,969 as of 1:22 a.m. Eastern Time, according to CoinMarketCap.
Featured image from Reddit, chart from TradingView.com
NewsBTC
Bitcoin Suffers As Mid Caps Cryptos Establish Market Dominance With Wide Margin
Bitcoin has now seen declining prices following the El Salvador Bitcoin law. The flash crash that had cleared at least 0 billion off the crypto total market cap has left lingering effects on the price of the digital asset. The price had plunged from ,000 to ,000 in less than an hour, leading to an 18% loss in about 30 minutes. While bitcoin has since recovered from its lows from the crash, the asset has not been able to recover to previous levels before the crash.
Though the crash had affected most of the market, mid-cap coins have recovered the most from this. The Mid Caps Index had actually crashed along with the rest of the market. But subsequent recovery trends show that it had gained back a good percentage of its value since the crash.
Related Reading | MicroStrategy Deepens Its Crypto Bet With Another 0 Million Spent On Bitcoin
Mid Caps Index Outperforms In September
In the month of September, the Mid Caps Index has grown 21% in September alone. This is a complete deviation from the patterns of other indexes, both the Small Caps and the Large Caps, which have both shown declines in the month of September. The Large Caps index is up only 1% in September. Likewise, keeping in line with the low recoveries, the Small Caps index is down 3% for the month.
Mid Caps Index dominates market in September | Source: Arcane Research
Bitcoin, which seemed to have held up well during the crash, has made the least significant recovery in the month. The asset shows the lowest performance in the month of September, down 5%, even lower than the Small Caps index.
Related Reading | New To Bitcoin? Learn To Trade Crypto With The NewsBTC Trading Course
Altcoins have recorded better performances after the crash, despite taking the most hits with the flash crash. The week following the crash saw the altcoin market recover swiftly. Coins like Algorand which belong to the Mid Caps Index performed so well after the crash that it pulled the entire index up with it. While bitcoin has maintained low momentum and continues to struggle in the market.
Bitcoin Maintains Market Dominance
The performances of the indexes versus bitcoin have not had much of an impact on the market dominance of the asset. Although bitcoin lost some of its market dominance, the total for the week came out to be about 1% of market dominance lost to altcoins. Currently, the market dominance of the digital asset sits at 41.47%. The Mid Caps Index performance has seen the altcoin market creeping up to take more market share from bitcoin.
BTC price trading above K | Source: BTCUSD on TradingView.com
Bitcoin price has been showing some significant recovery patterns in the past few days. But there has not been any significant recovery in the price. The digital asset is gearing up for what looked to be a retest of the ,000 resistance point, after having found a comfortable position above ,000 ahead of the opening of the midweek market trading. Currently, the price is trading at ,473 with a 24-hour price change of 2.11%.
Chart from TradingView.com
NewsBTC
This Surprising Cryptocurrency Could Spark the Next Market Wide Rally
The cryptocurrency markets have been caught in the throes of immense volatility over the past few days, with Bitcoin plummeting to lows of ,400 earlier this morning before posting a strong rally back up towards ,000.
With the exception of Bitcoin’s recovery today, this volatile price action has primarily favored sellers. The ongoing downtrend may be on the verge of reversing, however, and analysts are noting that Litecoin could be the unlikely suspect that sparks the next market-wide uptrend.
Cryptocurrency Markets Face Heightened Volatility
Bitcoin has been leading the aggregated crypto markets to face heightened volatility as of late, with its recent dip below the ,000 support level leading it to drop to lows of ,400, before finding a significant amount of support.
The bounce that occurred at ,400 signaled that the cryptocurrency’s bulls still have strength and that this price may ultimately mark a mid-term bottom for BTC.
Bitcoin has held significant sway over most major altcoin’s price action over the past couple of weeks, and analysts are noting that Litecoin may currently be the best positioned major cryptocurrencies for further upside in the near-term.
Big Cheds, a popular cryptocurrency analyst on Twitter, spoke about this in a recent tweet, while pointing to a collage of charts from major cryptocurrencies.
“$LTC Litecoin has the best setup of the 4 majors but its too early to knife catch unless you are wearing strong gloves,” he cautiously noted.
$LTC Litecoin has the best setup of the 4 majors but its too early to knife catch unless you are wearing strong gloves$BTC $ETH $BCH pic.twitter.com/qPN8iTvvSU
— Big Cheds (@BigCheds) December 18, 2019
In spite of this potential bullishness, analysts are noting that Litecoin – which is currently trading down marginally at its current price of – may see slightly further downside before it begins a sustainable uptrend.
Scott Melker, another popular analyst and trader, shared his thoughts on LTC in a tweet, explaining that he is watching for the crypto to visit between and before entering positions.
“$LTC (USD) I will consider buying this again between and ,” he said.
$LTC (USD)
I will considering buying this again between and . pic.twitter.com/cv8F61gRLw
— The Wolf Of All Streets (@scottmelker) December 17, 2019
Analyst: Litecoin Could Lead the Next Market-Wide Uptrend
In early 2019, around the time when the cryptocurrency markets began their multi-month uptrend, Litecoin front ran the gains seen by Bitcoin and other major altcoins.
Big Cheds spoke about this in a recent tweet, noting that it is possible that the markets see a similar occurrence this time around.
“$LTC #Litecoin started the run last year, so maybe again this year who knows,” he mused.
$LTC #Litecoin started the run last year, so maybe again this year who knows https://t.co/VrgVCPc9qz
— Big Cheds (@BigCheds) December 18, 2019
The coming days and weeks will likely offer significant insight into where Bitcoin, Litecoin, and the aggregated cryptocurrency markets head in the weeks and months ahead.
Featured image from Shutterstock.
The post This Surprising Cryptocurrency Could Spark the Next Market Wide Rally appeared first on NewsBTC.
Bitcoin (BTC) Price Diving, Gates To $7,400 Now Wide Open
- Bitcoin price is diving and it recently broke the ,000 support area against the US Dollar.
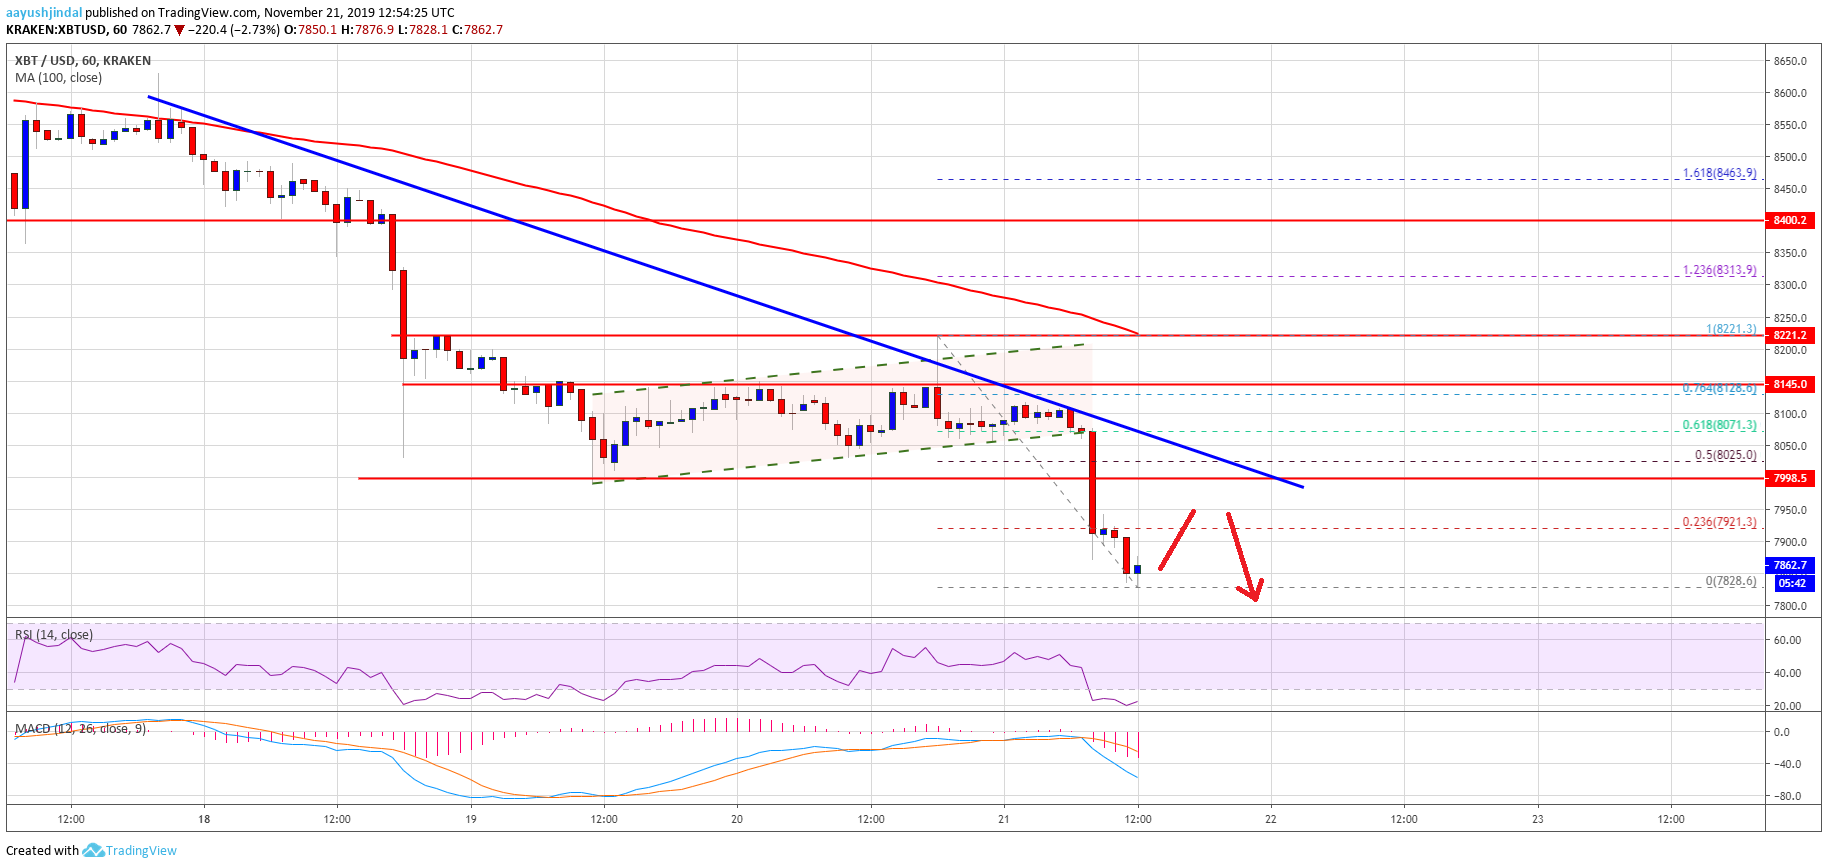
- The price is under a lot of pressure and recently traded to a new monthly low at ,828.
- Morning’s bearish flag pattern was breached with support near ,080 on the hourly chart of the BTC/USD pair (data feed from Kraken).
- The next key target for the bears could be ,400 (as discussed in the recent medium term outlook).
Bitcoin price is gaining bearish momentum below ,000 against the US Dollar. More importantly, there is now very less chances of BTC recovering above ,250 before testing ,400.
Bitcoin Price Analysis
In morning, we discussed the chances of a breakdown in bitcoin below the ,000 support area against the US Dollar. BTC made an attempt correct above the ,150 resistance, but it failed to gain traction and remained well below the 100 hourly simple moving average.
As a result, there was another bearish break below the ,050 support. Moreover, morning’s bearish flag pattern was breached with support near ,080 on the hourly chart of the BTC/USD pair.
Finally, the price declined below the ,000 support and the last swing low. A new monthly low was formed near ,828 and the price is currently correcting higher.
An immediate resistance for bitcoin is near the ,920 level. It represents the 23.6% Fib retracement level of the recent decline from the ,221 high to ,828 low. The first key resistance on the upside is near the ,000 level (the recent breakdown support).
Additionally, the 50% Fib retracement level of the recent decline from the ,221 high to ,828 low is near the ,020 level to prevent gains. Lastly, there is a new connecting bearish trend line forming with resistance near ,020 on the same chart.
Therefore, the price is likely to face a strong resistance if it corrects higher towards ,000 and ,020. A convincing break above the ,020 resistance may perhaps lift the price towards the ,200 resistance.
On the downside, it seems like the gates for a test of the ,400 support is now open (the next bearish target as discussed in the recent medium term outlook).
Bitcoin PriceLooking at the chart, bitcoin price is clearly gaining bearish momentum below the ,000 support area. There are high chances of additional losses towards the ,400 support unless the price rallies above ,020 and ,200 in the near term.
Technical indicators:
Hourly MACD – The MACD is gaining pace in the bearish zone.
Hourly RSI (Relative Strength Index) – The RSI for BTC/USD is currently recovering from the oversold levels.
Major Support Levels – ,640 followed by ,400.
Major Resistance Levels – ,000, ,020 and ,200.
The post Bitcoin (BTC) Price Diving, Gates To ,400 Now Wide Open appeared first on NewsBTC.
Bitcoin Caught in Wide Long-Established Trading Range; Factors & Trends
Bitcoin (BTC) has incurred increased volatility as of late, which was first sparked when it briefly touched ,400 before surging to highs of ,800, which is the price at which it faced some levels of resistance.
Analysts are now noting that BTC is still trading within a long-established wide trading range, and that its mid-term trend remains unclear until it breaks through either the upper or lower boundaries of the aforementioned trading range.
Bitcoin Faces Rejection at ,800 as Bears Fight Back
At the time of writing, Bitcoin is trading down nearly 2% at its current price of ,450 and is still up significantly from its recent lows of roughly ,400 but is down slightly from its recent highs of just under ,800 that were set yesterday.
It is important to note that this recent price action has done little to clarify what type of trend Bitcoin is currently in, as the crypto has continued trading between a relatively wide trading-range that has been established for many weeks.
Alex Krüger, a popular crypto analyst on Twitter, spoke about this trading range in a recent tweet, explaining that although BTC is more bullish now than it has been in recent times, its bullishness is still tempered unless it can break above ,800.
“This $BTC analysis is still valid. Two weeks later, price is at the same level after tossing bulls and bears around even further within the range. However, chart is now more bullish given last week’s new bears, now trapped. Key level above is 10,800. Expect next test to break,” he explained while referencing a previous tweet.
This $BTC analysis is still valid. Two weeks later, price is at the same level after tossing bulls and bears around even further within the range. However, chart is now more bullish given last week's new bears, now trapped. Key level above is 10,800. Expect next test to break. https://t.co/dzdD6k9cMF
— Alex Krüger (@krugermacro) September 4, 2019
BTC May Still Target ,300 in Near-Term
Although BTC has yet to break above what Krüger deems as a critical price level, he also believes that it is currently primed for a movement up towards ,300 in the near-term, despite the slight amount of selling pressure it incurred today.
“Targeting a 10,800 breakout, taking price to *at least* 11,300, is a good trade short-term to me, with invalidation around 9,800. Stops should be tightened to the 10,300-10,000 range after 10,300 stops taken out and level rejected, or once above 10,600, and to BE after 10,800,” he explained.
Bitcoin may soon establish a firm near-term trend as it begins incurring increasing volatility, and whether or not it is able to break above or below the key range levels will likely set the tone for how it trends throughout the second-half of 2019.
Featured image from Shutterstock.
The post Bitcoin Caught in Wide Long-Established Trading Range; Factors & Trends appeared first on NewsBTC.
Bitcoin Price (BTC) Jumps 10%: Road To $12K Now Wide Open
- Bitcoin price rallied recently above the key ,000 resistance area against the US Dollar.
- The price is currently trading well above the ,600 level and it could continue to climb in the near term.
- There is a key bullish trend line forming with support near ,200 on the hourly chart of the BTC/USD pair (data feed from Kraken).
- The pair is likely to rally further above the ,000 mark to register a solid uptrend.
Bitcoin price gained more than 10% in the past 24 hours and broke K against the US Dollar. BTC is likely to continue higher towards the ,000 and ,000 levels.
Bitcoin Price Analysis
Yesterday, we saw a solid upward move above ,500 in bitcoin price against the US Dollar. The BTC/USD pair remained in a positive zone and recently rallied above the main ,000 resistance. There was even a close above the ,000 level and the 100 hourly simple moving average. A new 2019 high was formed above ,800 and the price traded close to the ,000 level.
The recent rise was convincing since there was a strong follow through above ,000. The bulls are currently in action despite the recent downside correction. It broke the ,700 support plus the 23.6% Fib retracement level of the recent rally from the ,853 low to ,903 high. However, the decline was protected by the ,400 support area.
It seems like the 50% Fib retracement level of the recent rally from the ,853 low to ,903 high acted as a strong support. Moreover, there is a key bullish trend line forming with support near ,200 on the hourly chart of the BTC/USD pair. The pair is currently moving higher and is trading above the ,600 level. On the upside, an immediate hurdle is near the ,800 level, above which the price could trade towards the ,000 level.
Moreover, if the bulls remain in action, the price may even climb above the ,000 and ,200 levels. On the downside, there are many supports near the ,600 and ,400 levels. The main support is now near ,000.
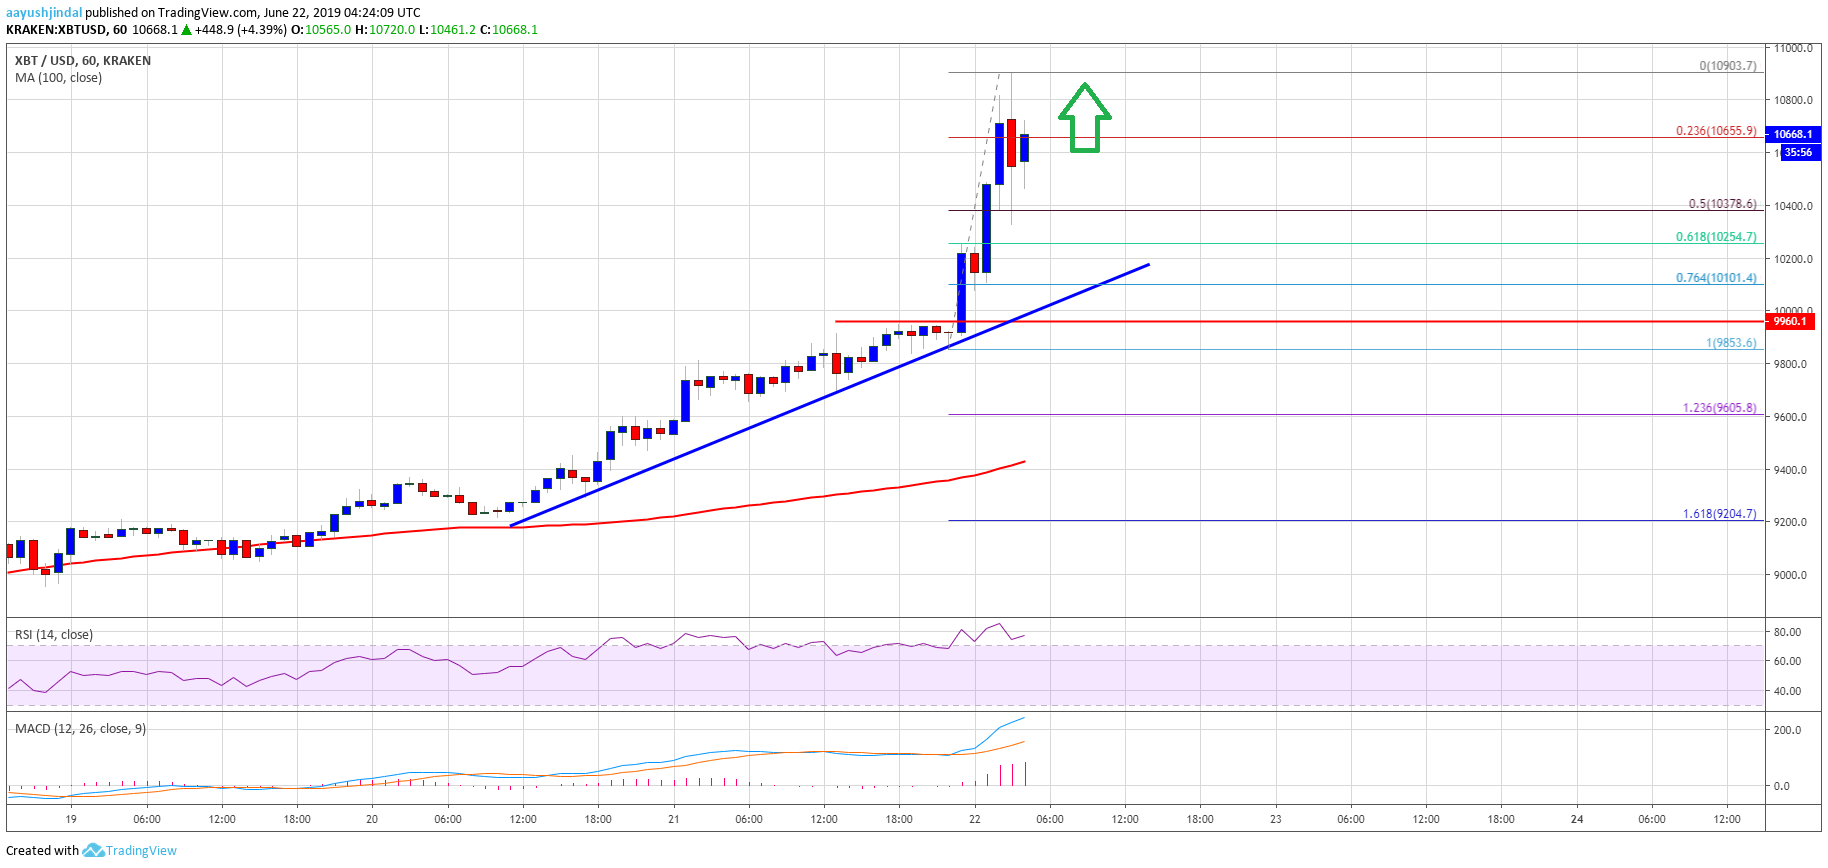
Looking at the chart, bitcoin price is clearly in a strong uptrend above ,000. If there are more gains, the price may even test the next important resistance near ,000. On the downside, the previous resistances near ,800 and ,500 are now pivot levels. Only a daily close below ,500 might start a major decline.
Technical indicators:
Hourly MACD – The MACD is currently now heavily in the bullish zone.
Hourly RSI (Relative Strength Index) – The RSI for BTC/USD is currently in the extreme overbought zone.
Major Support Levels – ,600 followed by ,400.
Major Resistance Levels – ,800, ,000 and ,200.
The post Bitcoin Price (BTC) Jumps 10%: Road To K Now Wide Open appeared first on NewsBTC.