 Following the release of lower-than-anticipated CPI data on June 12, U.S. equities climbed to record highs, with bitcoin exceeding ,000. However, Ryze Labs, a venture capital firm investing in blockchain and Web3 projects worldwide, particularly in emerging markets, stated that the Federal Reserve’s hawkish dot plot forecast and subsequent comments by Chair Jerome Powell led […]
Bitcoin News
Only 8 Altcoins Have Broken ATH Against Bitcoin Since FTX’s Collapse – Analyst Weighs In
During this bull cycle, the crypto market has been surfing off Bitcoin’s crest and enjoying the bullish momentum. However, investors hope for a seismic explosion to impulse Altcoins to new highs.
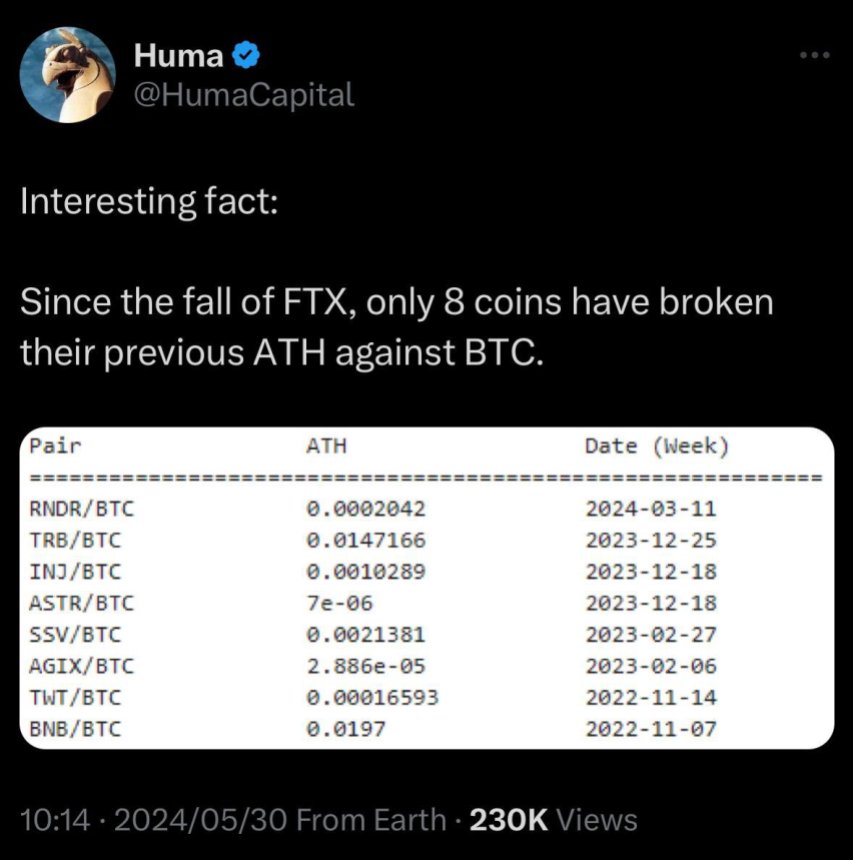
As the crypto industry awaits, online reports revealed that, since FTX’s fall, only eight altcoins have hit a new all-time high (ATH) against Bitcoin. A crypto analyst shared his thoughts on the matter.
Altcoins Underperforming Against Bitcoin This Cycle
On Friday, Crypto analyst Miles Deutscher shared an interesting fact about the crypto market. Since November 2022, just eight altcoins have broken their previous ATH against the flagship cryptocurrency.
To achieve this feat, tokens include Render (RNDR), Tellor (TRB), Injective (INJ), Astar (ASTR), SSV Network (SSV), SingularityNET (AGIX), True Wallet Token (TWT), and Binance Coin (BNB).
It’s worth noting that RNDR was the latest one to accomplish this on March 11 and that the list only contains altcoins launched before FTX’s collapse.
Deutscher explained that despite his initial shock, the news made sense to him and highlighted some takeaways based on the singularities of this run.
First, the analyst considers that asset selection dynamics changed from previous cycles. Investors have been “punished” for being overexposed to certain sectors like L2 and gaming and “rewarded” for participating in others like Memecoins and AI.
In contrast, in the last cycle, “you could basically bet on anything and beat $BTC.” According to the analyst, the market will likely continue experiencing specific sector outperformance despite the retail liquidity injection.
He also explained that “crypto is an attention economy,” and money will flow where attention is. As a result, even the projects with the best technology won’t perform if there isn’t an exciting reason to buy.
Deutscher’s second takeaway highlights the market’s current ATH dilution. As he points out, thousands of new products are being launched daily, and “low float/high FDV VC coins are launching in the billions.” These launches are seemingly outpacing the new liquidity, resulting in Altcoins struggling with performance.
More Room To Catch Up
The analyst’s third point explains that the bull run has been led by Bitcoin and spot BTC exchange-traded funds (ETH). Based on this, he considers it unsurprising that altcoins have “hardly pumped” so far.
Various crypto analysts and experts share this opinion. Alex Krüger previously stated that the cycle has been “almost entirely” driven by the Bitcoin ETFs’ momentum.
Deutscher sees Altcoins’ underperformance as a bullish signal since Bitcoin’s dominance has been instrumental in previous cycles. To him, this performance allows “more room to play catch up” and could drive altcoins to unseen highs.
The analyst believes the market needs another catalyst for a true Altcoins season. Despite this, he highlights that many investors have had a record Q1 “even in mildly bullish conditions for most alts.”
Ultimately, Deutscher considers there is still room to make big profits this cycle “even without the face-melting altseason we all crave.”

Is Mt. Gox A Worry For Bitcoin? Crypto Analyst Weighs In
Bitcoin outflows from the Mt. Gox exchange have occurred in the past day, making some worry about potential bearish effects. Here’s what an analyst thinks.
Mt. Gox Has Made Several Bitcoin Transactions In The Last 24 Hours
During the past day, several movements from wallets associated with the bankrupt cryptocurrency exchange Mt. Gox have been spotted on the Bitcoin blockchain. The platform had announced plans to repay its creditors, so the transactions are likely related to them.
Mt. Gox has moved out 137,890 BTC in total, worth almost .4 billion at the current cryptocurrency exchange rate. With these transfers, the market has become concerned about whether these tokens will move towards trading, adding to the selling pressure in the market.
As a result, the BTC price has fallen about 4% in the past 24 hours. While the market has reacted negatively to the news so far, some have wondered whether these withdrawals are actually going to be bearish.
Analyst James Van Straten discussed this in an X post and provided perspective on how a potential selloff arising out of these repayments would compare against another that BTC witnessed recently.
The distribution event in question is from the long-term holders (LTHs), which make up one of the two main divisions of the BTC market based on holding time.
All investors holding onto their coins since more than 155 days ago qualify for this cohort, while those who bought within the past 155 days are put in the short-term holder (STH) group.
The LTHs are considered to be the resolute side of the market, as they rarely participate in selloffs, while the STHs are the fickle-minded investors who regularly react to sector events by panic selling.
The recent rally in the asset, though, proved to be enough to move even these HODLers into selling, as the chart below shows their total supply.
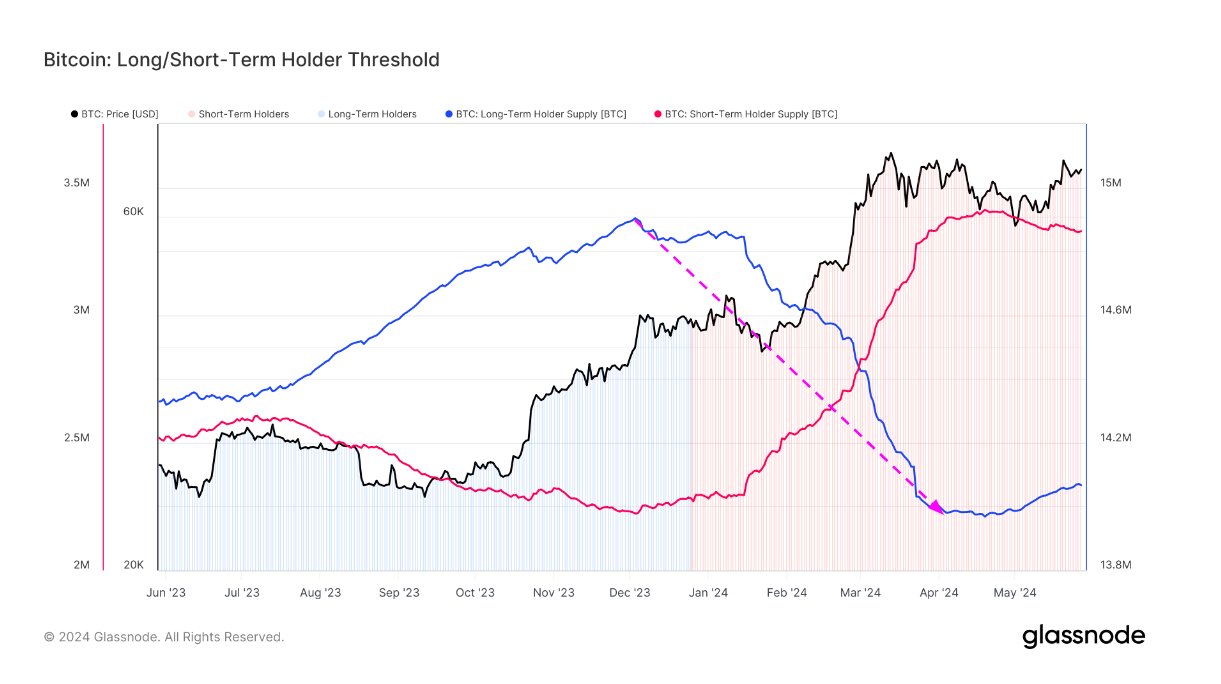
As the graph shows, the LTH supply has been moving sideways in the last couple of months, but it was in a state of decline for five months before that.
In this selloff, the LTHs sold around 1 million tokens, of which around 340,000 BTC was linked to GBTC outflows. At the same time, this distribution from the LTHs occurred, though the coin’s price marched to a new all-time high, implying that the market could absorb this massive selling pressure just fine.
Straten notes that the Mt. Gox repayments are only about a tenth of this selloff, and not everyone who will get these tokens will decide to sell. At the very least, everyone wouldn’t sell at the same time.
Thus, given this fact, it’s possible that Bitcoin may not be affected by this distribution if demand for the cryptocurrency remains as strong as it has been recently.
BTC Price
Bitcoin had risen above the ,000 level earlier, but the Mt. Gox news has brought the asset down to ,700.
Shiba Inu On The Verge Of 600% Rally? Analyst Weighs In
Shiba Inu, known as the “Dogecoin Killer,” is eagerly anticipating a significant price leap. Market analyst Ashish has sparked excitement with a bold prediction: a 600% surge that could catapult the meme coin to an impressive .000075.
This bullish forecast comes after what Ashish describes as a nearly two-year-long slumber within a consolidation pattern. December 2023 saw Shiba Inu finally break free from this price purgatory, breaching a crucial resistance trendline. The breakout ignited a rally that culminated in a 370% surge, reaching a 2024 high of .000045 in early March.
However, the party wasn’t meant to last. A correction ensued, prompting Ashish to establish strategic buying zones between .000022 and .000025.
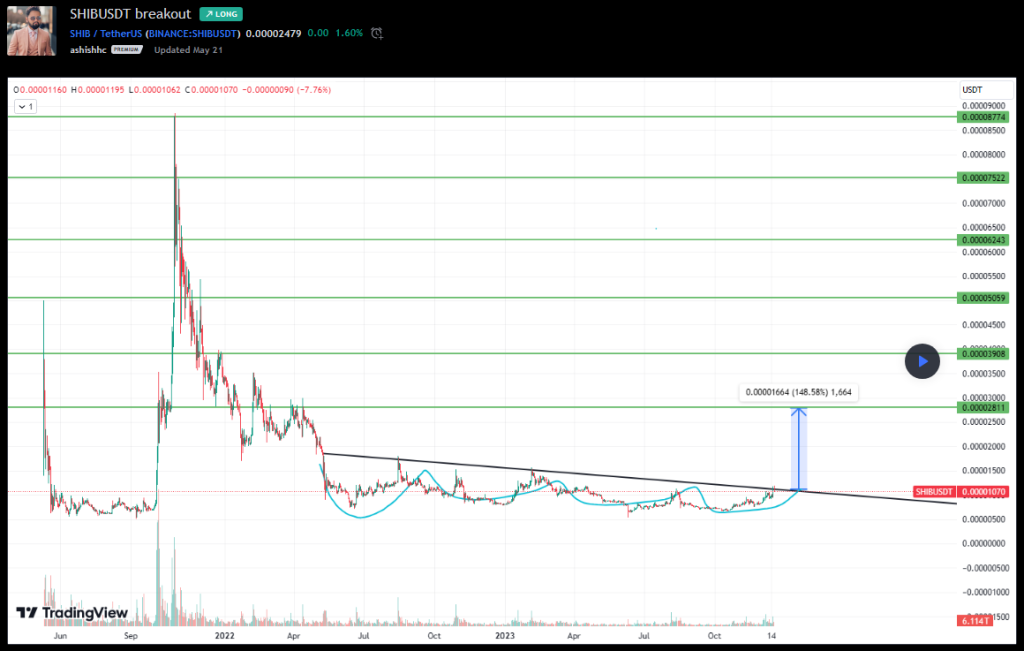
Shiba Inu: Enter The Flag Pattern
Ashish’s crystal ball sees a bullish flag pattern emerging on the 1-hour chart, hinting at a potential “second leg up.” This technical indicator suggests a period of consolidation following a sharp price increase, often acting as a precursor to another upward movement.
Despite a slight price dip today, Shiba Inu appears to have room for growth. The daily Relative Strength Index (RSI) currently sits at nearly 48, indicating that the coin is neither overbought nor oversold. This neutral territory suggests potential for upward movement, aligning with Ashish’s prediction of a second leg up.
SHIB Price Forecast
Meanwhile, CoinCodex’s current Shiba Inu price prediction forecasts a rise of 220%, potentially reaching .00008089 by June 24, 2024. CoinCodex’s technical indicators currently show a Neutral sentiment, while the Fear & Greed Index stands at 76, indicating Extreme Greed. Over the past 30 days, Shiba Inu has seen 12 out of 30 green days (40%) with a price volatility of 4.40%.
Given these metrics, it’s clear that Shiba Inu’s market behavior is capturing significant investor interest. The Extreme Greed reading on the Fear & Greed Index suggests a high level of enthusiasm, which, while positive for potential price gains, also warrants caution due to the possibility of rapid sentiment shifts.
The coin’s moderate volatility and the occurrence of green days indicate a steady, albeit unpredictable, upward momentum. This combination of factors makes Shiba Inu a fascinating asset to watch in the coming months.
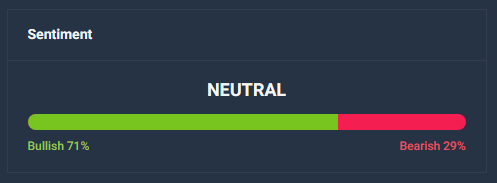
As of today, the overall sentiment for the Shiba Inu price prediction is neutral. This assessment is supported by technical analysis indicators, where 20 indicators are showing bullish signals, while eight are signaling bearish trends.
This balanced sentiment reflects the inherent volatility and speculative nature of cryptocurrencies. The fact that a significant number of indicators are bullish suggests there is optimism about Shiba Inu’s short-term potential, possibly driven by recent market activities or positive news.
Featured image from Top Gear, chart from TradingView
Did MicroStrategy Mess Up By Choosing Bitcoin Over Ethereum? Analyst Weighs In
Earlier today, the United States Securities and Exchange Commission (SEC) approved 19b-4 fillings for eight spot Ethereum exchange-traded funds (ETFs), paving the way for the highly anticipated institutional adoption of the second most valuable coin.
The decision comes after months of uncertainty and less than six months after the regulator approved spot Bitcoin ETFs. For all that the crypto community can remember this week, the regulator uncharacteristically “scrambled” and hastily communicated to spot ETF issuers to make amends to their applications.
Did MicroStrategy Make A Mistake Choosing Bitcoin Over Ethereum?
With spot Ethereum ETFs likely to be issued in the next few weeks, one analyst on X now thinks Michael Saylor, the former CEO of MicroStrategy, missed big rewards by choosing Bitcoin over Ethereum. As of May 24, MicroStrategy, a business intelligence firm and now one of the biggest public companies in the United States, has been increasing its BTC holdings over the years.
According to Bitcoin Treasuries, MicroStrategy is the largest public company holding BTC, controlling 214,400 BTC worth over billion at press time.
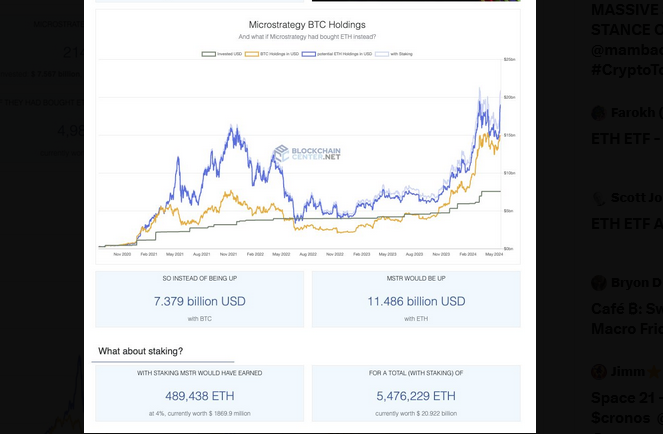
However, with the United States SEC setting the ball rolling for spot Ethereum ETFs, the analyst is now pointing out a hypothetical scenario. If MicroStrategy had chosen ETH over BTC, their holding would have been worth over billion at spot rates.
This level means MicroStrategy would be up over billion. Assuming the business intelligence firm had chosen to buy and not hold but stake, their total holdings would be worth over .9 billion as of late May 2024.
ETH Trading At A Huge Discount: Will It Replicate BTC’s Success?
Looking at the aftermath of the approval and trading of spot Bitcoin ETFs, it becomes apparent that Ethereum prices might be significantly undervalued at spot rates. After a brief dip in mid-January, BTC prices surged, propelling Ethereum to a high of ,100. In contrast, the world’s most valuable coin soared to breach ,000 and set all-time highs at around ,000.
With 19b-4 forms from eight ETF issuers, including BlackRock and Fidelity, approved, the only hurdle is the approval of S-1 registration statements. There might be delays in this round. However, the United States SEC green lights, spot Ethereum ETF shares will begin trading.
Still, it is important to note that spot Ethereum ETF issuers will hold ETH via a regulated custodian and not stake.
Why Did Bitcoin Just Jump 10%? Blockchain Firm Weighs In
The cryptocurrency market has been on a hot streak in the past few days, with several large-cap assets posting significant gains in the past week. Most notably, the Bitcoin price bounced back from around ,000 to above ,000 for the first time in nearly a month.
As expected, this latest price movement has sparked a lot of speculation and discussion around the premier cryptocurrency. Popular blockchain analytics firm CryptoQuant has shared on-chain insights into the recent Bitcoin price rally and its future trajectory.
How Did Bitcoin Price Reach ,000?
In a recent report, CryptoQuant revealed the catalyst and on-chain manifestations behind BTC’s latest rally to above ,000. According to the analytics firm, the price of Bitcoin rode to its new highs on the back of the news of lower-than-expected inflation in the United States.
The inflation data released on Wednesday, May 15 showed that the Consumer Price Index (CPI) rose by 0.3% in April – lower than the expected 0.4%. This revelation suggested that inflation might be on a downward slope in the US, making risky assets like Bitcoin more attractive.
#Bitcoin's price has rallied from K to around K, driven by lower-than-expected US inflation and reduced selling pressure.
Let's look into the details
— CryptoQuant.com (@cryptoquant_com) May 17, 2024

In its report, CryptoQuant revealed that there has been a decreased selling pressure in the BTC market, as short-term holders are selling at low or negative profits. Meanwhile, Bitcoin balances at over-the-counter (OTC) desks have steadied, implying that fewer coins are entering the open market.
What’s more, the analytics platform highlighted a particular on-chain signal that might have predicted the recent Bitcoin price rally. According to CryptoQuant, BTC miners have been extremely underpaid over the past few weeks, which often correlates with price bottoms.
The Catalysts For Sustained BTC Rally?
CryptoQuant, in its report, identified potential catalysts for a continued rally for the Bitcoin price. According to the on-chain data company, demand from permanent holders and largest investors is on the rise but it needs to climb rapidly to push the price of BTC even higher.
Furthermore, the latest data shows that Bitcoin ETF (exchange-traded funds) purchases have dwindled to nearly zero daily, while stablecoin liquidity growth is also on a decline. CryptoQuant noted that these two metrics need a jolt, which might be critical for a sustained Bitcoin rally.
As of this writing, the Bitcoin price continues to hover around ,000, reflecting a 2.5% increase in the past 24 hours. According to CoinGecko data, the premier cryptocurrency is up by a significant 10% in the past week.
Crypto Expert Weighs In On ETH/BTC Pair’s Recent Decline
Amid turbulence surrounding the crypto market, popular founder and Chief Executive Officer (CEO) of Into The Cryptoverse Benjamin Cowen has taken the spotlight to shed his insights on the recent downtrend observed in the Ethereum/Bitcoin (ETH/BTC) pair. Cowen’s views examine the complex relationship between Ethereum and Bitcoin pricing and the potential for further downside risk.
According to Benjamin Cowen, the ETH/BTC pair is currently on the downside, and the last 2 times that the pair declined, ETHUSD witnessed a steep decline of around 70%. Given that the crypto community has been eagerly anticipating an Altcoin season for the past 2.5 years, Cowen thinks it is crucial to warn the community that there is still a possibility of a downward movement.
ETH/BTC Pair Rejected By The Bull Market Band
Cowen has also confirmed that ETH/BTC is presently being rejected by the bull market support band, which he previously predicted days back due to a price pump. “I would expect it (ETH/BTC) to be rejected by the bull market support band, at least when looking at weekly closes (.053-.054),” he stated. He further noted that the pump appears to be mirroring the last cycle of rate cuts right before summer capitulation.
Following the launch of Bitcoin Spot Exchange-Traded Funds (ETFs), Cowen mentioned that ETH/BTC saw a sharp rally. The analyst affirms that the rally was probably similar to the trend of the previous bull cycle, ushering in new lows.
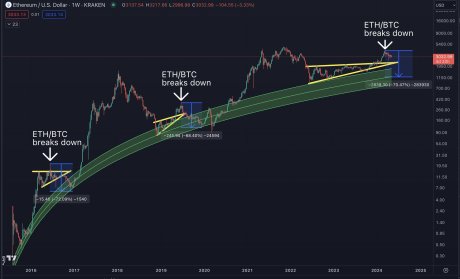
Furthermore, Cowen stated that there has been an unquestionable macro downtrend since November 2021, particularly following the merger of the ETH/BTC pair. However, it is also evident that the market did not decrease abruptly.
As a result, investors held ETH instead of BTC all the way down from 0.085 to 0.048 because of the multiple lower highs, giving the impression that it was holding up quite well.
Prior to the Bitcoin Halving, Cowen predicted that the bull market support band would reject ETH/BTC, at least when considering weekly closes (.053-.054), should there be a rebound after the Halving, similar to that witnessed with BTC spot ETF launch. Regardless of what occurs, the expert is confident that ETH/BTC will reach between .03 and .04 by this summer.
Heightened Divergence Between Ethereum And Bitcoin
Being the two leading cryptocurrency assets, there is great interest surrounding Ethereum and Bitcoin. However, on-chain analytics firm Glassnode has highlighted a shift in performance between both digital assets.
According to the firm, the performance of Ethereum and Bitcoin has been increasingly diverging so far in the 2023–2024 cycle. This is due to poorer performance in ETH price, which is explained by a generally weaker trend in capital rotation. In addition, this is evident when particularly compared to preceding cycles and all-time highs.
Are Altcoins Cooling Off? Analyst Weighs In On This Cycle’s Market
Many investors expressed worries about the crypto market corrections during this cycle. Bitcoin’s price drop has dragged altcoins with them, and, as a result, a more pessimistic sentiment has started to brew among some sectors of the crypto community.
Analysts and traders have reassured investors that the market fluctuations are a normal part of the journey. Some urge the community to look at the bigger picture, as altcoins remain above levels not seen in years.
Renowned crypto analyst Altcoin Sherpa weighed in on the matter, exploring some of the reasons and differences that make this bull cycle different from the 2020s.
Time For An Altcoins Cool-Off?
In an X post, Altcoin Sherpa asserted that there’s a high possibility “that altcoins are done for the next 1-4 months.” The analyst considers that, right now, most of the market needs “time to chill out and consolidate after such a big run.”
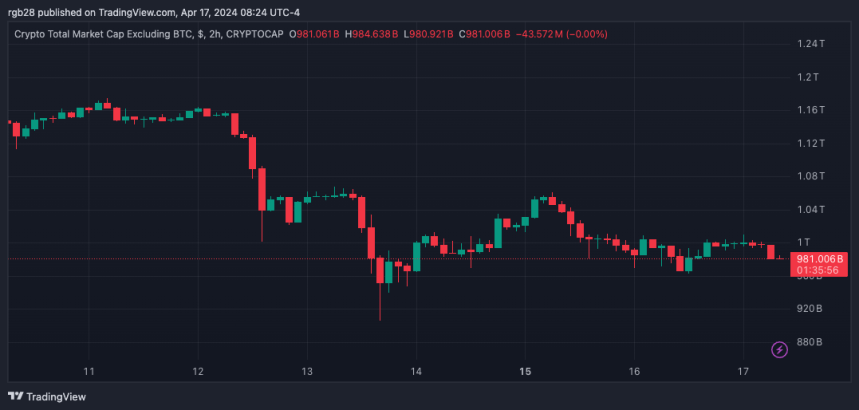
Despite recently falling below the trillion market capitalization, altcoins have performed remarkably in the last few months. In 2024, cryptocurrencies’ market cap, excluding Bitcoin’s, has increased by 22.79%, according to TradingView data.
Altcoins market cap has also considerably surged in longer timeframes, with a 91.31% and 52.46% jump in the last six months and the past year. This “big run,” as Sherpa called it, sits the cryptocurrency market at levels like those seen in 2022.
However, what worries the crypto analyst is, despite the overall performance, “many alts didn’t even run that hard over the last few months.” He illustrated his point with Chainlink’s native token, LINK.
Despite the +500 days of accumulation, LINK investors only got 3-4x gains depending on when they go in. Now, the token’s price is “strongly pulling back.” Expectations for altcoins during this cycle seemingly play a significant role in the current sentiment.
As one X user pointed out, LINK was anticipated to be one of the biggest winners of this cycle, Sherpa replied that he “expected more lol.” The user playfully commented, “No dino coins and new and shiny coins are the better bet.”
How Did The Market Change?
The previous comment highlights what appears to be a significant difference between this bull run and the 2020s. Choosing your bag has become more difficult since the market has expanded significantly.
Sherpa considers that “now more than ever, it is super important to choose the altcoins that are going to run hard.” In 2020, the massive altseason made “everything go up consecutively.”
This time, the liquidity is more fragmented, and “only a few sectors are pumping.” The AI and memes sectors have been the hottest topic in 2024, and layer-1 (L1) tokens, like SEI, have also performed well. “Everything else? Not great,” remarked Sherpa.
The massive number of tokens, both newly launched and old ones, are finding it more difficult to “capture mindshare/attention.”
Regarding retail investors, the analyst is not surprised that the default choice is memecoins instead of “trying to learn about some DeFi veRewards type of stuff. Or Oracle or L1s or modular or anything else.”
The analyst suggested investors “move to real value” like ETH and SOL. He also considers that big token launches, with significant money behind them, “have some real value.” These coins, as stated in the post, have the potential to “do very well” once Bitcoin stabilizes.
Sherpa’s market analysis closes with a “pretty bearish” outlook for the following months. The growing difficulty in keeping user attention and “for people to become strong users/community members” for many projects has made the market a different playground.
Ultimately, the analyst pointed out that “portfolio rebalances are necessary” and said he still believes this run is not over.
Ethereum’s Dive To 3-Year Low Against Bitcoin, Is This A Bear Trap? Trading Guru Weighs In
Trading Guru Peter Brandt has recently commented on the Ethereum vs. Bitcoin chart, offering intriguing insights into market developments.
Brandt’s remark comes after his prior critiques of Ethereum, denigrating it as a “junk coin” and its proponents as “Etheridiots.” However, amidst Ethereum’s recent descent to its lowest position against Bitcoin in nearly three years, Brandt’s stance seems to have transformed.
Ethereum Plunges Against Bitcoin: A Bear Trap?
Upon analyzing the Ethereum-to-BTC chart, Brandt suggested the presence of a “bear trap,” indicating that the ongoing decline in Ethereum’s value compared to Bitcoin might entice sellers into additional short positions.
However, this could lead to an unexpected reversal, turning the apparent breakdown in support into a false signal.
Bear trap? That is always a possibility when price hits a new 35-month low. pic.twitter.com/aKQg9k7TcD
— Peter Brandt (@PeterLBrandt) April 8, 2024
Brandt’s observation of a potential bear trap highlights the complexities within the cryptocurrency market and the importance of considering multiple factors when analyzing price movements.
While Ethereum may be experiencing a period of relative weakness against Bitcoin, Brandt’s cautious optimism suggests that there may be opportunities for a reversal shortly.
Bullish Signals Amid ETH/BTC Downturn
Despite Ethereum’s recent challenges, bullish signals have emerged, hinting at a potential turnaround. The options market, in particular, has shown optimism, with a significant portion of Ethereum options open interest expiring by the end of April being bullish bets on price.
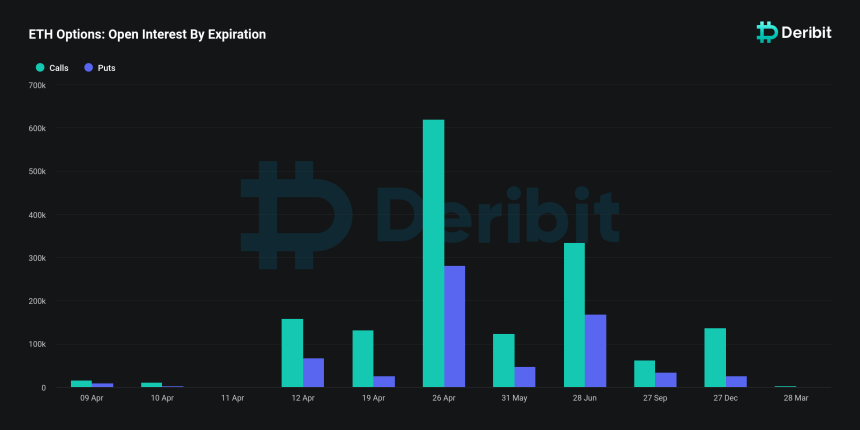
Deribit data reveals that about .3 billion worth of notional ether options are scheduled to expire, with approximately two-thirds of this sum allocated to calls. Moreover, the Ethereum put-call ratio for the April expiration stands at 0.45, signaling a slightly more bullish stance than Bitcoin options.
Notably, a put-call options ratio below one suggests bullish sentiment, with traders favoring call options over put options. Moreover, the emergence of two new Ethereum whales, according to the crypto tracking platform Spot On Chain, identified as 0x666 and 0x435, adds to Ethereum’s bullish sentiment.
These entities collectively withdrew a substantial amount of ETH from a major exchange, suggesting growing confidence in Ethereum’s prospects despite its recent downtrend.
While Ethereum faces downward pressure against Bitcoin, Bitcoin’s resilience in the market is evident. Crypto analyst Ali has highlighted that Bitcoin appears to be breaking out, with a potential upside target of ,000 if it can hold above ,800.
#Bitcoin appears to be breaking out! If $BTC can hold above ,800, the next target becomes ,000! pic.twitter.com/JPLf18KZvt
— Ali (@ali_charts) April 8, 2024
When writing, Bitcoin trades above this critical level with a current market price of ,621, indicating a possible climb towards ,000 shortly.
Featured image from Unsplash, Chart from TradingView
Is Jupiter’s Next Leg Up Coming? Crypto Analyst Weighs In As JUP Surges 13%
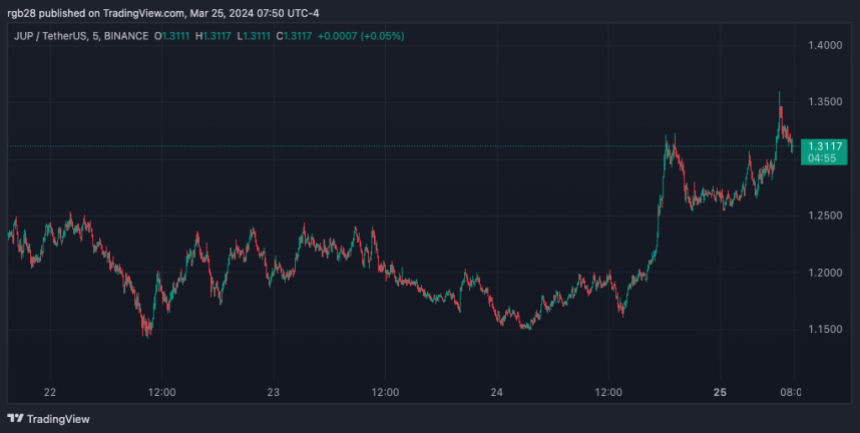
Jupiter (JUP) has had a remarkable month, with its price skyrocketing over 150% in the last 30 days. Amid the crypto market slowdown and some controversies, JUP’s performance has maintained momentum.
Crypto Analyst Sees “Decent” Entry Spot For JUP
Jupiter’s JUP started the month trading around .63 and has seen the price jump 106% in 25 days. The token’s performance this month showed sideways price action before climbing to a new support level twice, which could suggest that another price surge is possible despite the turbulent week.
In an X post, renowned crypto analyst Altcoin Sherpa commented on JUP’s most recent performance as he wondered about the possibility of a leg up.
$JUP: Wondering if next leg is coming for JUPITER…consolidation and looks ok + btc looks somewhat stable (for now). Might be a decent spot entry here. pic.twitter.com/uE8IHblbFY
— Altcoin Sherpa (@AltcoinSherpa) March 25, 2024
The analyst shared JUP’s price chart, which displayed the token’s sideways movement inside the .12-.47 price range for the past few days. The chart shows that the consolidation phase started after the token’s price jumped and unsuccessfully tested the .50 resistance level on March 16.
After a pullback to the .20 mark, JUP retested the resistance zone again on March 18, briefly reaching .60, but ultimately failed to maintain it. Following the unsuccessful attempts to climb, the price dipped even lower to the .10 support zone in the following days.
Since then, JUP has bounced back, hovering between the .15-.25 zone. The recent price consolidation looks “ok,” according to the analyst. He further highlights Bitcoin’s current stability, seemingly suggesting to Sherpa that JUP could repeat its March trajectory.
As a result, the analyst deems this moment as a “decent entry spot” for Jupiter’s token. Additionally, he has shown a positive sentiment towards JUP before, calling the token a “winner” that’s “gonna keep on winning.”
winners gonna keep on winning. $PYTH and $JUP are some of the great ones. pic.twitter.com/nL4BmzxFJo
— Altcoin Sherpa (@AltcoinSherpa) March 16, 2024
JUP’s Price Action
Recently, JUP’s Community showed some concerns after its co-founder Meow announced a controversial decision. Meow revealed on X that Jupiter would donate the SLERF limit order and DCA fees to the token’s presale participants.
This decision was taken without consulting the community, a crucial part of the project. After the criticism, Meow explained that “no JUP tokens were involved in the donation and, despite the turbulence in the community, JUP’s price didn’t seem to be affected.”
It’s worth noting that Bitcoin’s price showed stabilization signs over the weekend, as highlighted by Sherpa. This matters as JUP followed BTC’s trajectory closely over the last week. As the chart below shows, the Solana-based token mimicked the moves of the flagship cryptocurrency.
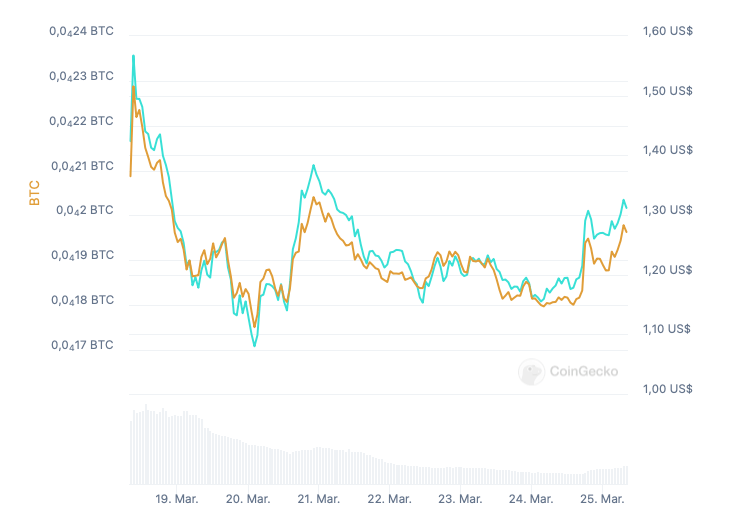
In the last 24 hours, Jupiter’s trading volume has surged 64.1%, with 4.7 million being traded. According to CoinMarketCap data, JUP’s market capitalization increased 8.5% in the past day, placing the token as the 65th largest cryptocurrency by this metric, with .77 billion.
Despite the negative 3.5% performance in the past week, the token exhibits a significant 71.8% price jump in the biweekly timeframe. At the time of writing, JUP is trading at .33, a 13.2% surge in the last day.