- ETH price is trading in a bearish zone below the 0 and 2 resistances against the US Dollar.
- The price is at a risk of more downsides if it breaks the 5 and 2 support levels.
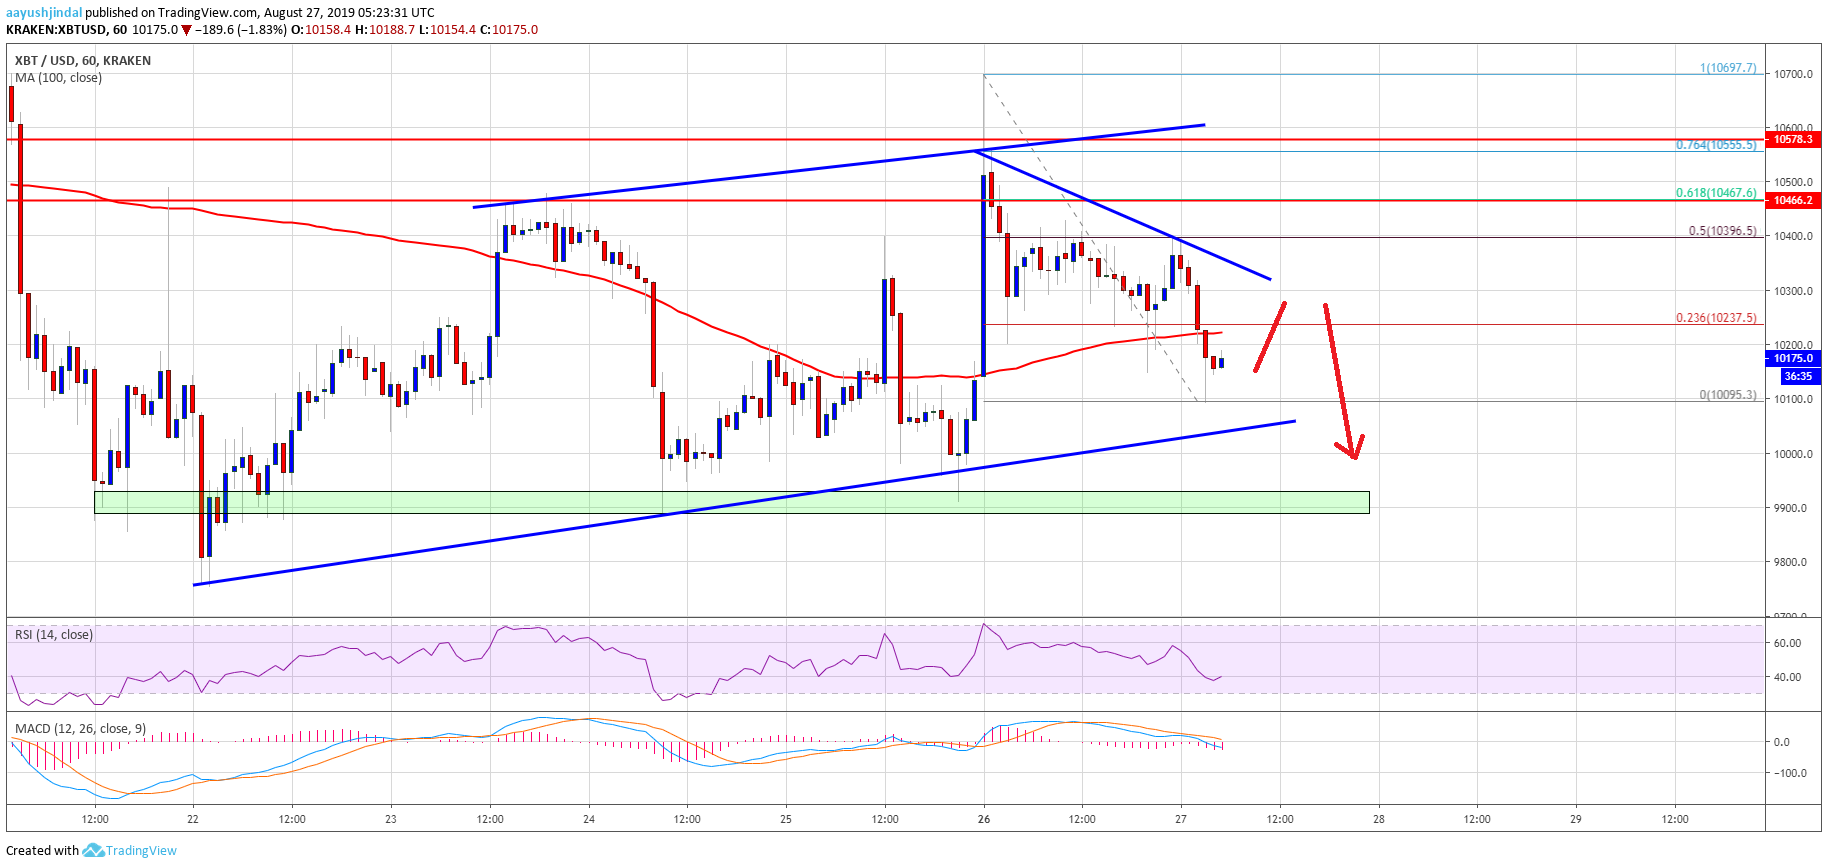
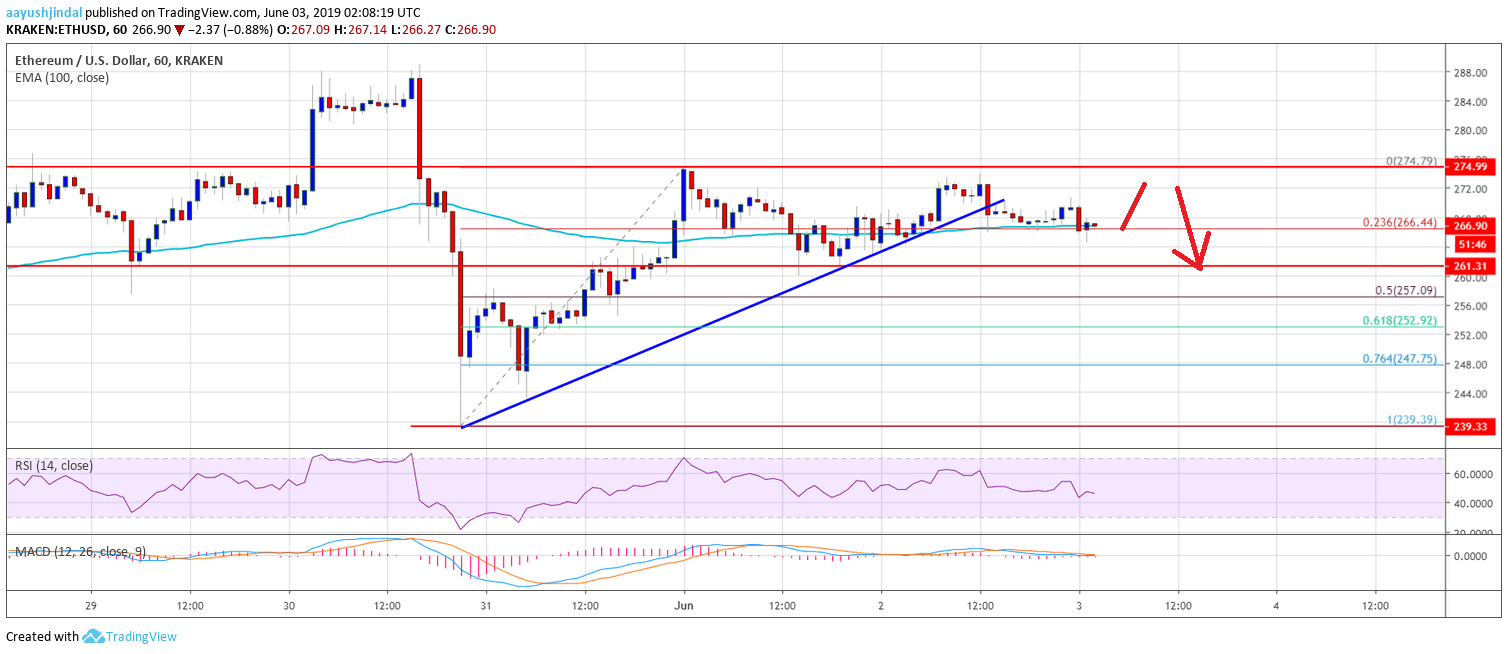
- There is a key bearish trend line forming with resistance at 7 on the hourly chart of ETH/USD (data feed via Kraken).
- The pair might slowly move down towards the 2 and 0 support levels in the near term.
Ethereum price is trading in a bearish zone versus the US Dollar and bitcoin. ETH price could decline sharply if it fails to stay above the 2 and 0 support levels.
Ethereum Price Analysis
After a failed upside attempt near 5, ETH price started a fresh decline against the US Dollar. The price broke the key 2 support level to move back into a bearish zone. Moreover, there was a close below the 0 level and the 100 hourly simple moving average. On the downside, the 4 level seems to be acting as a decent support. Similarly, there were mostly bearish moves in bitcoin below the ,300 and ,400 levels.
At the moment, Ethereum is trading near the 5 level. An immediate support is near the 4 level. If there is a downside break below the 4 support, the price could test the 2 support. The main support is near the 0 level, below which there is a risk of a sharp decline in the coming sessions.
On the upside, an initial resistance is near 7 plus the 23.6% Fib retracement level of the recent slide from the 5 swing high to 4 low. Moreover, there is a key bearish trend line forming with resistance at 7 on the hourly chart of ETH/USD. If there is an upside break above the trend line and 7, the price could test the 100 hourly simple moving average.
Additionally, the 50% Fib retracement level of the recent slide from the 5 swing high to 4 low is near the 0 level to act as a strong resistance. A convincing close above the 0 resistance and the 100 hourly SMA could push the price towards the 5 resistance.
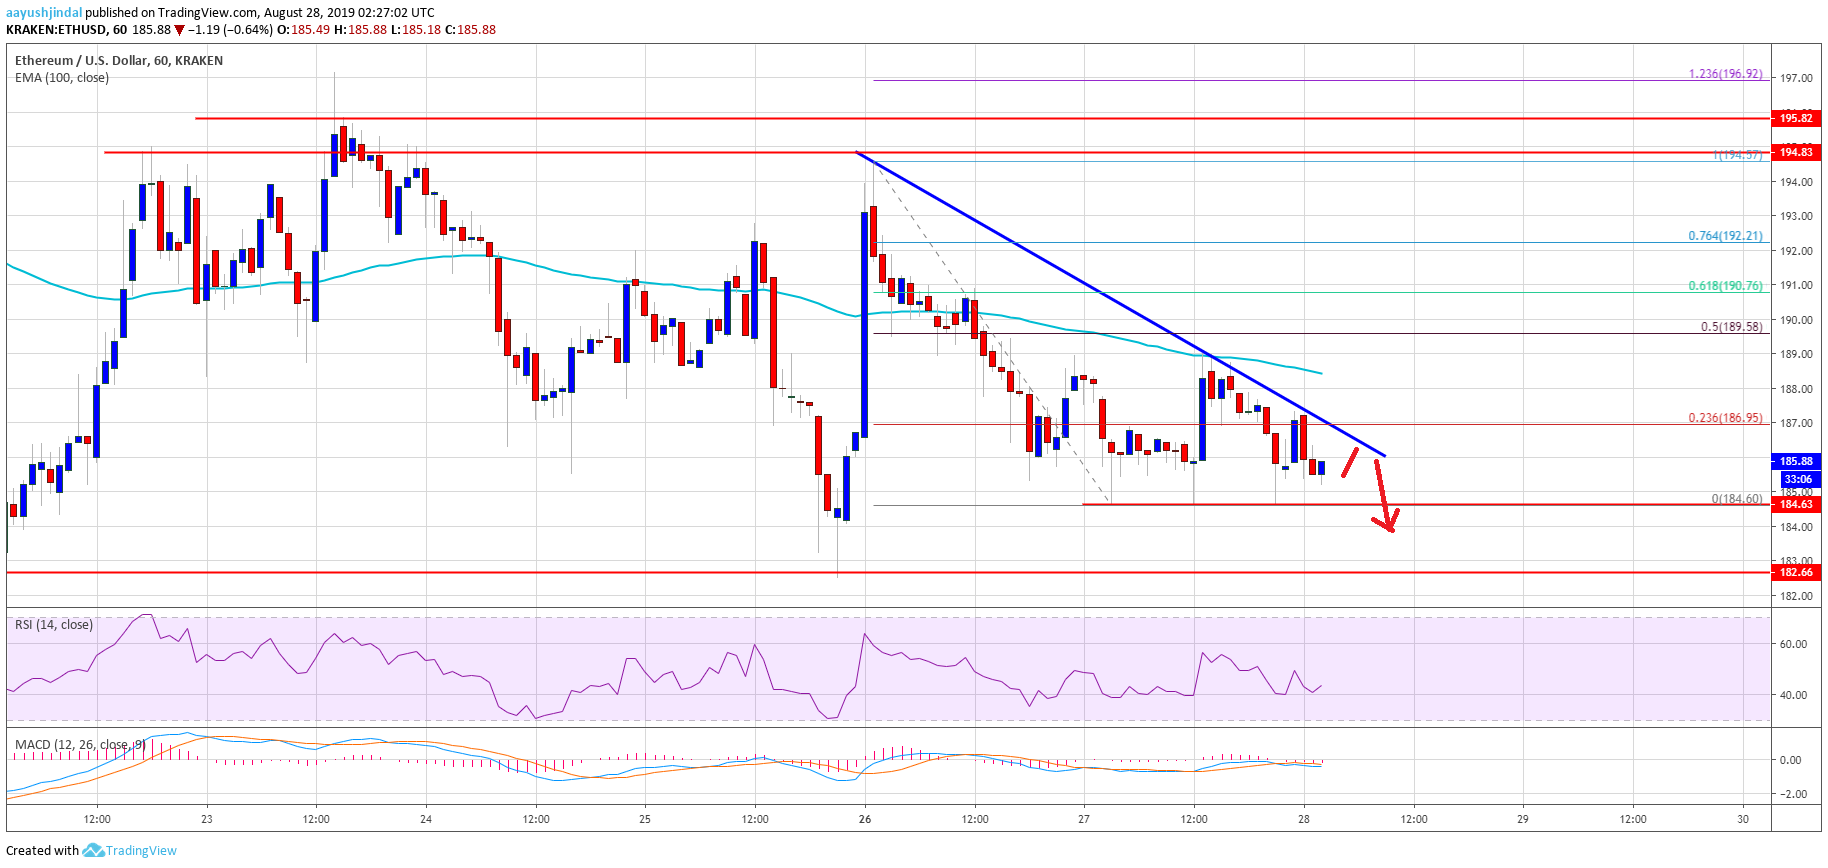
Looking at the chart, Ethereum price is trading with a bearish angle below the 0 resistance level. Therefore, there are high chances of more downsides below the 4 and 2 support levels. Similarly, bitcoin price could struggle to recover above ,250 and it might decline below ,000.
ETH Technical Indicators
Hourly MACD – The MACD for ETH/USD is slowly gaining momentum in the bearish zone.
Hourly RSI – The RSI for ETH/USD is currently holding the 40 level, with a negative bias.
Major Support Level – 0
Major Resistance Level – 0
The post Ethereum Price (ETH) Showing Further Signs Of Weakness appeared first on NewsBTC.