 Asian currencies have reached their lowest levels in over 19 months as the U.S. dollar strengthens, driven by expectations of prolonged elevated U.S. interest rates. The Bloomberg Asia Dollar Index fell by 0.1% on Thursday, marking its lowest point since November 2022. Significant declines in the Philippine peso, Indian rupee, and South Korean won are […]
Bitcoin News
XRP Faces Extended Bearish Pressure At $0.4937 Amid Market Weakness
XRP, one of the leading cryptocurrencies, is currently grappling with extended bearish pressure amid prevailing market weakness. The digital asset has been facing significant downward momentum, influenced by a confluence of factors including macroeconomic uncertainties, regulatory challenges, and broader market sentiment.
Thus far, XRP’s price has struggled to maintain key support levels, exacerbating concerns among traders and investors about its near-term performance. As bearish momentum continues to dominate, this analysis delves into evaluating XRP’s current market position with the help of key technical indicators focusing on the 4-hour and the 1-day chart.
The price of XRP has increased by 0.63%, trading at about .4920 in the last 24 hours, with a market capitalization of more than billion and a trading volume of more than billion as of the time of writing. There has been a 1.06% decrease in market capitalization in the last day despite the trading volume being up by 5.89%.
XRP Current Market Performance And Trend
Currently, the price of XRP is actively bearish trading below the 100-day Simple Moving Average (SMA) in the 4-hour timeframe, and the price here is beginning to decline after a failed upward attempt. With the current price formation, it can be suggested that XRP’s bearish trend may likely extend.
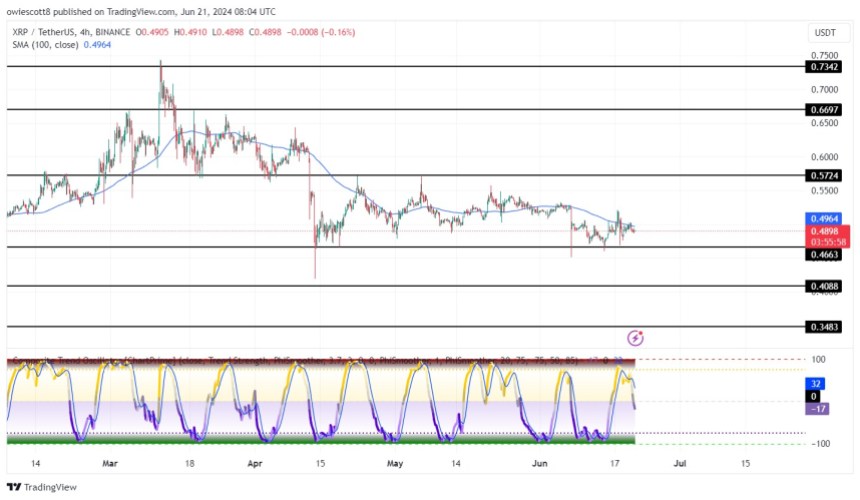
Also, the Composite Trend Oscillator confirms that XRP’s decline may be extended as both the signal line and the SMA of the indicator are descending from the overbought section toward the zero line.
In the 1-day chart, XRP is trading below the 100-day SMA attempting to move upward. It should be noted that this is just a short-term move as the crypto asset’s price at some point will begin to drop again thereby extending the bearish trend.
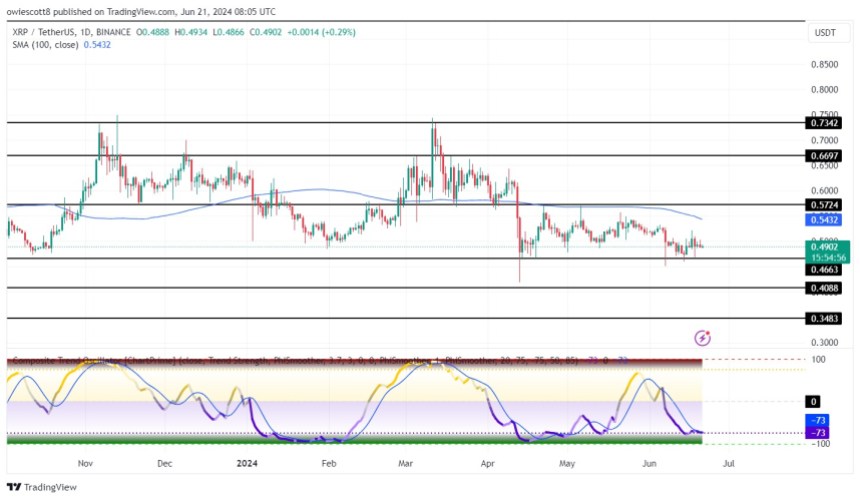
Additionally, the formation of the 1-day Composite Trend Oscillator indicates that XRP’s bearish trend may likely extend as both the signal line and the SMA of the indicator are trending below the zero line closed to the oversold zone.
Navigating The Bearish Market For The Token
With XRP currently facing significant bearish pressure, It should be noted that if the crypto asset continues bearish as predicted, it will begin to move towards the .4663 support level. If it breaks below this level, it will decline further to test the .4088 support level and may move to test the .3483 support level if it breaches the .4088 level.
However, if XRP fails to decline further and decides to move upward, it will begin to move toward the .5725 resistance level. Once this level is breached, XRP’s price will continue upward to challenge the .6697 resistance level and may move on to test other resistance levels above.
XRP Price Under Siege: Losses Likely to Extend Amid Market Weakness
XRP price struggled to surpass the .500 resistance zone. The price is moving lower and showing bearish signs for a move below the .4850 support.
- XRP price faced another rejection near the .50 resistance zone.
- The price is now trading below .4950 and the 100-hourly Simple Moving Average.
- There was a break below a short-term rising channel with support at .4920 on the hourly chart of the XRP/USD pair (data source from Kraken).
- The pair could extend losses if there is a close below the .4850 support zone.
XRP Price Dips Again
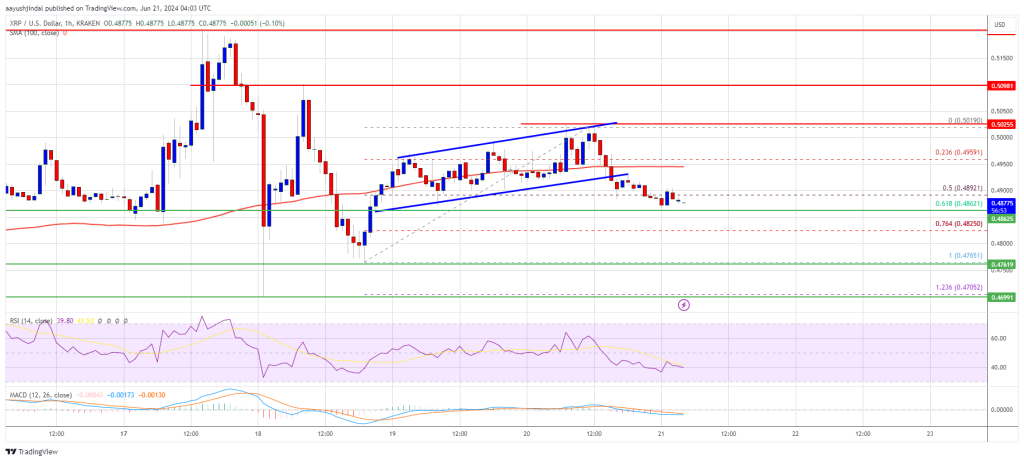
XRP price attempted a fresh increase above the .4950 resistance zone. It even spiked above the .50 resistance but there was no real bullish momentum. A high was formed at .5019 and the price started a fresh decline like Bitcoin.
There was a move below the .4980 and .4950 levels. There was a break below a short-term rising channel with support at .4920 on the hourly chart of the XRP/USD pair. The pair even traded below the 50% Fib retracement level of the upward move from the .4765 swing low to the .5019 high.
The price is now trading below .4950 and the 100-hourly Simple Moving Average. The bulls seem to be active near the .4850 support and the 61.8% Fib retracement level of the upward move from the .4765 swing low to the .5019 high.
If there is a fresh increase, the price might face hurdles near the .4950 level. The first major resistance is near the .50 and .5020 levels. A clear move above the .5020 resistance might send the price toward the .5150 resistance.
The next major resistance is near the .5250 level. A close above the .5250 resistance zone could send the price higher. The next key resistance is near .5320. Any more gains might send the price toward the .550 resistance.
More Losses?
If XRP fails to clear the .50 resistance zone, it could continue to move down. Initial support on the downside is near the .4850 level.
The next major support is at .4765. If there is a downside break and a close below the .4765 level, the price might gain bearish momentum. In the stated case, the price could even trade below the .4540 low in the near term.
Technical Indicators
Hourly MACD – The MACD for XRP/USD is now gaining pace in the bearish zone.
Hourly RSI (Relative Strength Index) – The RSI for XRP/USD is now below the 50 level.
Major Support Levels – .4850 and .4765.
Major Resistance Levels – .5020 and .5150.
Bitcoin Turns Weakness Into Strength: Analyst Identifies Major Liquidity Zone At $73,000
Crypto analyst Dippy has laid a bullish narrative for the Bitcoin future trajectory, suggesting that the flagship crypto could soon hit a new all-time high (ATH). This comes despite Bitcoin’s recent drop below ,000.
Bitcoin Could Experience A Massive Pump Above ,000
Dippy suggested in an X (formerly Twitter) post that Bitcoin could enjoy a price pump once it reaches the liquidity zone around ,000. He noted that many short traders have their stop losses or liquidation levels around that price level, which could be the catalyst for this price pump since liquidations of short positions can easily flush out the bears.

The crypto analyst also outlined another scenario that could play out, which presents a bearish outlook for Bitcoin. He claimed that Bitcoin’s surge to this liquidity zone could be a fakeout to take liquidity and then move down again. However, Bitcoin experiencing that pump once it hits ,000 looks more likely, considering that crypto analyst James Check labeled the ,000 price level as where Bitcoin could enter an escape velocity phase.
Crypto analyst Adrian Zduńczyk also suggested that Bitcoin would likely turn that ,000 zone into support if it climbed to that level. He noted that Bitcoin has continued to consolidate inside its current ATH area for 14 weeks now, which is significant considering that this was an area where it had shown weakness before. Zduńczyk claims this is a “trend-promoting behavior” as resistance becomes the new support, and Bitcoin will continue to go higher.
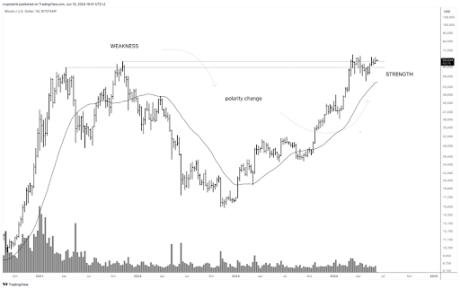
Meanwhile, crypto analyst Mikybull Crypto suggested that Bitcoin’s long-term consolidation in this range might be good, stating that the “longer the consolidation, the higher it moves when it breaks out.” He also remarked that Bitcoin’s bullish divergence also indicates “strong strength” for the flagship crypto. Mikybull Crypto expects Bitcoin to rise to ,000 and then 0,000 when this long-awaited breakout happens.
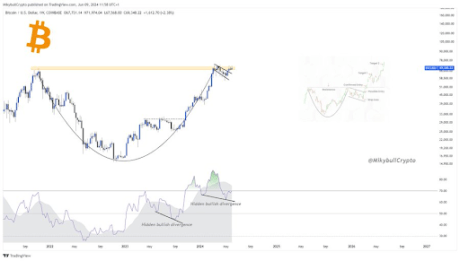
Crypto analyst Rekt Capital also noted that it is only a matter of time before the breakout happens. He had previously stated that a successful breakout for Bitcoin above the ,000 range would send it into the ‘parabolic uptrend’ phase of this market cycle.
Why BTC Dropped Below ,000
Bitcoin dropped below ,000 following the significant outflows the US Spot Bitcoin ETFs recorded on June 10. Data from Farside Investors shows these funds saw a cumulative total of .9 million in outflows, the first time these Spot Bitcoin ETFs recorded daily outflows since May 23.
Investors are believed to be waiting on the sidelines ahead of the US Consumer Price Index (CPI) inflation data and the US Federal Reserve interest rate decision on June 12. A lot of volatility is expected in the crypto market ahead of these events, which could determine the future trajectory of crypto assets.
Metaplanet Unveils ‘Bitcoin-First’ Strategy to Face Japan’s Economic Weakness
 Metaplanet, a Tokyo-listed public company, has unveiled a “bitcoin first” strategy to combat the Japanese economy’s weakness and the yen’s devaluation. In a document shared on social media, the company stated it will adopt bitcoin as a reserve asset, taking advantage of the available possibilities for increasing its holdings. Metaplanet Announces Bitcoin First Approach, Unveils […]
Bitcoin News
Bitcoin Price Turns Vulnerable As Indicators Point To More Weakness
Bitcoin price is struggling below the ,500 resistance. BTC could accelerate lower if there is a close below the ,000 support in the near term.
- Bitcoin is struggling and trading well below the ,500 resistance.
- The price is trading below ,500 and the 100 hourly Simple moving average.
- There is a key bearish trend line forming with resistance near ,420 on the hourly chart of the BTC/USD pair (data feed from Kraken).
- The pair could resume its decline unless there is a close above the ,500 level.
Bitcoin Price Faces Hurdles
Bitcoin price started a fresh decline below the ,800 level. BTC traded below the ,500 and ,200 support levels to move into a negative zone.
Finally, the pair tested ,000 and a low was formed near ,026. Recently, the price started a minor recovery wave above the ,200 level. The price climbed above the 23.6% Fib retracement level of the recent drop from the ,712 swing high to the ,026 low.
However, the bears are protecting a break above the ,500 resistance. The price is struggling to clear the 50% Fib retracement level of the recent drop from the ,712 swing high to the ,026 low.
Bitcoin is now trading below ,500 and the 100 hourly Simple moving average. Immediate resistance on the upside is near the ,400 level. There is also a key bearish trend line forming with resistance near ,420 on the hourly chart of the BTC/USD pair.
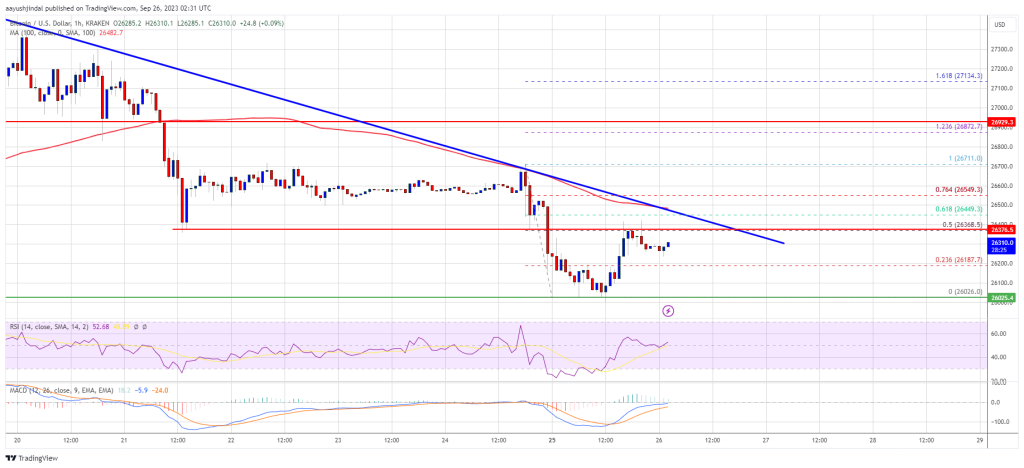
Source: BTCUSD on TradingView.com
The next key resistance could be near the ,500 level, above which the price could gain bullish momentum. In the stated case, the price could climb toward the ,000 resistance. Any more gains might call for a move toward the ,500 level.
More Losses In BTC?
If Bitcoin fails to start a fresh increase above the ,500 resistance, it could continue to move down. Immediate support on the downside is near the ,150 level.
The next major support is near the ,000 level. A downside break and close below the ,000 level might start another major decline maybe toward the next support at ,400. Any more losses might call for a test of ,000.
Technical indicators:
Hourly MACD – The MACD is now losing pace in the bearish zone.
Hourly RSI (Relative Strength Index) – The RSI for BTC/USD is now below the 50 level.
Major Support Levels – ,150, followed by ,000.
Major Resistance Levels – ,400, ,500, and ,000.
Bitcoin Cash Price Signals Fresh Increase Despite Weakness in BTC and ETH
Bitcoin Cash price is holding the key 0 support against the US Dollar. BCH seems to be aiming for a fresh increase toward the 5 and 0 levels.
- Bitcoin cash price is showing positive signs above the 0 level against the US Dollar.
- The price is trading below 0 and the 100 simple moving average (4 hours).
- There was a break above a major bearish trend line with resistance near 9 on the 4-hour chart of the BCH/USD pair (data feed from Kraken).
- The pair is likely to accelerate higher if it clears 7 and 0.
Bitcoin Cash Price Aims Higher
In the past few days, Bitcoin Cash price saw a steady decline below 5. BCH even traded below the 5 level, but the downsides were limited compared to Bitcoin and Ethereum.
The price remained well-bid near the key 0 support. A low has formed near 0 and the price is now attempting a fresh increase. It broke the 5 level. There was a break above a major bearish trend line with resistance near 9 on the 4-hour chart of the BCH/USD pair.
The price is now testing the 23.6% Fib retracement level of the downward move from the 8 swing high to the 0 low. However, Bitcoin Cash is now trading below 0 and the 100 simple moving average (4 hours).
Immediate resistance is near the 7 level and the 100 simple moving average (4 hours). The next major resistance is near 5 or the 50% Fib retracement level of the downward move from the 8 swing high to the 0 low.
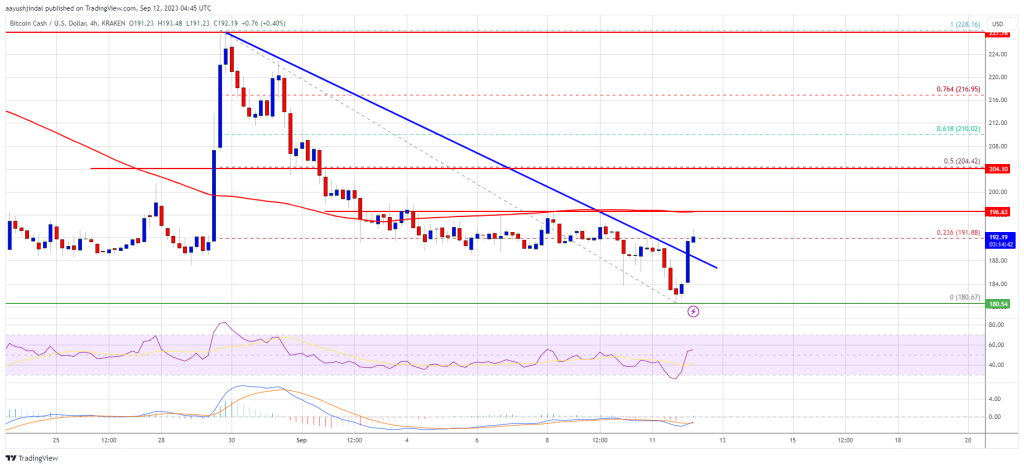
Source: BCH/USD on TradingView.com
Any further gains could lead the price toward the 0 and 5 resistance levels in the near term. The next major hurdle is near the 0 level.
Dips Supported in BCH?
If Bitcoin Cash price fails to clear the 5 resistance, it could start a fresh decline. Initial support on the downside is near the 5 level.
The next major support is near the 0 level, where the bulls are likely to appear. If the price fails to stay above the 0 support, the price could test the 8 support. Any further losses could lead the price toward the 0 zone in the near term.
Technical indicators
4-hour MACD – The MACD for BCH/USD is gaining pace in the bullish zone.
4-hour RSI (Relative Strength Index) – The RSI is currently above the 50 level.
Key Support Levels – 5 and 0.
Key Resistance Levels – 7 and 5.
Dogecoin Price (DOGE) Poised for Continued Weakness Below $0.07
Dogecoin is down over 10% and trading below the .070 resistance against the US Dollar. DOGE could extend losses if there is a move below .065.
- DOGE is currently trading in a bearish zone below .072 against the US dollar.
- The price is trading well below the .070 zone and the 100 simple moving average (4 hours).
- There is a key bearish trend line forming with resistance near .071 on the 4-hours chart of the DOGE/USD pair (data source from Kraken).
- The price could correct higher but upsides might be limited above .072.
Dogecoin Price Extends Losses
After facing a strong rejection near .078, Dogecoin price started a fresh decline. DOGE declined over 10% and traded below the .0720 support zone to enter a bearish zone, similar to Bitcoin and Ethereum.
The price even settled below the .070 level. Finally, it tested the .065 zone. A low is formed near .0657 and the price is now consolidating losses. It is approaching the 23.6% Fib retracement level of the recent decline from the .0772 swing high to .0657 low.
DOGE is now trading well below the .070 zone and the 100 simple moving average (4 hours). There is also a key bearish trend line forming with resistance near .071 on the 4-hours chart of the DOGE/USD pair.
On the upside, the price is facing resistance near the .0685 level. The first major resistance is near the .070 level or the trend line. It is near the 50% Fib retracement level of the recent decline from the .0772 swing high to .0657 low.
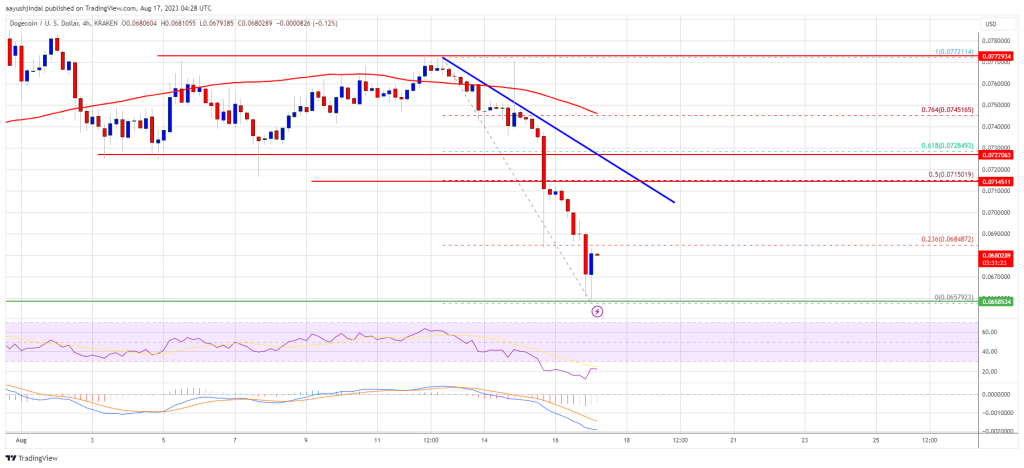
Source: DOGEUSD on TradingView.com
A close above the .072 resistance might send the price toward the .075 resistance. The next major resistance is near .0780. Any more gains might send the price toward the .080 level.
More Losses in DOGE?
If DOGE’s price fails to gain pace above the .0720 level, it could continue to move down. Initial support on the downside is near the .0655 level.
The next major support is near the .0632 level. If there is a downside break below the .0632 support, the price could decline further. In the stated case, the price might decline toward the .060 level.
Technical Indicators
4 Hours MACD – The MACD for DOGE/USD is now gaining momentum in the bearish zone.
4 Hours RSI (Relative Strength Index) – The RSI for DOGE/USD is now below the 50 level.
Major Support Levels – .0655, .0632, and .0600.
Major Resistance Levels – .070, .072, and .075.
Bitcoin, Ethereum Technical Analysis: Dollar Weakness Pushes BTC Higher, as Biden Fails to Secure Debt Deal

Bitcoin rebounded on Tuesday, as a result of weakness in the U.S. dollar, following failed talks to tackle the debt ceiling crisis. President Biden stated, “We reiterated once again that default is off the table and the only way to move forward is in good faith toward a bipartisan agreement.”
Bitcoin
Bitcoin (BTC) rose above ,000 on Tuesday, as a result of weakness in the greenback, following failed talks to increase the U.S. debt ceiling.
After dropping to a low of ,714.18 to start the week, BTC/USD surged to a peak of ,434.68 earlier today.
Tuesday’s gains saw bitcoin marginally break out of a resistance level at the ,300 mark.
This coincided with the relative strength index (RSI) climbing above a ceiling of its own, at 44.00.
At the time of writing, the index is now tracking at 47.10, with an upcoming zone of 50.00 a likely target for bulls.
Should they reach this point, there is a reasonable chance that bitcoin will trade above ,600.
Ethereum
Ethereum (ETH) also surged higher in today’s session, as prices continued to move away from a key level of support.
ETH/USD hit an intraday high of ,869.34 on Monday, 24 hours removed from trading at a bottom of ,809.54.
The move came as the world’s second largest cryptocurrency bounced away from a recent floor at ,790.
Looking at the chart, today’s surge comes following a slight breakout of a ceiling on the RSI at the 50.00 mark.
As of writing, price strength is now tracking at 51.97, with the next visible level of resistance at 55.00.
Register your email here to get weekly price analysis updates sent to your inbox:
Could momentum be set to finally rise in crypto markets? Leave your thoughts in the comments below.
Binance Coin Shows Weakness As Price Sits On Key Support; Is $200 Possible?
- BNB’s price fails to hold amidst market turmoil as the price falls back to its key support zone with a range-bound movement.
- BNB’s price continues to show strength after a bearish downtrend with the market’s current state, as things look uncertain for most traders and investors.
- BNB’s price continues to hold 0 on the daily timeframes as the price aims for a bounce above the 50 Exponential Moving Average (EMA)
The price of Binance Coin (BNB) has been a standout performer in recent weeks rallying from a low of 0 to a high of 0 before facing rejection due to the current market state that has affected most crypto projects. The crypto market has seen some drastic shift in sentiment, with Binance Coin (BNB) and the price of other altcoins battling for survival after the news broke that Binance would not be taking over FTX and the company had gone bankrupt. Previous months saw the price of most altcoins trend higher as many produced gains of over 200%, with many hoping for more recovery bounce. Still, these expectations were cut short by the uncertainty surrounding the crypto market, leading to much fear about where the market is headed. (Data from Binance)
Binance Coin (BNB) Price Analysis On The Weekly Chart
The crypto space has seen a lot of turbulence in the last few days, with many altcoins struggling to show strength after losing key support that was holding off price declines.
The current market uncertainty has caused traders and investors to be hesitant to purchase altcoins, as there is no guarantee that they will rise in value any time soon.
The news of other exchanges being in the mix of the FTX saga has raised more fears as many investors and traders shy away from investing in some projects, including the price of BNB suffering some major prices as it lost its support of 0.
BNB’s price declined to a weekly low of 0 before bouncing off this region, showing some great strength to a region of 5 as the price aims to break higher. The price of BNB needs to flip the region of 0 for BNB price to trend higher and regain its bullish structure.
Weekly resistance for the price of BNB – 0.
Weekly support for the price of BNB – 0.
Price Analysis Of BNB On The Daily (1D) Chart

The price of BNB remains considerably strong in the daily timeframe as the price trades above 0 support after bouncing off from the region of 0.
If the price of BNB breaks above 0, we could see more rallies for BNB price; a break below a region of 0-260 would lead to more sell-offs for BNB with a possibility of price trending to a region of 0.
Daily resistance for the BNB price – 0.
Daily support for the BNB price – 0-0.
Featured Image From zipmex, Charts From Tradingview
NewsBTC