 Bitcoin continues to trade near a crucial price level, with the downside appearing limited but a lack of bullish momentum evident. The leading cryptocurrency stands around the ,000 to ,000 mark, a critical onchain realized price that could either support the price or signal a correction, according to the latest analysis from Cryptoquant researchers. Cryptoquant: […]
Bitcoin News
Former Bitmex CEO Arthur Hayes: A Weak Yen Solution Might Propel Bitcoin to $1 Million
 Arthur Hayes, former CEO of Bitmex and current CIO of Maelstrom, has predicted the geopolitical and economic dynamics that will be taken to equilibrate the exchange rate between the U.S. dollar and the Japanese yen might propel bitcoin prices to million. Hayes states that eventually, the U.S. will be forced to act by printing […]
Bitcoin News
Ordinals Founder Casey Rodarmor Warns Bitcoin Maxis That ‘Whining’ Makes Them ‘Look Weak’

Casey Rodarmor, the developer of the Ordinals protocol, has called out ideological Bitcoin maxis for their views on inscriptions and censoring transactions on the Bitcoin blockchain. Rodarmor stated that the “whining” around the protocol and its usage of block space make them “look weak,” contradicting the idea that Bitcoin is “unstoppable internet money.”
Ordinals Dev Casey Rodarmor Blasts Bitcoin Maxis ‘Whining’
Casey Rodarmor, the developer of the Ordinals protocol, which enables the possibility of issuing inscriptions, media embedded directly on the Bitcoin blockchain, has called out Bitcoin maxis for its complaints.
In a recent blog post, Rodarmor explained that the philosophy of the so-called Bitcoin maxis was incompatible with their beliefs, making them “look weak” with their “whining” on the use of ordinals and inscriptions.
Rodarmor stated:
Simultaneously believing that Bitcoin is unstoppable internet money and thinking that a bunch of retards publishing JPEGs on-chain is any kind of problem is a contradiction.
Rodarmor also criticized the attempts to “censor” inscriptions, insisting that building code to achieve this goal would be detrimental to the ecosystem, given that it would also enable other kinds of censorship in Bitcoin.
The rise of the Ordinals protocol has caused a series of discussions in the base of the Bitcoin community, with some developers and users considering it a form of “spam,” even leading to talks of a possible hard fork. Nonetheless, for Rodarmor, there is a simpler solution to the issue.
He discussed that ignoring them is the best choice, as the market will eventually price out inscriptions when more use cases compete for Bitcoin block space. He explained:
There will always be some high-value inscriptions, but they don’t compete seriously with hard money and uncensorable transactions.
“Bitcoin’s destiny is high fees. Embrace it,” he concluded.
What do you think about Casey Rodarmor’s take on the attitude that Bitcoin maxis have on ordinals and inscriptions? Tell us in the comments section below.
Clear Skies: Why Bitcoin Overhead Resistance Is Weak
Bitcoin price is only at ,500 — a far cry from former all-time highs around ,000.
However, one visual technical analysis tool could show that overhead resistance is weak, and that the top cryptocurrency could rip right through what’s left. Could BTCUSD be back at all-time highs faster than most are ready for?
Bitcoin Price Breaks Above The Monthly Ichimoku Cloud
Technical analysts rely on a variety of tools to help provide signals to visually inspect and either manually or automatically take positions based on the results.
One such tool, created by a Japanese journalist Goichu Hosoda, is called the Ichimoku. Hosoda was nicknamed “Ichimoku Sanjin” which loosely translates to “what the man in the mountain sees.” The idea behind the Ichimoku is that it provides an “at a glance” view of all market conditions.
For example, the cloud plots where future support and resistance may lie. Meanwhile, the Tenkan-sen and Kijun-sen act as trend-following tools that cross bearish and bullish depending on price action. These spans can also act as support and resistance.
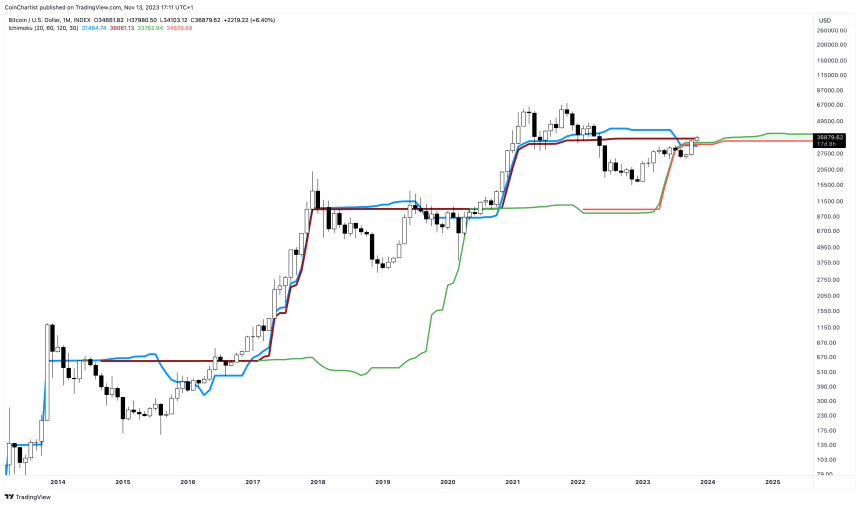
With all that out of the way, all it takes is “one glance” at the chart below and we can see there is very little 1M BTCUSD resistance left.
Clear Skies Above Major Resistance, But Minor Pullbacks A Plenty
Also at just a glance, it is possible to see how each time Bitcoin price passed through these spans and the Ichimoku cloud, an extended bull market formed.
It is important to note, however, that the Tenkan-sen (blue) and Kijun-sen (maroon) are still crossed bearish. But this also happened prior to each bull run.
Additionally, the lagging span has been omit from this chart. Called the Chikou span in Japanese, the lagging span shows where former support and resistance used to be, which means Bitcoin does have some less significant resistance levels to contend with at around ,000 and again around ,000.
Beyond ,000, the Ichimoku shows nothing but air. Could this really mean clear skies for Bitcoin once the Ichimoku cloud is officially left behind?
This chart appeared initially in Issue #27 of CoinChartist VIP. Click here to read the rest of the issue.
Bitcoin, Ethereum Technical Analysis: BTC Falls Briefly Below $26,000, as Sentiment Remains Weak
Bitcoin fell below the ,000 level on Tuesday, as sentiment in the cryptocurrency market remained bearish. The latest drop comes despite price being oversold, following recent declines. As of writing, the global market cap is down 0.42%.
Bitcoin
Bitcoin dropped marginally below the ,000 level during today’s session, as overall sentiment in the market remained bearish.
BTC/USD fell to an intraday low of ,846.09 on Tuesday, following a high of ,220.20 earlier in the day.
Price has since rebounded, with the world’s largest cryptocurrency currently trading at ,088.64.
The decline came as the relative strength index (RSI) continued to hover close to a support point of 20.00.
At the time of writing, its exact reading is at 20.90, which is still deep in bear territory, with the next visible ceiling at 29.00.
Should bulls push price strength towards this point, BTC could end up near the ,000 level.
Ethereum
Ethereum (ETH) continued to hover near a support point of its own on Tuesday, as price consolidation continued.
Following a peak of ,679.76 to start the week, ETH/USD slipped to an intraday bottom at the ,651.96 mark.
Overall, ethereum has traded around a key price floor of ,650 since last Thursday’s drop to a low of ,540.
After falling below 20.00 over the weekend, the RSI has edged slightly higher in recent days, and is now tracking at 24.82.
A point of resistance at 27.00 is fast approaching, and should this point be broken, there is a good chance ETH will reenter the ,700 zone.
Should the asset break out of this point, ETH will likely move back above ,700.
Register your email here to get weekly price analysis updates sent to your inbox:
Will market consolidation end this week? Leave your thoughts in the comments below.
Ethereum Price Plunge To $1,800 On The Horizon, As Bulls Show Weak Hands
Ethereum price is struggling to rise above the ,850 zone against the US Dollar. ETH could drop toward the ,800 support in the near term.
- Ethereum is trading in a range below the ,850 and ,860 resistance levels.
- The price is trading below ,850 and the 100-hourly Simple Moving Average.
- There is a key contracting triangle forming with support near ,840 on the hourly chart of ETH/USD (data feed via Kraken).
- The pair could drop toward ,800 if there is no close above the ,860 resistance.
Ethereum Price Dips Again
Ethereum’s price remained below the ,860 resistance zone and reacted to the downside. ETH topped near ,853 and declined below the ,840 level, similar to Bitcoin.
A low is formed near ,837 and the pair is now consolidating losses. It climbed above the 23.6% Fib retracement level of the recent decline from the ,853 swing high to the ,837 low. Ether is now trading below ,850 and the 100-hourly Simple Moving Average.
There is also a key contracting triangle forming with support near ,840 on the hourly chart of ETH/USD. On the upside, the price might face resistance near the ,845 level or the 100-hourly Simple Moving Average.
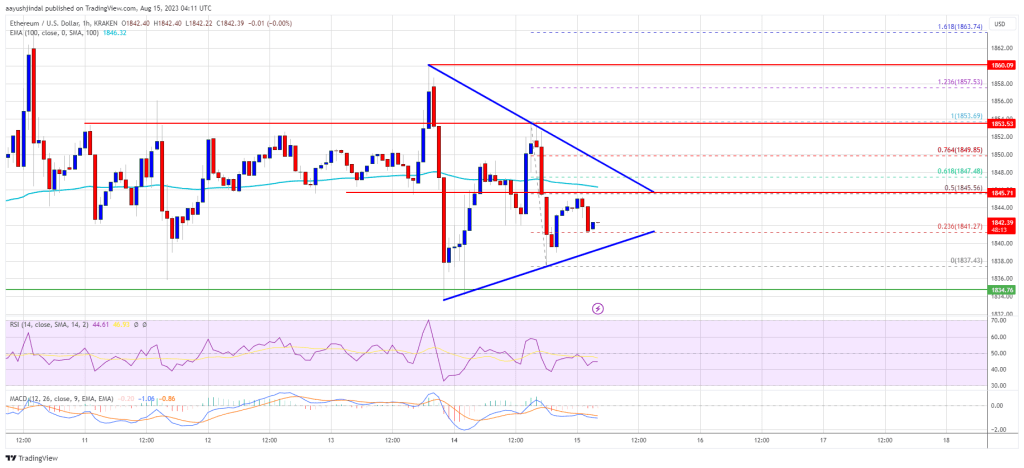
Source: ETHUSD on TradingView.com
The 50% Fib retracement level of the recent decline from the ,853 swing high to the ,837 low is also near ,845. The first key resistance is near the ,850 level. The next key resistance is near the ,860 level. A close above the ,860 level could send the price toward ,880. Any more gains might send the price toward the ,920 pivot level, above which the price could rise toward the ,000 zone.
More Losses in ETH?
If Ethereum fails to clear the ,850 resistance, it could continue to move down. Initial support on the downside is near the ,840 level or the triangle lower trend line.
The first major support is near the ,835 zone. If the bulls fail to protect the ,835 support, there could be more losses. The next major support is near the ,800 support level. Any more losses might send the price toward the ,740 level in the near term.
Technical Indicators
Hourly MACD – The MACD for ETH/USD is losing momentum in the bearish zone.
Hourly RSI – The RSI for ETH/USD is now below the 50 level.
Major Support Level – ,835
Major Resistance Level – ,850
Ethereum Price Rally To $2,000 On The Horizon, As Bears Show Weak Hands
Ethereum price started a fresh increase above the ,800 resistance against the US Dollar. ETH is showing positive signs and might rally towards ,000.
- Ethereum remained strong above the ,700 zone and recovered losses.
- The price is trading above ,780 and the 100 hourly simple moving average.
- There is a key bullish trend line forming with support at ,780 on the hourly chart of ETH/USD (data feed via Kraken).
- The pair could rally towards ,000 if there is a close above the ,850 resistance.
Ethereum Price Aims Higher
Ethereum price started a downside below the ,750 support. However, the bulls were active above the ,700 support zone. A low as formed near ,713 and ETH price started a fresh increase, similar to bitcoin.
The price gained pace above the ,750 and ,780 resistance levels. There was a clear move above the ,800 resistance zone. The upward move was such that the price even spiked above the ,850 resistance zone. A high is formed near ,858 and the price is now consolidating gains.
There was a minor decline below the 23.6% Fib retracement level of the upward move from the ,713 swing low to ,858 high. Ether price is now trading above ,780 and the 100 hourly simple moving average.
There is also a key bullish trend line forming with support at ,780 on the hourly chart of ETH/USD. On the upside, the price is facing resistance near the ,830 zone. The next major resistance is near the ,850 zone. A close above the ,850 resistance zone might start a strong increase.
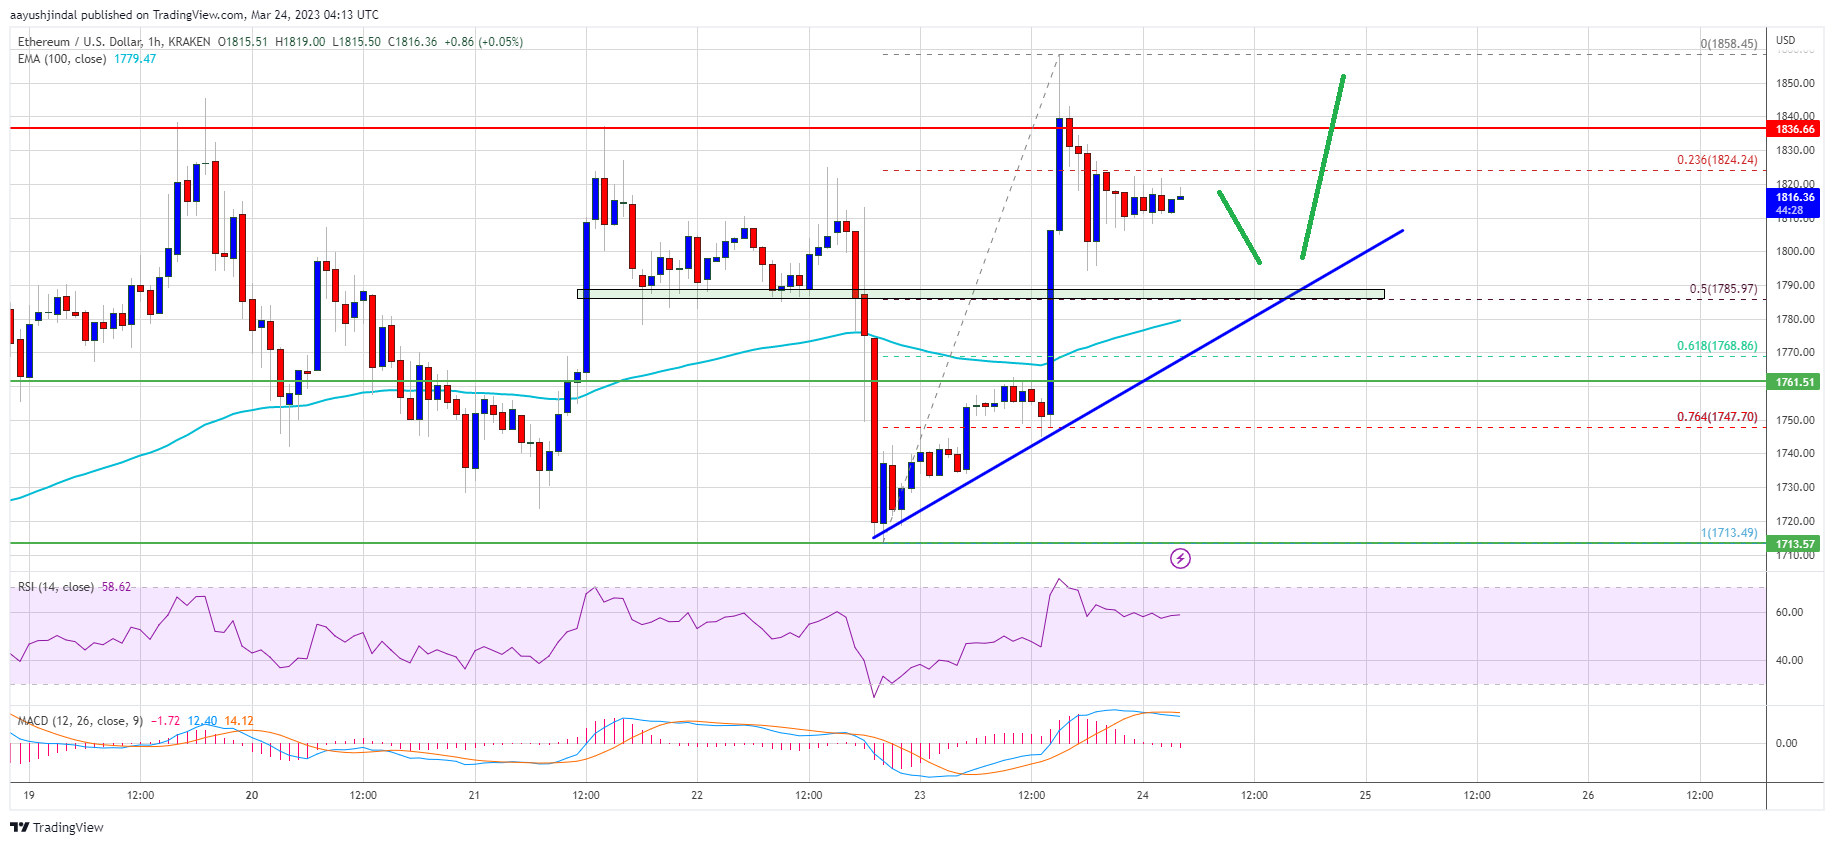
Source: ETHUSD on TradingView.com
The next aim for the bulls might be ,000. Any more gains could set the pace for a test of the ,120 resistance zone in the near term.
Downside Break in ETH?
If ethereum fails to clear the ,850 resistance, it could start another decline. An initial support on the downside is near the ,790 level and the trend line.
The next major support is near the ,765 zone or the 61.8% Fib retracement level of the upward move from the ,713 swing low to ,858 high. If there is a break below ,765, the price might gain bearish momentum and drop towards ,720. Any more losses might call for a test of the ,660 level.
Technical Indicators
Hourly MACD – The MACD for ETH/USD is now losing momentum in the bullish zone.
Hourly RSI – The RSI for ETH/USD is now above the 50 level.
Major Support Level – ,765
Major Resistance Level – ,850
Paxful Founder Says The Bitcoin Pump To $26,000 Is Weak
Despite the banking crisis in the United States and the latest inflation data, Bitcoin surged this week, reaching a nine-month high above ,000. However, Paxful founder, Ray Youssef, remains doubtful of the uptrend. In a tweet on March 15, he said the recent BTC leg up is “weak.”
Bitcoin Surges Amidst Bank Crashes
Much of Bitcoin’s price trouble last week stemmed from uncertainty surrounding some of the crypto industry’s biggest banking partners going bust.
Silvergate filed for voluntary liquidation while Signature Bank was closed. Silicon Valley Bank (SVB) experienced a bank run and was placed under receivership by California regulators.
Banking stocks dropped in response to this crisis, but crypto assets are relatively firm. Since Friday, BTC’s price has risen approximately 29%, rallying above ,000 on March 14.
While Bitcoin is relatively higher, Youssef thinks the upside momentum is weak since the pump has low trading volumes. Trading volume is a measure of participation. Traders use this indicator to measure participation and interest.
Based on this observation, he advises traders to take their profits and wait for a cool-off before loading up.
This btc pump has low volume, even the ordinals pump had more volume. I would beware and take a bit of profit. The empire shall continue striking back hard. Buy back later and keep a 2 year time frame always.
— Ray Youssef (@raypaxful) March 15, 2023
Dropping Inflation And Binance’s Crypto-Buying Spree
The price surge coincides with news that inflation in the United States is gradually falling, in line with economists’ expectations.
The Bureau of Labor Statistics’ Consumer Price Index (CPI) reading on Tuesday showed year-on-year inflation had cooled to 6% in February.
Signs of declining inflation may signal that the Federal Reserve (Fed) will stop increasing interest rates in the coming months.
The central bank has been increasing interest rates over the past year to combat rising inflation following months of quantitative easing in 2020.
Early this week, Binance, the world’s largest crypto exchange by client count, said it would convert their billion industry recovery fund to, among other coins, Bitcoin.
Changpeng Zhao “CZ,” the Binance CEO, said this decision follows the banking crisis in the United States and “changes in stablecoins.”
“Given the changes in stablecoins and banks, Binance will convert the remaining billion Industry Recovery Initiative funds from BUSD to native crypto, including BTC, BNB, and ETH. Some fund movements will occur on-chain. Transparency.”
After CZ’s statement, data showed Bitcoin being deposited to Binance.
Analyst James V. Straten said the decision to purchase coins, including BTC and Ethereum, is why there has been a spike in volatility which is further increased by macro factors.
The Bitcoin price is currently stable but is below the ,000 level.
Bitcoin On-Chain Data Shows Weak Baseline For 2023: Report
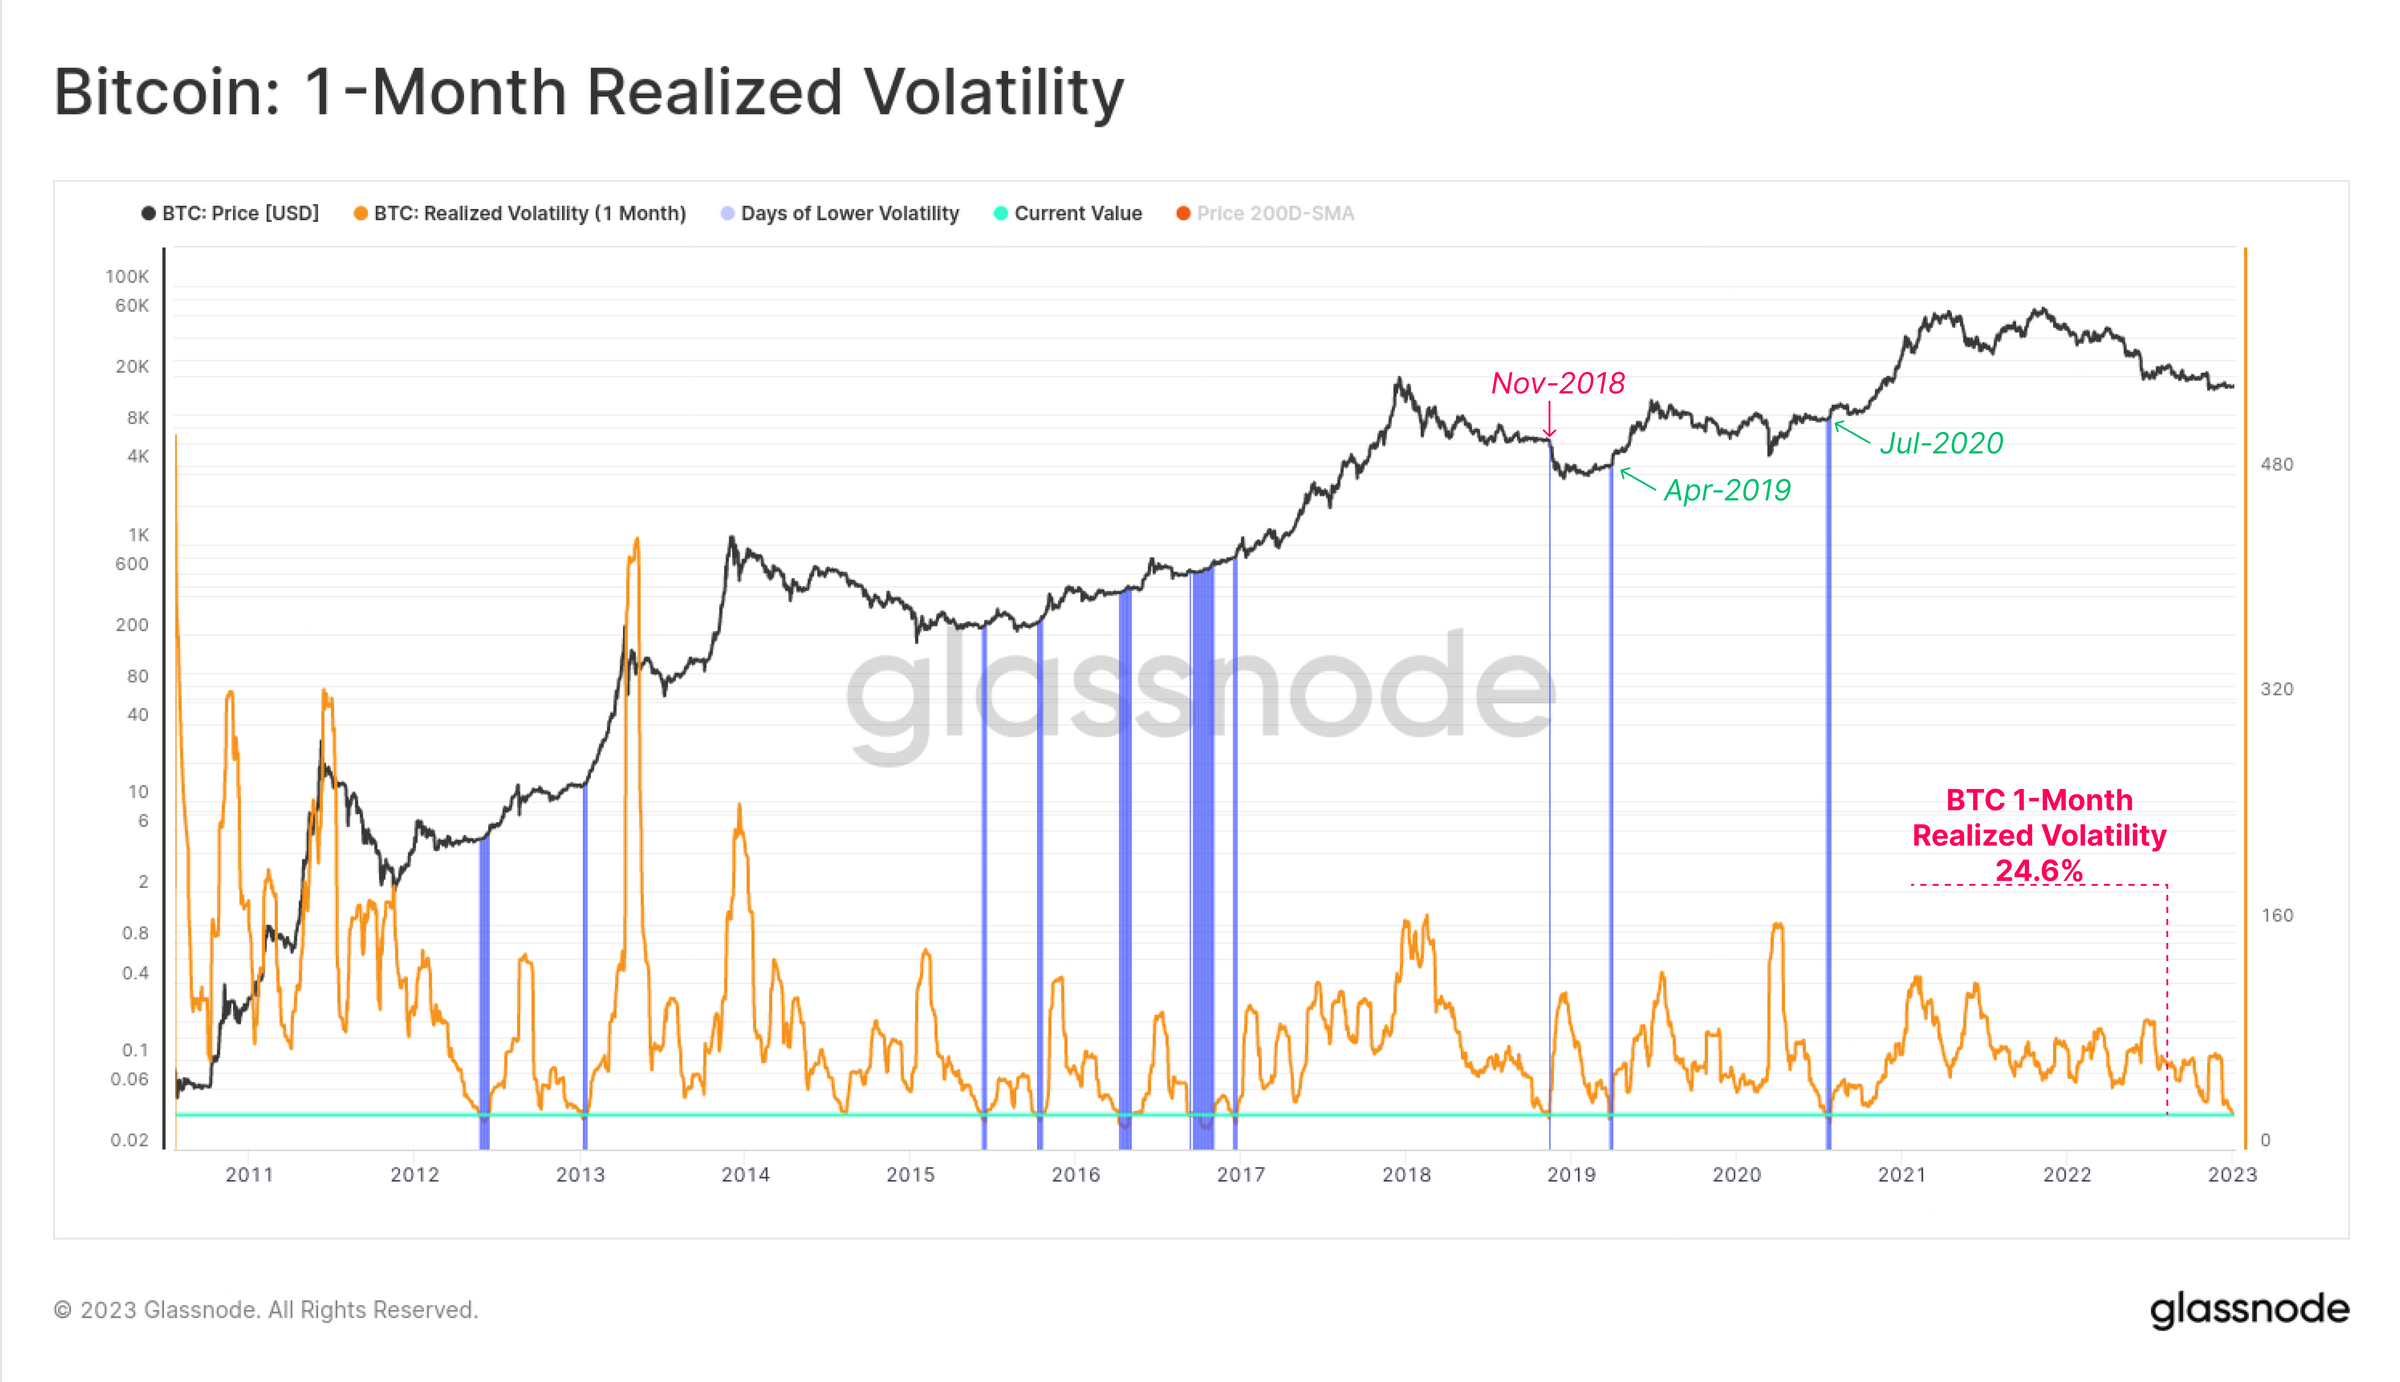
Even though Bitcoin (BTC) and the broader crypto market are experiencing an upswing in the first days of the new year, on-chain data shows that the market remains in a deep slumber. As Glassnode explains in its latest report, the BTC price has shown historically low volatility over the past weeks.
And according to the on-chain data for Bitcoin, there is currently little reason to believe that the boredom in the market will change quickly. However, if a move does occur, it will likely be an explosive market move, as in previous cycles when volatility was extremely low.
To support this thesis, Glassnode cites Bitcoin’s realized volatility over the last month, which is at a multi-year low of 24.6%. As the chart below shows, there have been a few times in Bitcoin’s history when it has been this low. In most cases, BTC saw a rally after the market awakened; only in one case, in November 2018, did the price fall dramatically (-50%) lower.
Bitcoin Network Usage Is Low
Also, the weak baseline for Bitcoin is identified by Glassnode in continued restrained network usage. While on-chain activity increased after the FTX collapse, the uptick briefly leveled off later. The monthly average of new Bitcoin addresses is approaching the annual average again.
The overall transaction value of the network is in free fall. While the daily transfer volume was still around billion in the third quarter of 2022, it is currently only .8 billion/day. The value is thus back at the level before the bull year 2020.
According to Glassnode, this indicates a displacement of institutional capital. This is reflected in the fact that the share of transfers of more than million has fallen from 42.8% before the collapse of FTX to only 19.0%. Glassnode states:
This suggests a significant lull in institutional sized capital flows, and perhaps a serious shaking of confidence occurring among this cohort. It may also reflect, in part, and sadly, an expulsion of the questionable capital flows associated with the FTX/Alameda entities.
One indicator of a breakout from boredom could be the inflows and outflows on exchanges. But again, Glassnode notes that the on-chain data does not yet signal any momentum for an explosive move. Bitcoin inflows are currently between 0 million and 0 million per day, a far cry from the billions seen in 2021-22, according to Glassnode.
Major Indicator Remains Bearish
According to the research firm, the Realized Cap is one of the most important metrics in on-chain analysis. Unfortunately, the metric currently gives BTC investors just as little hope for a change anytime soon. The Bitcoin Realized Cap has declined 18.8% since the all-time high, representing a net capital outflow of -.4 billion from the network.
“This makes for the second largest relative decline in history, and the largest in terms of USD realized losses,” Glassnode notes, pointing at the following chart. Only in 2011/2012, the bear market drawdown was worse by 24%.
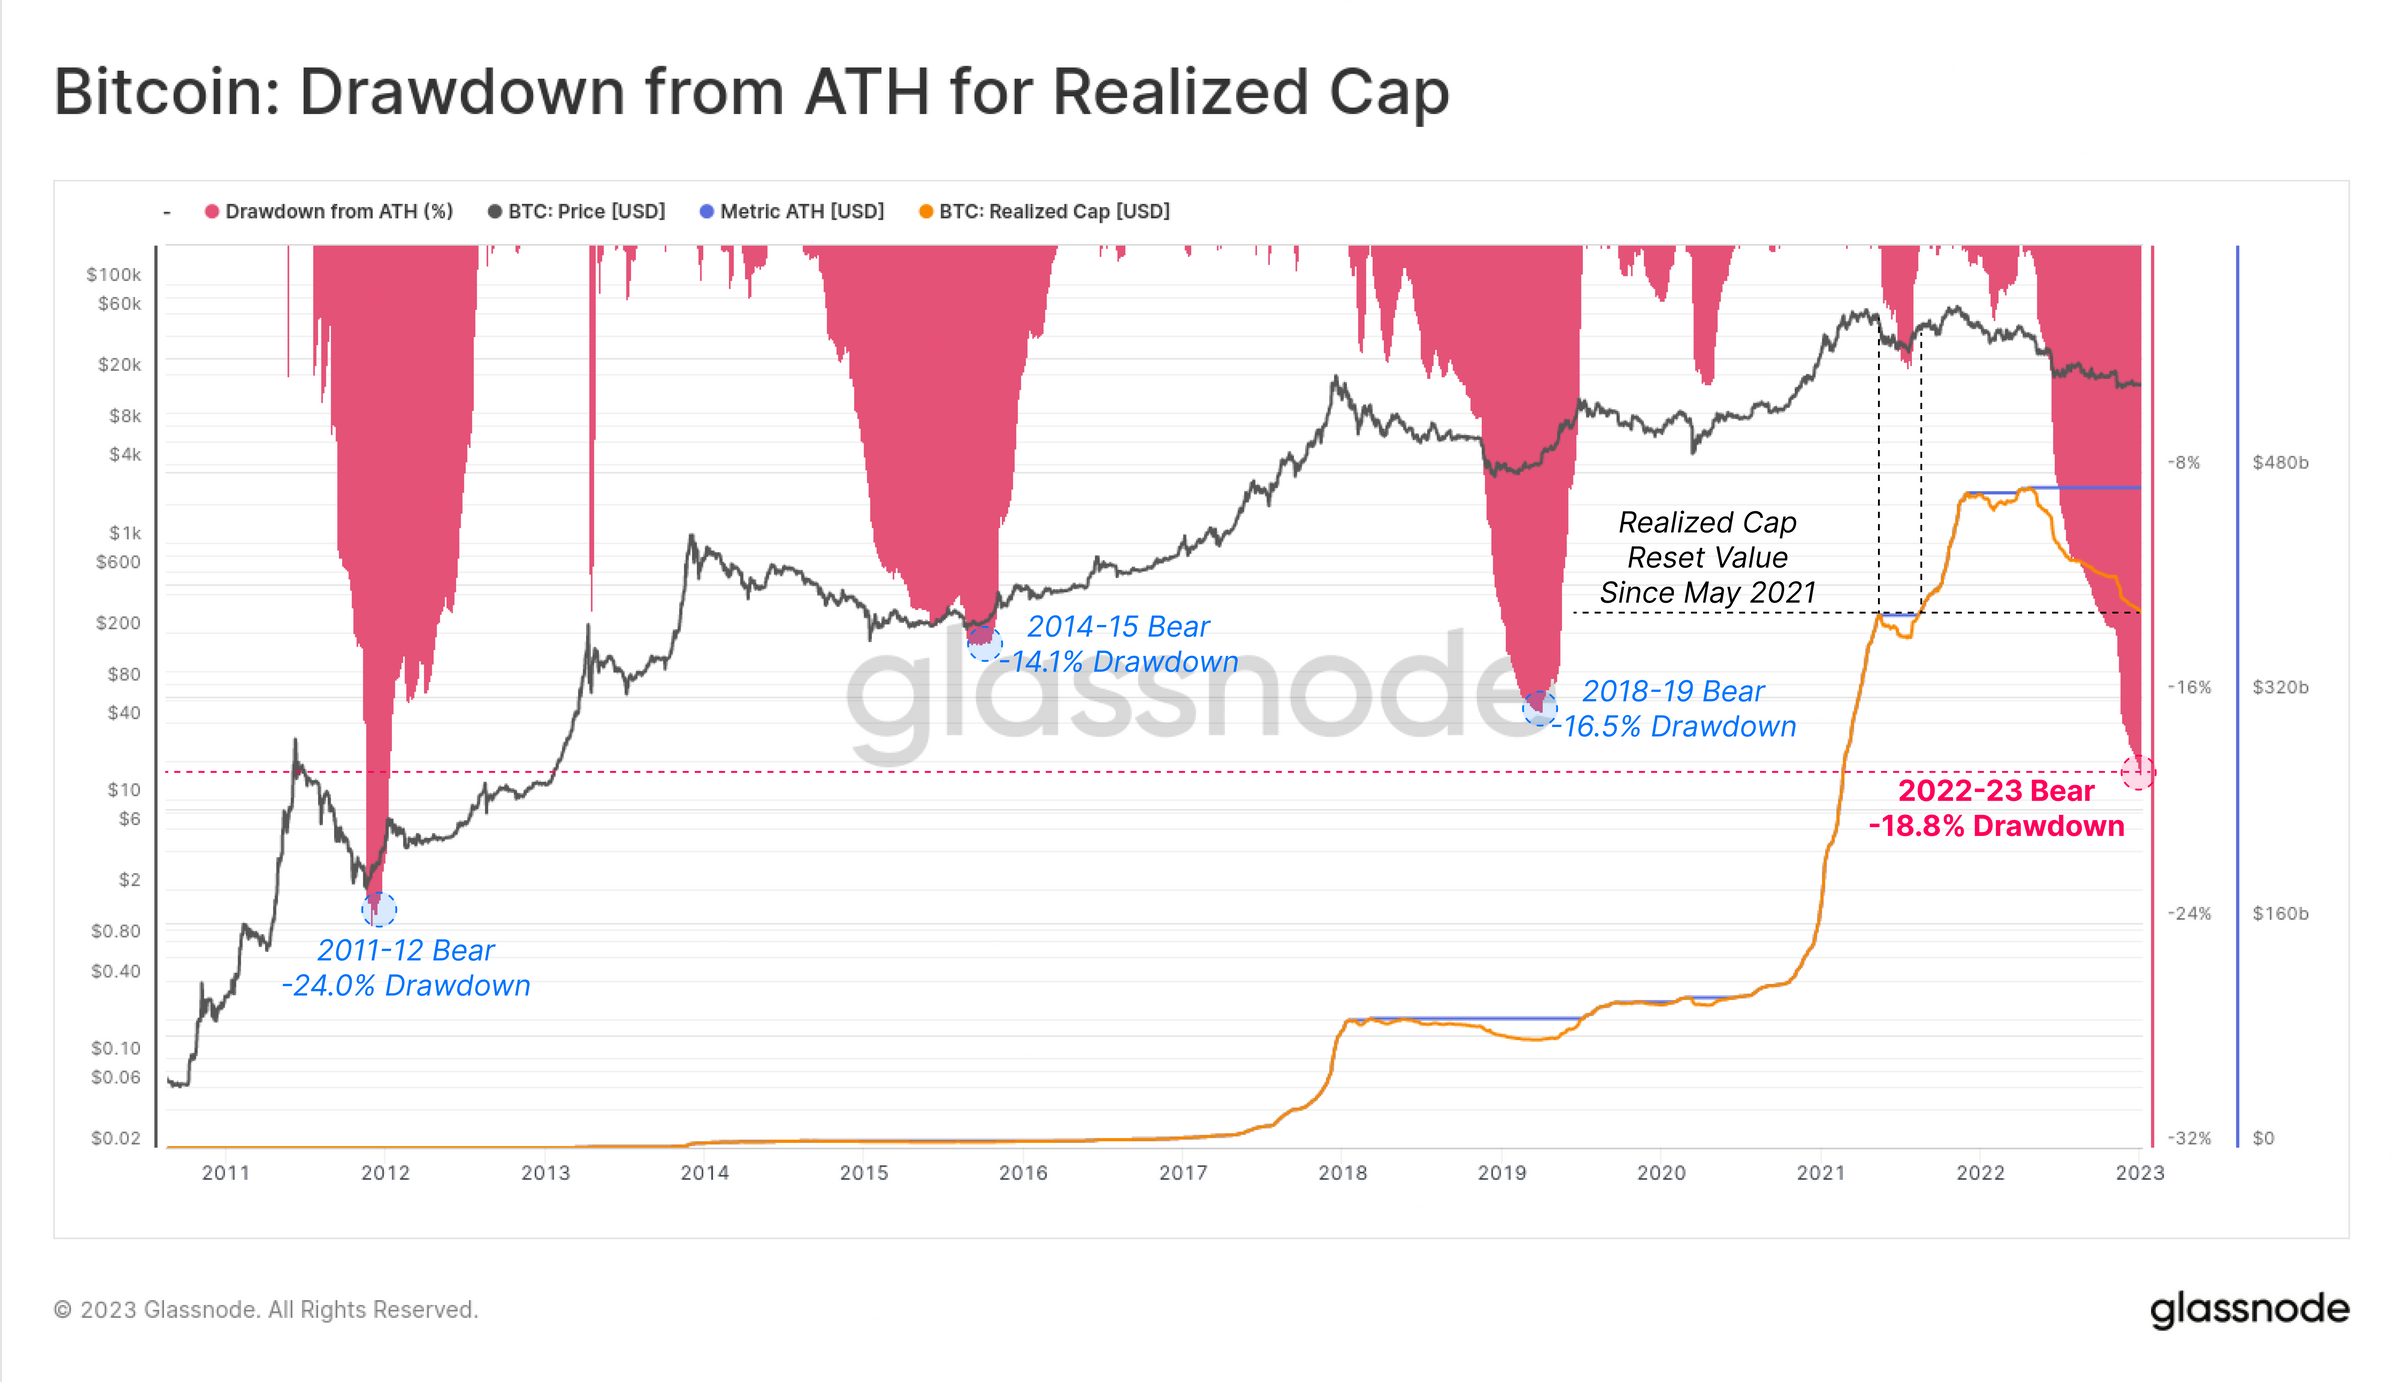
Concluding the report, Glassnode says:
[I]t is rare for such conditions to stick around for long. Past occasions where BTC and ETH volatility was this low have preceded extremely volatile market environments, with past examples trading both higher and lower.
At press time, the BTC was slowly grinding higher in the 1-day chart. The price stood at ,268.
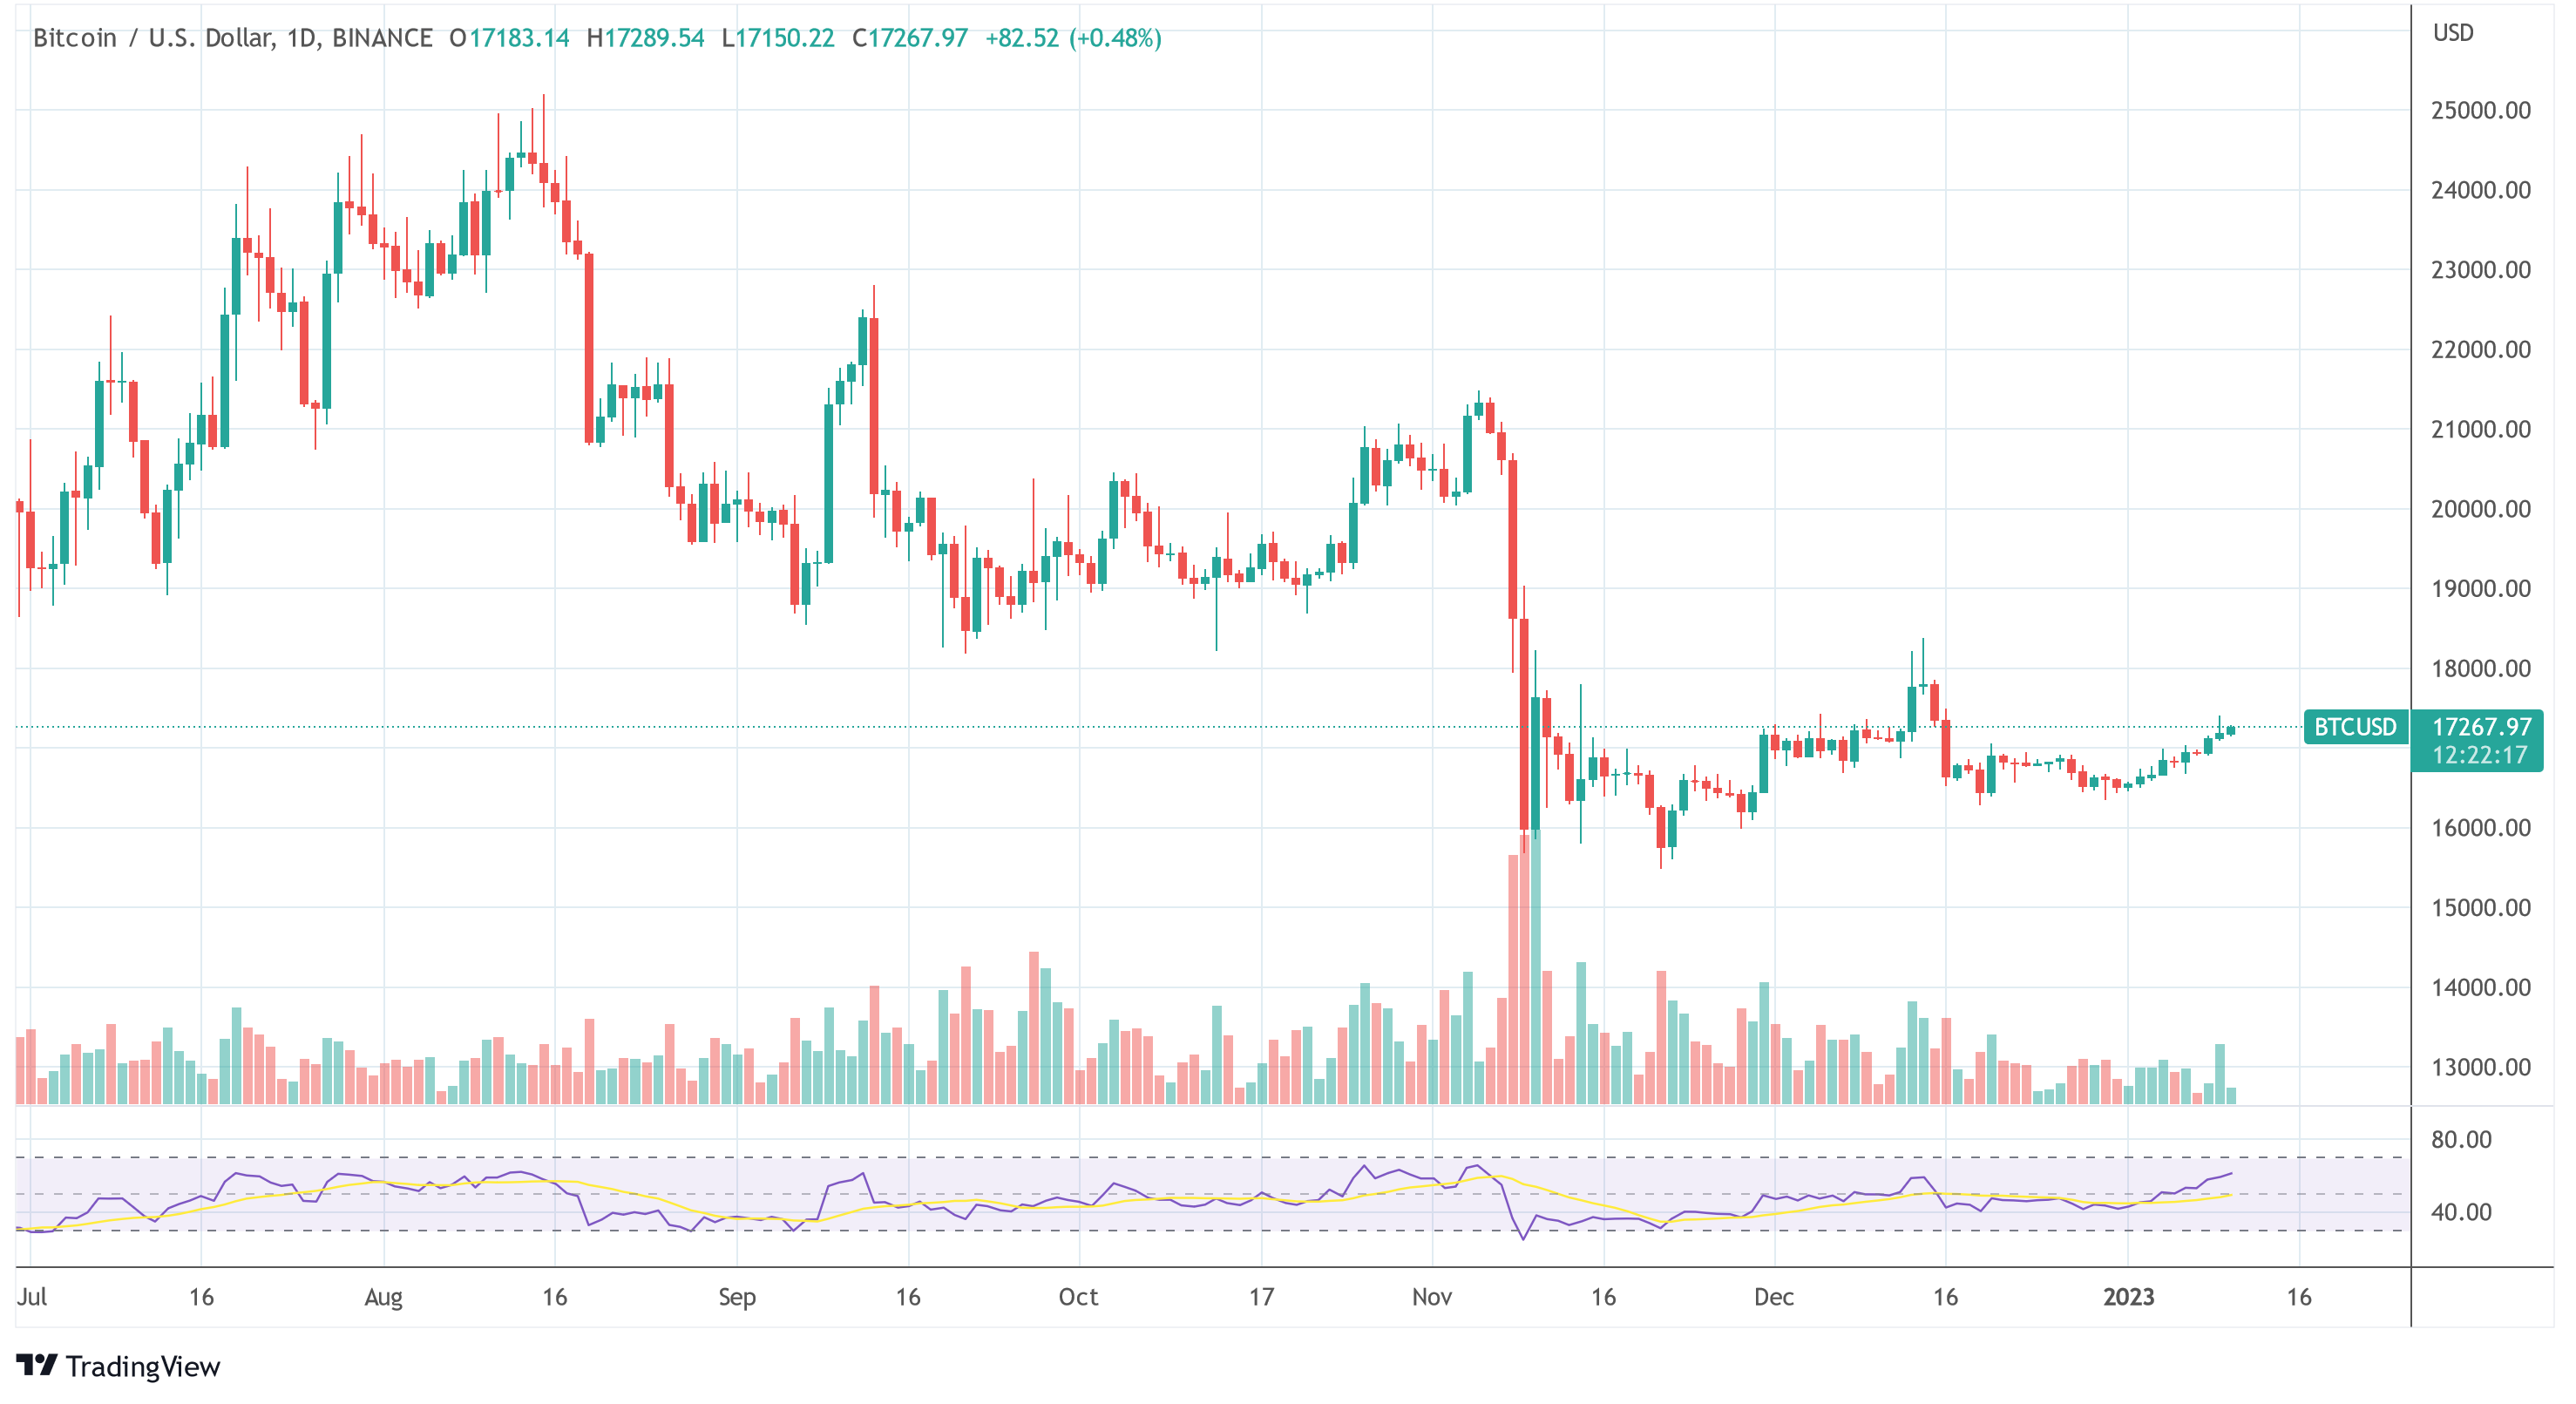
Featured image from Jievani Weerasinghe / Unsplash, Chart from TradingView.com
Fed Interest Rate Hike Triggers Pullback, Is Bitcoin Headed For A Weak Finish?
Bitcoin had been riding the euphoric high from the CPI data released on Tuesday which showed that inflation was finally slowing down in the United States. The digital asset had been able to clear ,000 for the first time since the FTX collapse as a result of this. However, the FOMC announcement that would follow on Wednesday would shock the market back into its shell, sending bitcoin’s price spiraling downwards once more.
Bitcoin Reels From Announcement
Even though the interest rate hike was not as high as previous ones, it still had some effect on the crypto market. Just after the announcement, bitcoin had rallied to a local peak of ,300 before starting back down once more. However, the overall outlook toward the FOMC meeting remains positive during this time.
Dmitry Ivanov, CMO at CoinsPaid, notes this positivity has come with the interest rate hike that came out to only 50 basis points (BPS). “The digital currency ecosystem is beaming with positivity with respect to the interest rate hike that saw the US Federal Reserve less aggressive than it has been,” Ivanov told NewsBTC. “Of particular interest to industry stakeholders are the fact that corporate investors will have more money on their balance sheet with a reduced borrowing cost, and this can be invested in alternative assets like Bitcoin.”
Bitcoin has since returned to the levels where it was trending before the FOMC announcement but this renewed positive outlook in the financial markets has worked to help it maintain its value above ,600 for the most part.
Will BTC Finish 2022 Weak?
With only two weeks left in the year, there are concerns about how the digital asset will close out in 2022. So far, there has been markedly weak movement in the market, impacted by the high inflation levels as the Fed remains hawkish in its stance to drag inflation to 2% over time.
Ivanov also touches on this in his statements saying “That the Feds tapered their interest rate hikes does not imply that inflation is reduced.” However, the CoinsPaid CMO believes that bitcoin will be able to retain more of its value compared to fiat currencies as more institutional money frees up to possibly go into the crypto market.
If the market maintains its positive outlook, there is a possibility for more growth in the price of bitcoin over time. Ivanov also looks to the end of the year through a more positive lens, predicting a 4.5% increase for the digital asset. “As it stands, Bitcoin is poised to overcome the latest negative slip and benefit from this latest Fed move, and we can see the price surge beyond ,500 by the end of the year.”