 Rich Dad Poor Dad author Robert Kiyosaki says most people should sell bitcoin now that the price of the cryptocurrency is “crashing.” However, he affirmed that he is waiting to buy more bitcoin, emphasizing that “all markets go up and down.” The famous author noted that his strategy is similar to Berkshire Hathaway CEO Warren […]
Bitcoin News
‘First Citizen’ of Bitcoin City Leaves El Salvador After Waiting Over 2 Years for Its Construction
 Corbin Keegan, a U.S. national who self-proclaimed himself as the first citizen of Bitcoin City, has temporarily left El Salvador after waiting over two years for the state to build the settlement. President Nayib Bukele first announced this infrastructure proposal for Bitcoin City in November 2021. He also explained that the settlement would be constructed […]
Bitcoin News
Bitcoin Like A Spring Waiting To Uncoil, Analyst Explains Why
An on-chain analyst has explained how Bitcoin is sitting like a coiled spring right now, a state the asset doesn’t usually stay in for too long.
Bitcoin Short-Term Holder Sell-Side Risk Ratio Has Declined Recently
In a new post on X, analyst Checkmate has discussed the recent trend occurring in the Sell-Side Risk Ratio for the Bitcoin short-term holders. The Sell-Side Risk Ratio here refers to an indicator that tells us about how the absolute profit and loss being locked in by the investors compares against the BTC Realized Cap.
The Realized Cap is basically a measure of the total amount of capital that holders as a whole have used to purchase their coins, as determined by on-chain data.
Thus, the Sell-Side Risk Ratio, which takes the ratio between the sum of profit and loss with this initial investment, provides info about how the profit or loss-taking from the investors looks like relative to their cost basis. When the value of the indicator is high, it means the holders are realizing a large profit or loss right now. Such a trend may follow some sharp volatility in the asset’s price.
On the other hand, the metric being low implies that investors are only selling coins close to their break-even level. This kind of trend could suggest profit or loss-takers in the market have become exhausted.
In the context of the current topic, the entire market’s Sell-Side Risk Ratio isn’t of interest, but rather that of only a specific segment of it: the short-term holders (STHs). These investors are typically defined as those who acquired their coins within the past 155 days.
The below chart shows the trend in the metric for this cohort over the past decade:
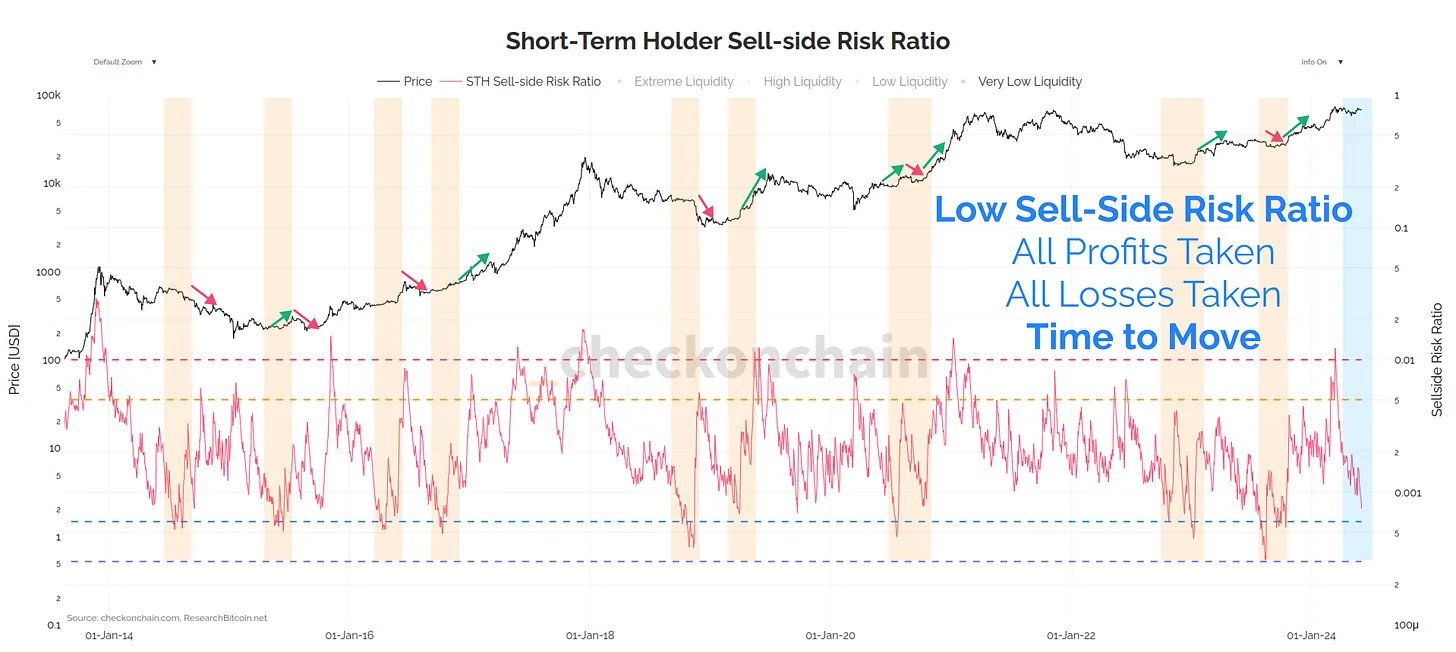
As is visible in the graph, the Sell-Side Risk Ratio for the Bitcoin STHs had shot up to a very high level when the rally towards the new all-time high (ATH) had occurred earlier in the year. Historically, the STHs have shown to be the fickle-minded hands of the market, who sell easily at the sight of any FOMO or FUD in the sector. As such, it’s not surprising to see that these investors had ramped up their profit realization alongside the rally.
Since this peak, though, the indicator has gone through a steep decline as the price of the cryptocurrency has been stuck in endless consolidation. Following the drawdown, the metric has now returned to relatively low levels.
It would appear that as the tight sideways movement has occurred, sellers among the STHs have seen exhaustion. “Bitcoin is coiled like a spring, and it usually doesn’t sit still like this for long,” notes the analyst. With the asset’s price surging to ,000 in the past day, it’s possible that this unwinding may already be here.
BTC Price
Bitcoin has enjoyed an increase of around 3% in the past 24 hours, which has now taken its price to ,900.
Waiting For The Bitcoin Bull Run To Resume? Here’s The Indicator To Watch For
The bullish momentum of the Bitcoin price has dwindled over the past few weeks, putting the progression of the crypto bull cycle into question. On Friday, April 12, the crypto market witnessed a flash crash, causing the premier cryptocurrency’s value to drop from ,000 to below ,000.
This latest downturn underscores the struggle of the Bitcoin price to return to its recent all-time high of ,737, which was forged in mid-March. On-chain analytics platform Santiment has identified a particular Bitcoin metric that may signal the resumption of the bull run.
Bitcoin Bull Run May Resume If This Metric Falls
In a recent post on X, blockchain intelligence firm Santiment provided an exciting insight into the current cycle and the price performance of Bitcoin. The firm pinpointed the Mean Dollar Invested Age metric as one of the indicators to watch as the market leader moves sideways.
According to Santiment, the Mean Dollar Invested Age metric tracks the average age of investment in an asset that has sat in the same wallet. When this indicator is rising, it means that investments are getting more stagnant and old coins are being held in the same wallets.
Conversely, a decreasing Mean Dollar Invested Age metric implies that investments are flowing back into regular circulation. This “falling line” also suggests an increase in network activity.
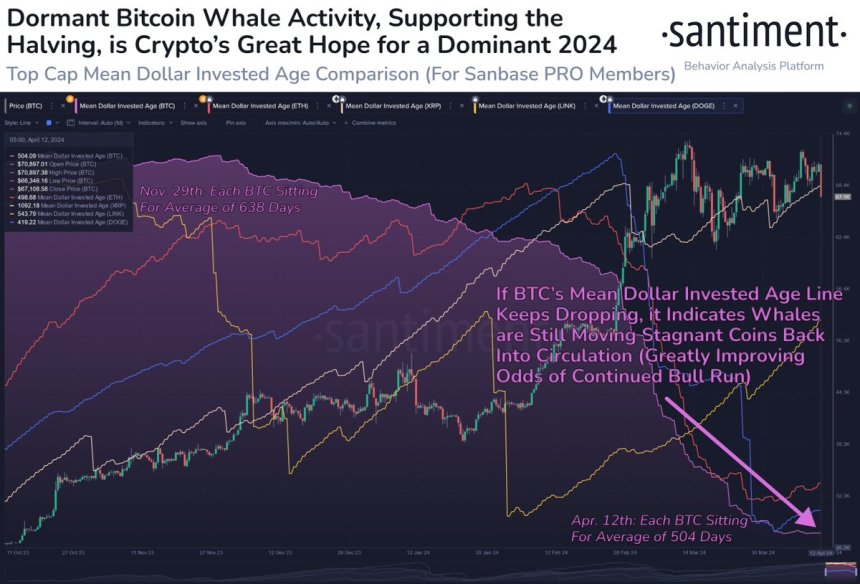
From a historical perspective, Bitcoin exhibited a falling Mean Dollar Invested Age line during the previous bull cycles. According to Santiment, this has been the case for the premier cryptocurrency in the current bull run, which kicked off in late October 2023.
The on-chain analytics platform, however, noted that Bitcoin’s Mean Dollar Invested Age line has been moving sideways over the past couple of weeks. This phenomenon is even more shocking, considering that the highly-anticipated halving event is about a week away.
The Bitcoin halving will see the miners’ reward slashed in half (from 6.25 BTC to 3.125 BTC). It is a bullish event that has contributed to the optimistic outlook – borne by most investors – for the premier cryptocurrency in 2024.
From Santiment’s latest report, investors might want to keep their eyes peeled for the Bitcoin Mean Dollar Invested Age metric. And the bull run is likely to continue if the BTC’s Mean Dollar Invested Age line resumes its fall, which would imply that major stakeholders (like whales) are back to moving coins into regular circulation.
BTC Price At A Glance
As of this writing, Bitcoin is trading around ,548, reflecting a notable 6% price decline in the past 24 hours.
Ethereum Price Grinds Higher, Is This The Start Bulls Were Waiting For?
Ethereum price is attempting a fresh increase above the ,550 level. ETH could continue to move up unless there is a drop below the ,525 support.
- Ethereum is attempting a fresh increase above the ,520 level.
- The price is trading above ,520 and the 100-hourly Simple Moving Average.
- There is a connecting bullish trend line forming with support at ,540 on the hourly chart of ETH/USD (data feed via Kraken).
- The pair could continue to move up if it clears the ,600 and ,620 resistance levels.
Ethereum Price Holds Support
Ethereum price remained well-supported above the ,450 level. ETH outperformed Bitcoin and started a fresh increase above the ,500 resistance zone.
There was a move above the ,550 resistance and the 100-hourly Simple Moving Average. The price even broke the ,600 level before the bears appeared. A high is formed near ,614 and the price is now correcting gains. There was a minor move below the 23.6% Fib retracement level of the upward move from the ,471 swing low to the ,614 high.
Ethereum is still trading above ,520 and the 100-hourly Simple Moving Average. There is also a connecting bullish trend line forming with support at ,540 on the hourly chart of ETH/USD. It is close to the 50% Fib retracement level of the upward move from the ,471 swing low to the ,614 high.
On the upside, the price is facing resistance near the ,600 level. The next major resistance is now near ,620. A clear move above the ,620 level might start a decent increase. In the stated case, the price could rise toward the ,665 level.
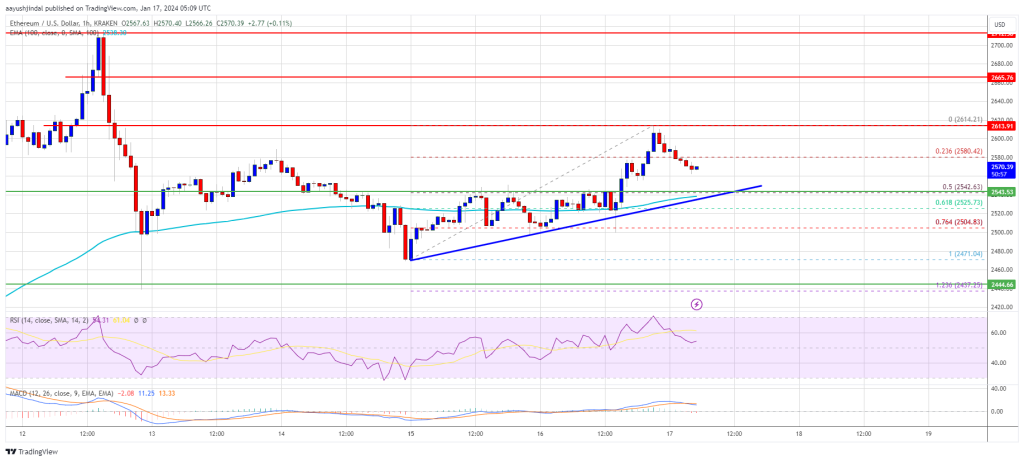
Source: ETHUSD on TradingView.com
The main breakout zone is now forming near the ,710 zone. A close above the ,710 resistance could start another major increase. The next key resistance is near ,780. Any more gains might send the price toward the ,880 zone.
Fresh Decline in ETH?
If Ethereum fails to clear the ,620 resistance, it could start another decline. Initial support on the downside is near the ,550 level and the trend line.
The next key support could be the ,500 zone. A downside break below the ,500 support might send the price further lower. In the stated case, Ether could test the ,450 support. Any more losses might send the price toward the ,350 level.
Technical Indicators
Hourly MACD – The MACD for ETH/USD is losing momentum in the bullish zone.
Hourly RSI – The RSI for ETH/USD is now above the 50 level.
Major Support Level – ,540
Major Resistance Level – ,620
Financial Advisors Are Waiting for Spot Bitcoin ETFs to Offer Clients, Says Ric Edelman

Edelman Financial Services founder Ric Edelman has explained that financial advisors are waiting for the U.S. Securities and Exchange Commission (SEC) to approve spot bitcoin exchange-traded funds (ETFs) so that they can offer these investment products to their clients. “Every compliance department will say okay to that product because it’s just an ETF like other thematic ETFs,” he emphasized.
Financial Advisors Await Spot Bitcoin ETFs
Ric Edelman, founder of Edelman Financial Services and author of several personal finance books, shared his perspective on spot bitcoin exchange-traded funds (ETFs) during Coindesk’s Unchained podcast this week. He detailed:
77% of advisors in the last survey we’ve done on this … show that they are waiting for the spot bitcoin ETF to become available so that they can provide this to their clients because every compliance department will say okay to that product because it’s just an ETF like other thematic ETFs.
“We use ETFs for investing in computer technology, oil and gas, gold and precious metals, [and] emerging markets. This will simply be blockchain and digital assets,” he clarified.
Edelman added: “47% of advisors personally own bitcoin which means they get it. They understand that this is an innovative technology, that it has the potential for delivering outsized investment returns and they’re personally investing.”
The founder of Edelman Financial Services pondered the conversation between financial advisors and their clients. “How are they going to explain to their clients when the client finally says should I buy bitcoin? What do you think? By the way, do you own it?” he described, anticipating the advisor would say: “Oh yeah I’ve owned it for years. I just never told you to buy it.”
Many people expect the U.S. Securities and Exchange Commission (SEC) to approve multiple spot bitcoin ETFs at once, including the analysts at JPMorgan. Bloomberg ETF analyst Eric Balchunas said this week, “We still holding line at 90% odds of approval by Jan 10,” noting that it’s “the same odds we’ve had for months.”
Do you think many financial advisors will recommend spot bitcoin ETFs to their clients? Let us know in the comments section below.
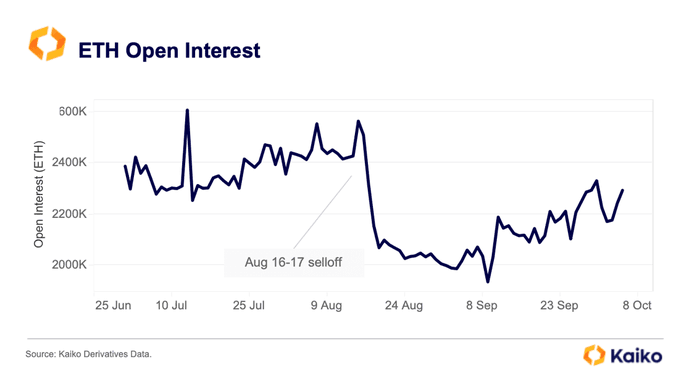
Ethereum Open Interest Rising: Is This A Signal Bulls Have Been Waiting For?
Ethereum prices might be stagnant at spot rates, weaving around the ,540 and ,560 zone, looking at technical charts. However, amid this period of consolidation and holders worrying about Ethereum’s prospects, Kaiko notes that the coin’s open interest has been gradually rising since September 2023.
Ethereum Open Interest Rising: What Does It Mean?
As of October 10, Kaiko observes that there are more than 2.2 million contracts, and the number has been rising steadily over the past few trading weeks. With increasing open interest, it can hint that bulls are in the equation, which may support prices now that prices are under immense pressure.
In crypto trading, open interest is the total number of outstanding derivative contracts of a given coin. Meanwhile, derivatives are contracts that derive value from the underlying asset, in this case, Ethereum. Herein, the total open interest data is accrued from ETH options, futures, and perpetual futures from platforms where traders can use leverage.
There can be different interpretations of open interest depending on the market state. Since open interest includes long and short positions at any time, gauging the directions of how market participants are posting trades can be challenging.
Even so, rising open interest indicates that more traders are opening positions, which can be seen as bullish, especially if prices are expanding. Conversely, falling open interest suggests that traders are exiting, which means waning momentum and bearish sentiment.
ETH Consolidates Even After Ethereum Futures ETF Approval
Based on this, Ethereum remains in a critical position and support. Notably, the coin is moving sideways with low trading volumes.
From the daily chart, ETH is around the ,500 and ,550 primary support. Though buyers appear to be in control, since prices are boxed inside the June to July 2023 trade range, any break below the support zone may trigger more losses.
The general optimism explaining rising open interest could be due to the recent approval of Ethereum Futures exchange-traded funds (ETFs). The United States Securities and Exchange Commission (SEC) approved multiple Ethereum Futures ETFs for the first time.
This decision saw Ethereum prices edge higher in early October. Though prices have since contracted, institutional investors can now find exposure in Ethereum via structured and regulated products approved by the stringent regulator.
It is unclear whether the rising ETH open interest signals strength and if the coin will recover going forward. From the daily chart, ETH has strong liquidation at around the ,750 level and remains consolidated.
Ethereum Validator Activation Queue Grows: 90,000+ Validators Waiting in Line

Ethereum faces congestion for validators to enter and begin staking in the protocol. According to data from Wenmerge, an information dashboard, more than 90,000 validators are waiting to provide protocol validation services on Ethereum. This means a validator entering the queue today must wait more than 46 days to be activated and begin its tasks.
Ethereum Validator Queue Grows Congested
Ethereum, the second largest cryptocurrency by market cap, is experiencing a boom in entities trying to provide validation services for its blockchain. The number of validators now waiting in line to start these services on top of Ethereum is over 90,000, with the queue experiencing a rise since the Shapella update, which opened the way for Ethereum withdrawals.
This growth in the number of validators waiting in the queue also determines an increase in the waiting times for such validators to start their tasks. If a validator applies to be activated now, it will have to wait at least 46 days to provide validation services for the Ethereum blockchain.
According to reports, this is related to the staking strategy that Celsius, the former cryptocurrency lender, is executing. On June 1, Tom Wan, an onchain analyst from 21.co, explained that if Celsius added all of its ether to validate, queue wait times would increase to more than 45 days. By June 4, almost 93% of Celsius’ received ether was staked.
In contrast, no validators were waiting in queue to leave the protocol. This allows validators entering the exit queue to withdraw staked assets almost immediately.
Interest in Ethereum Staking Expected to Keep Growing
However, even with this issue, the interest in Ethereum staking is predicted to keep rising. While some expected Ethereum to be affected negatively by the Shapella upgrade, other financial institutions like JPMorgan predicted it would increase the level of Ethereum staked due to the availability of partial and complete validator withdrawals.
In February, a report written by analysts led by JPMorgan Managing Director of Global Market Strategy Nikolaos Panigirtzoglou stated:
The validator number could increase from 0.5 million to 2.2 million and the yield would fall from 7.4% current to around 5%.
Ethereum’s percentage of assets staked — 15.82% — is four times lower than what the report considers the average on similar proof-of-stake (PoS) consensus chains like Solana or Cosmos, which have 60% of their native tokens staked for validation purposes.
What do you think about the more than 90,000 validators waiting to be activated on Ethereum? Tell us in the comments section below.
WATCH: Waiting On The Bitcoin Monthly: Will Crypto Sink Or Soar? BTCUSD August 31, 2022
In this episode of NewsBTC’s all-new daily technical analysis videos, we are once again looking at the Bitcoin price monthly chart as well as the monthly chart on Ethereum, and major stock market indexes that have a high correlation with crypto.
Take a look at the video below.
VIDEO: Bitcoin Price Analysis (BTCUSD): August 31, 2022
There isn’t much to report on since yesterday’s video, so all eyes remain on the pivotal monthly close in Bitcoin and other risk assets. As you learned in yesterday’s video, the BTCUSD monthly is on a TD9 buy setup, and could risk a lower low which could perfect the series. In the next video, we take one last look at monthly timeframes ahead of tonight’s close.
One Last Look At The Bitcoin Monthly Support Line (And Other Cryptocurrencies)
Tonight’s August monthly close is critical across all risk assets – cryptocurrencies and stocks included. After staging an attempt at a recovery, Bitcoin, Ethereum, and major stock indices have been rejected back to support. Holding at this support level is the first step in a recovery, while losing it is a clearer sign of additional downside.
In the chart below, we can see that all that is separating BTCUSD from disastrous new lows is one horizontal line – former all-time high resistance turned support. If the level fails to hold firm as support, crypto could see and extended bear market.
The S&P 500 and Nasdaq losing their support levels has even more dangerous implications, possibly adding fuel to a recession in the United States.
Bitcoin hangs on by a thread at a key resistance turned support level | Source: BTCUSD on TradingView.com
Cyclical Tools Give Hope For A Bottom
There is no denying that things look negative for Bitcoin and other risk assets at this point in time, cyclical behavior dating back to the first major bear drawdown in BTCUSD could provide hope that the worst is over and a new bullish phase could begin.
In the video, we compare past cycles using the LMACD, Relative Strength Index, Stochastic, and the Average Directional Index. The fact that these tools could indicate a bottom is in might provide a clue to how the monthly candle will close tonight. With less than hours remaining in the monthly candle, it will be a nail-biter.
We also take a closer look at this cyclical behavior in Bitcoin | Source: BTCUSD on TradingView.com
Learn crypto technical analysis yourself with the NewsBTC Trading Course. Click here to access the free educational program.
Follow @TonySpilotroBTC on Twitter or join the TonyTradesBTC Telegram for exclusive daily market insights and technical analysis education. Please note: Content is educational and should not be considered investment advice.
Featured image from iStockPhoto, Charts from TradingView.com
NewsBTC
The Crypto Escrow That We Have All Been Waiting For
Escrow is a widely used legal concept where a third party holds assets or funding on the behalf of the two other parties according to a predetermined set of conditions. Escrow helps ensure that both parties deliver before the transaction is completed. The concept of escrow is popular in the traditional financial ecosystem, especially in the real estate industry.
However, Escrow Protocol aims to introduce the time-tested concept of escrow to the blockchain industry and optimize the crowdfunding process. Crowdfunding is an important part of project development as it connects the project with investors. However, the precedent standard of crowdfunding mechanisms such as ICO relies largely on trust which is often broken in the form of rug pulls.
In an ICO or other crowdfunding mechanisms, the start-up raises hundreds of millions of dollars from venture capitalists and investors. However, in the early development stage, they do not require 100% of the funds. This is where Escrow Protocol comes in as the escrow services to hold the funds and release them according to the milestone achieved by the projects. Escrow Protocol aims to secure blockchain and create a fair environment for investors by giving them control over their investments.
What is Escrow Protocol?
The Escrow Protocol is a decentralized Web3 accelerator and crowdfunding platform designed to give investors extended control over their invested funds. The project combines the best of blockchain and DeFi to develop an all-inclusive investment hub, a user-friendly platform that investors can use to support their favorite start-up projects with oversight, security, and peace of mind.
Escrow Protocol leverages financial security to manage DeFi funds, leveraging smart contracts and to-be respected agreements. The project holds investment funds and allocates them to yield farming protocols to maximize value appreciation and help projects gain interest while waiting for the pay-outs.
The features of Escrow Protocol includes:
- Escrow Protocol will be 100% DAO and community governed to ensure fairness and transparency.
- While the funds are held in Escrow, the projects allocate them to Yield-Farming Protocols and pay 80% to investors.
- Escrow Protocol has developed NFT ID-Badges that give access to the platform and host projects.
- The project is powered by a high-end, easy-to-use interface, allowing current non-crypto users to get involved.
- It offers community decision-making with investment relative voting power.
- A reputation-based scoring system allows the utilization of expert opinions within the community.
- White-Label Escrow service integration for existing real-world operations.
Escrow Protocol is making the blockchain technology and crowdfunding process simpler and safer for all investors. To learn more about Escrow Protocol, visit https://www.escrowprotocol.app/.