 Based on the most recent international standings and weekly figures, sales of non-fungible tokens (NFTs) have surged by 17.66% in the past week, amassing slightly more than 6 million in sales. This uptick marks a jump from last week’s 16.8% rise in NFT sales, with the leading blockchains in terms of volume — Ethereum and […]
Bitcoin News
Bitcoin Price Tumbles Amid VanEck ETF’s Volume Surge: What Happend?
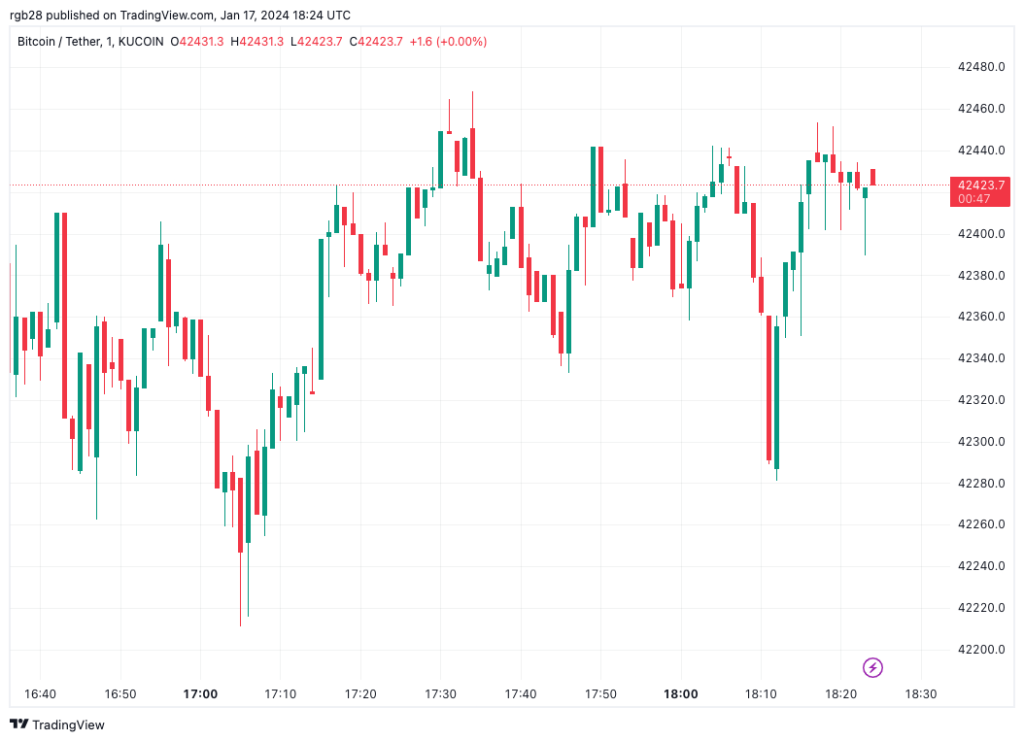
Bitcoin experienced a tumultuous day yesterday, with its price briefly touching ,000 before plummeting to a low of ,820. Amid this price volatility, an unexpected phenomenon caught the eye of market analysts: a dramatic surge in trading volumes for certain Bitcoin ETFs.
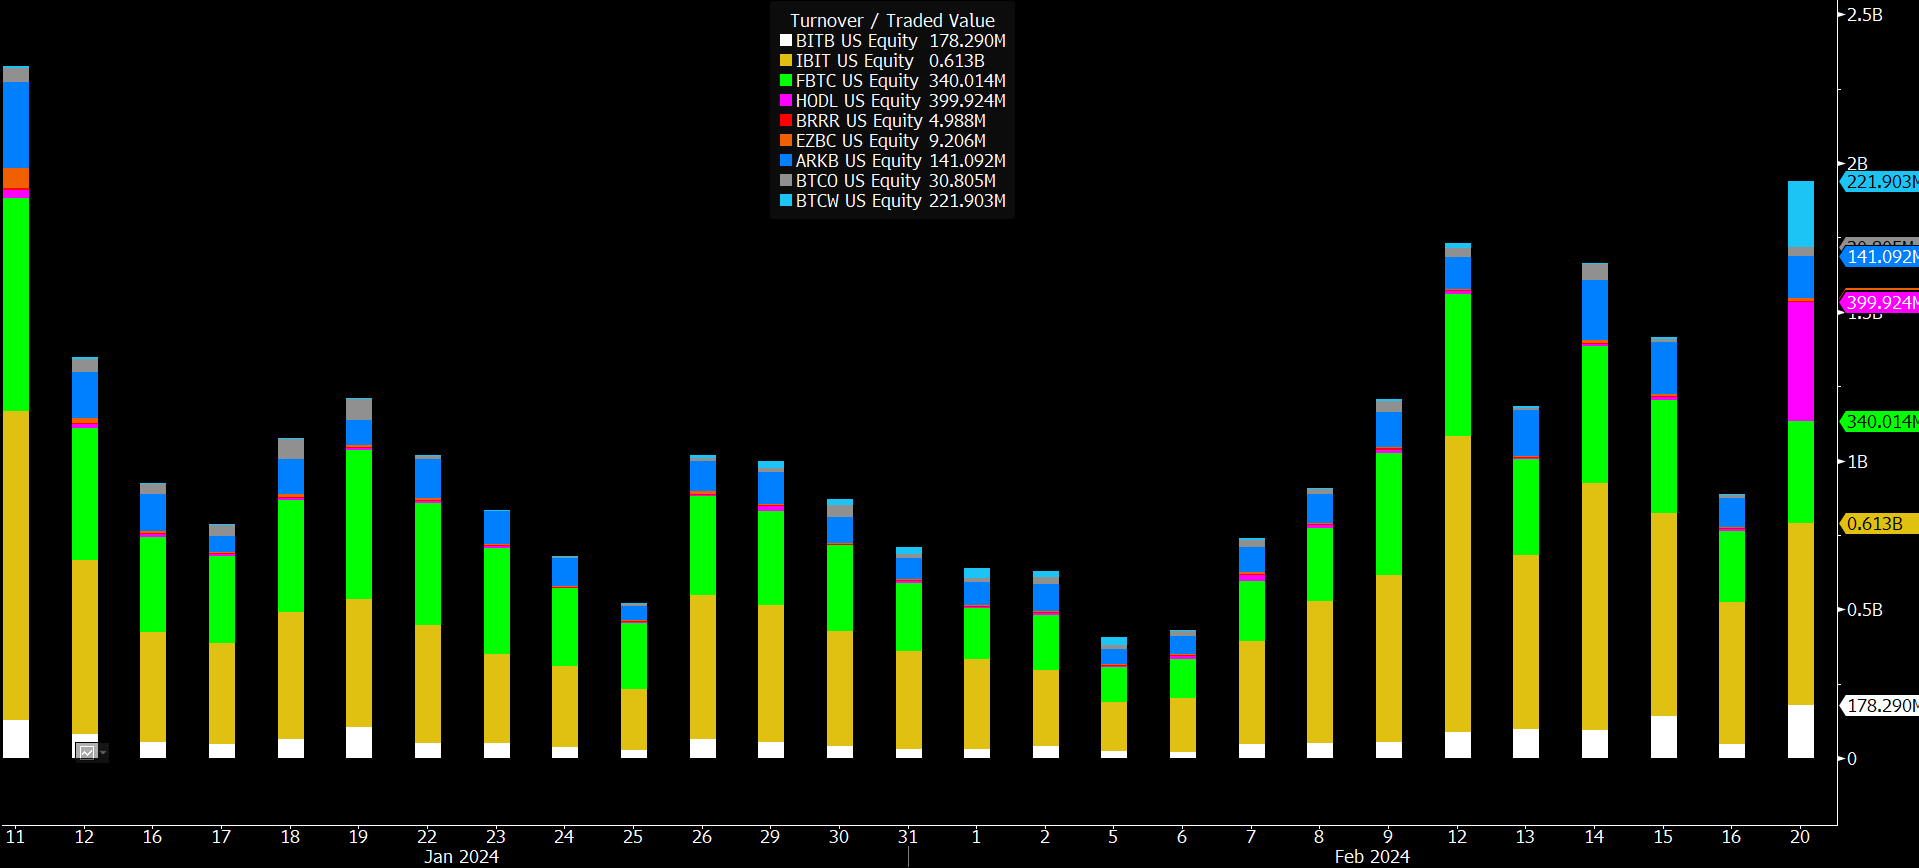
Bloomberg’s Eric Balchunas provided a detailed account of this anomaly on X, particularly focusing on the VanEck Bitcoin ETF (HODL) and its astonishing increase in trading volume. He remarked, “HODL is going wild today with 8m in volume already, a 14x jump over its daily average, and it’s not one big investor… but rather 32,000 individual trades, which is 60x its avg.”
This level of activity was not only unexpected but also unprecedented, sparking widespread speculation and analysis within the financial community. The unusual trading volume wasn’t isolated to HODL alone. Wisdom Tree’s Bitcoin ETF (BTCW) and BlackRock’s Bitcoin ETF (IBIT) also saw significant upticks in trading activity, albeit to varying degrees.
Balchunas pointed out, “BTCW also popping off, 4m trades, 12x its avg and 25x its assets via 23,000 indiv trades.” However, he noted that the volume increase in IBIT, while elevated, did not reach the “extraordinary levels” observed in HODL and BTCW.
What’s Behind The Sudden Spike In Bitcoin ETF Volumes?
Addressing theories that the ETF volume surge was driving Bitcoin’s price drop, Balchunas offered a rebuttal, “To the ‘bruh volume must be selling bc btc is dumping’ crowd: a) that makes no sense given how little these ETFs had in existing aum/shareholders b) plus you never see ton of outflows in brand new ETF that is in rally mode c) there are so many other holders of btc besides ETFs! d) how can you call it ‘dumping’ when it is down 1% after 20% rally in two weeks?”
However, the source of this sudden and explosive increase in trading volume remains a mystery, with Balchunas speculating, “Still haven’t figured out what happened. No one knows. Given how sudden and explosive the increase in number of trades was… I’m wondering if some Reddit or TikTok influencer type recommended them to their followers. Feels retail army-ish.”
He also considered the possibility of market makers trading among each other but found it an unlikely explanation given the liquidity of other Bitcoin ETFs like IBIT and BITO.
The trading day concluded with “The Nine” achieving a record-breaking volume day, thanks to significant contributions from HODL, BTCW, and BITB, which all shattered their previous records. Balchunas highlighted the significance of this trading volume, stating, “For context b in trading would put them in Top 10ish among ETFs and Top 20ish among stocks. It’s a lot.”
As the dust settles on this unprecedented day of trading, the Bitcoin community continues to grapple with the implications of this volume surge on Bitcoin ETFs and its potential impact on the market. The exact catalyst behind this phenomenon remains elusive, with analysts and investors alike keenly awaiting further developments.
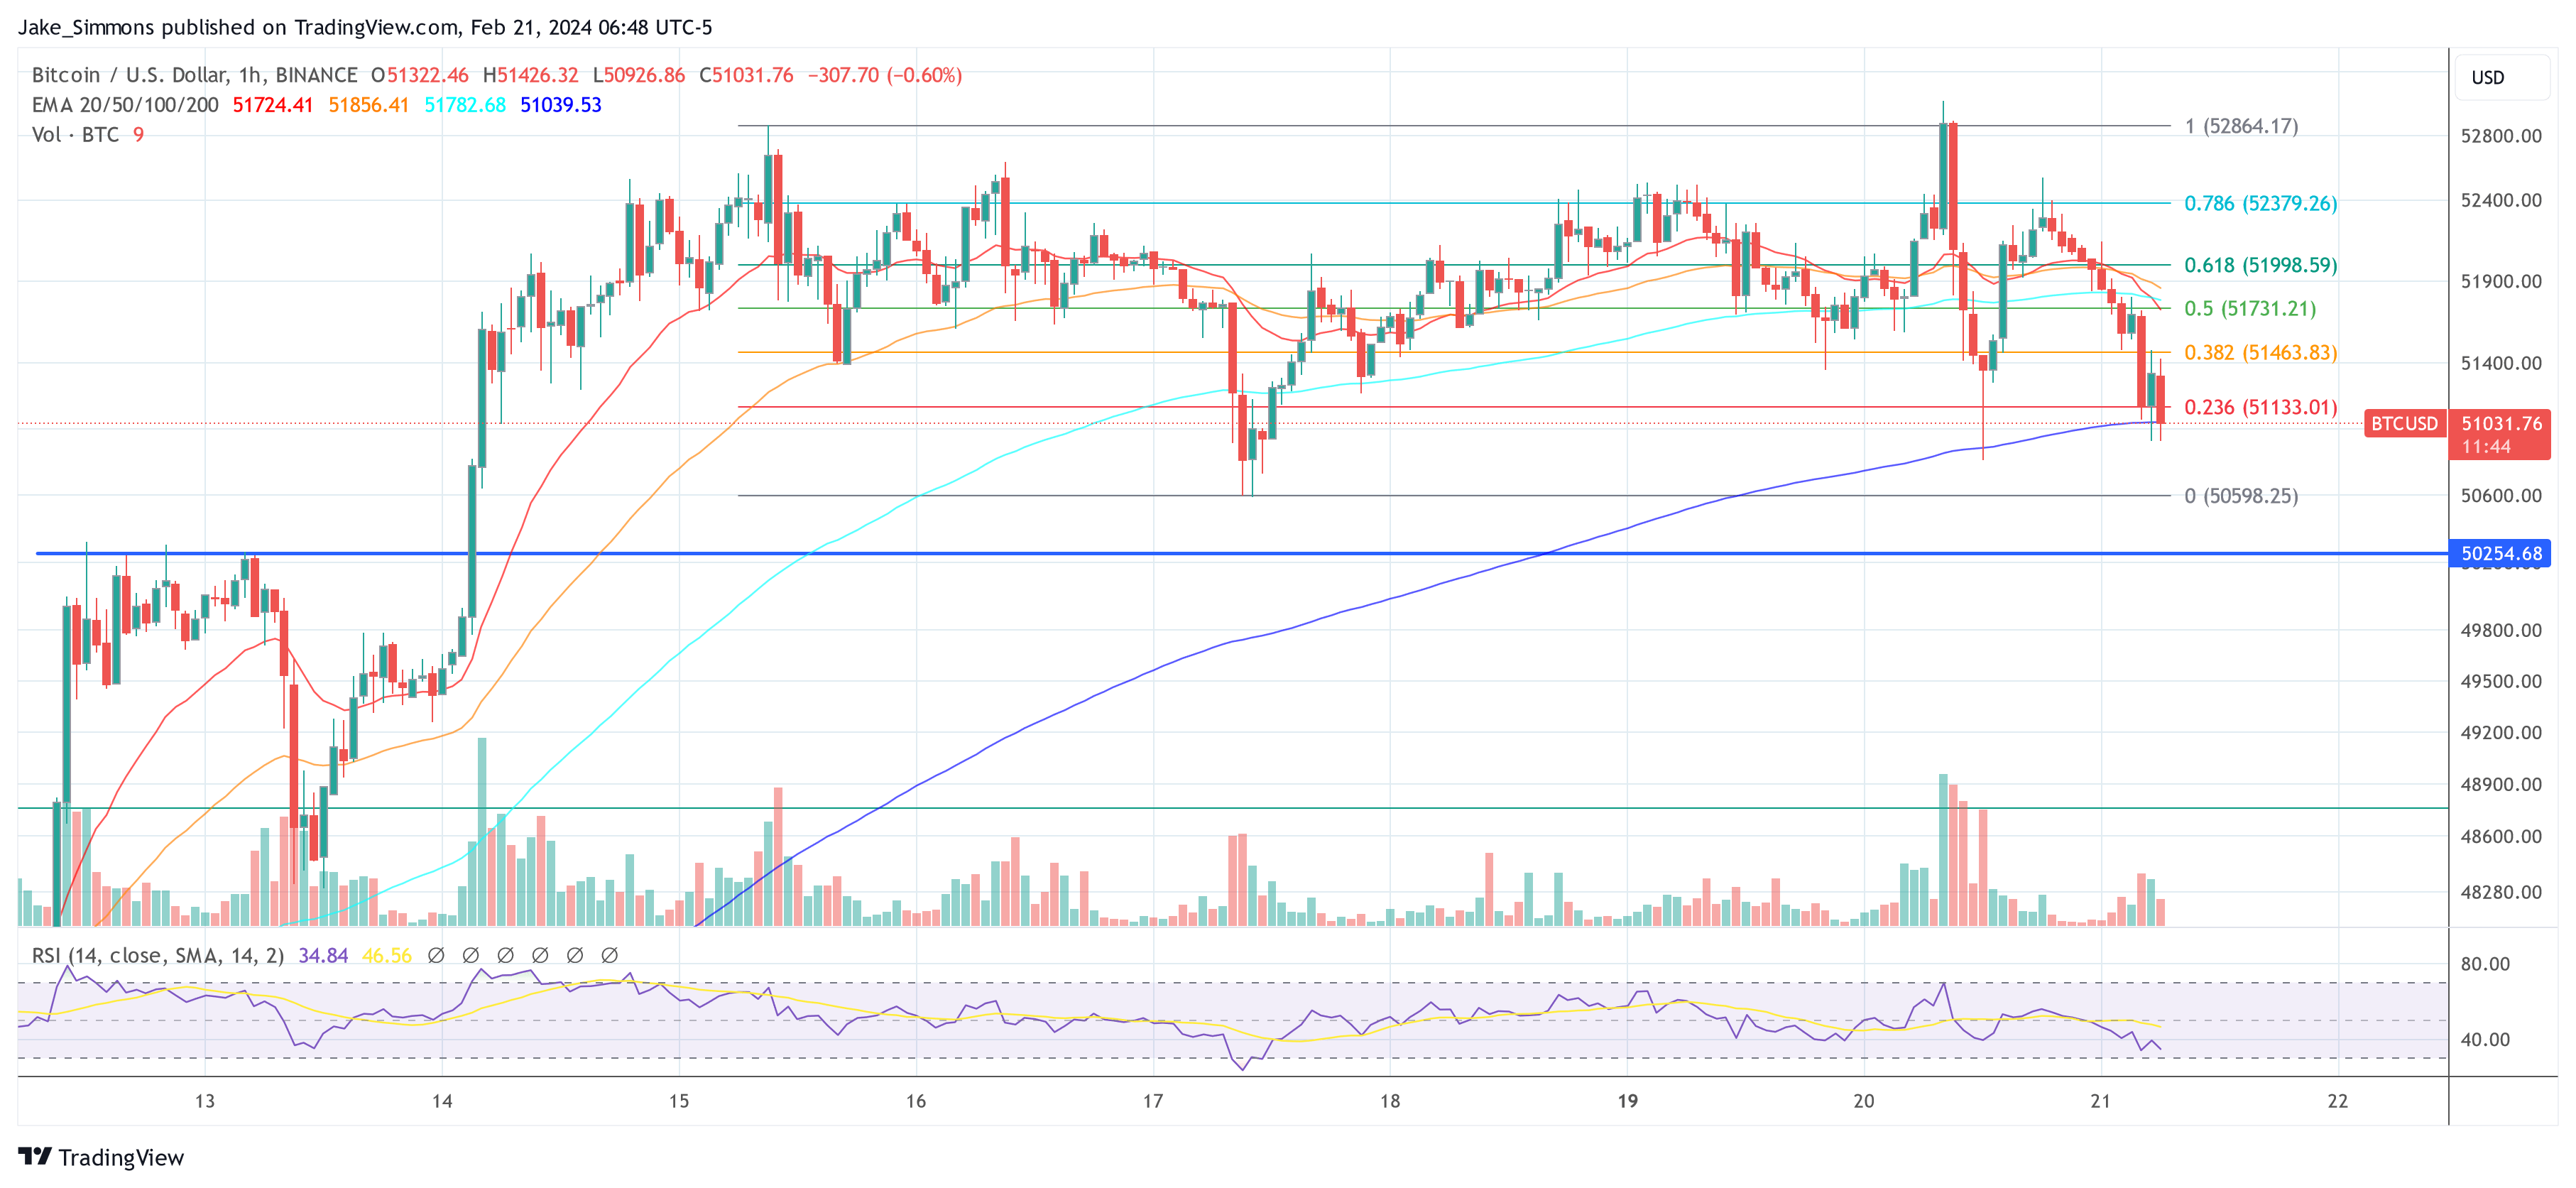
At the time of going to press, BTC fell below the ,000 mark again and initially found support at the EMA100 on the 1-hour chart.
Dogecoin Out Of Fashion? Volume & Whale Activity Plunges
On-chain data shows the Dogecoin volume and whale activity have plummeted recently, a possible indication that investors no longer have interest in the memecoin.
Dogecoin Transaction Volume And Whale Transaction Count Have Declined
As pointed out by analyst Ali in a new post on X, DOGE trading activity has become lower recently. There are two on-chain metrics of relevance here: the Transaction Volume and Whale Transaction Count.
The former keeps track of the total amount of Dogecoin (in USD) involved in daily transaction activity on the network. A high value of this metric usually suggests that trading interest in the asset is high right now.
On the other hand, the low metric implies not many traders are paying attention to the memecoin currently as little volume is transacted on the blockchain.
The other metric of interest here, the “Whale Transaction Count,” measures the total number of transfers on the network that are at least million.
Unlike the Transaction Volume, which provides information about the network in general, the Whale Transaction Count specifically tells us about the activity being displayed by the whales.
The whales are the largest entities on the chain, so they can hold some influence in the market. As such, their activity can affect cryptocurrency in one way or another.
Now, here is a chart that shows the trend in the Dogecoin Transaction Volume and Whale Transaction Count over the last few months:
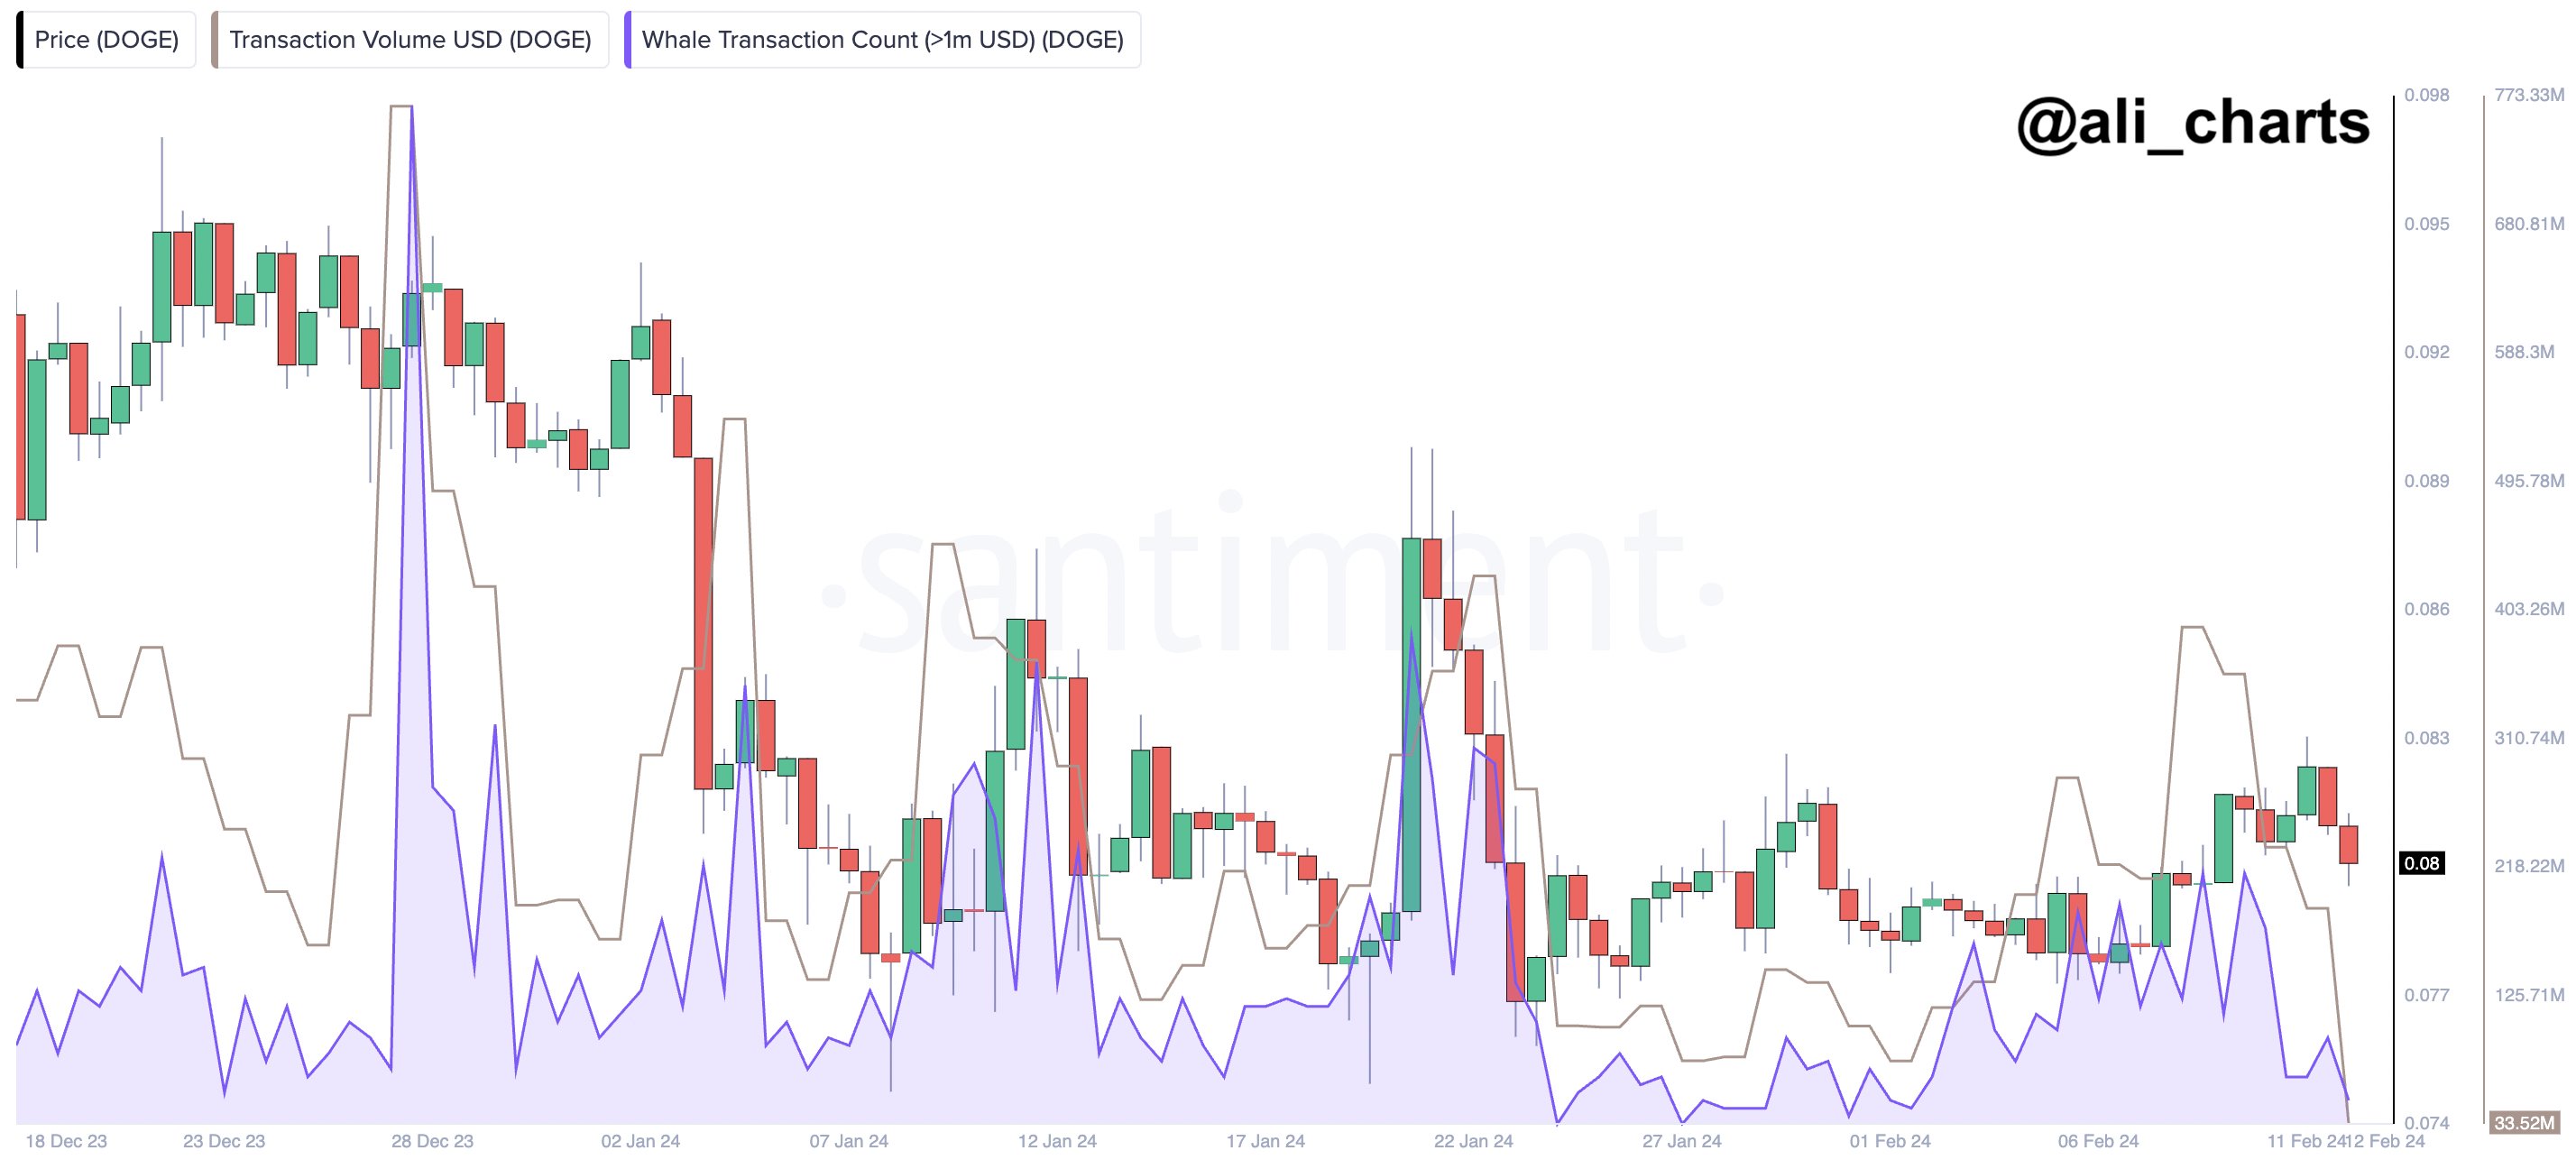
As displayed in the above graph, both the Dogecoin Transaction Volume and Whale Transaction Count have recently seen a drawdown towards relatively low levels. This would imply that interest in the asset from both the whales and retail investors may have waned in the memecoin.
Generally, when buying and selling activity is high, DOGE is likelier to display some volatility. The chart shows that the volatile moves the coin has observed recently all saw the metrics register spikes.
Since Dogecoin isn’t observing that many transactions at the moment, it’s possible that the cryptocurrency’s price will continue to range in the coming days.
Any ignitions in the indicators can be to look out for, however, as they may be a predictor for a sharp move in the price. As these metrics only track whether trading activity is occurring rather than if buying or selling is taking place, any volatility arising from these spikes can take the price in either direction.
DOGE Price
While Bitcoin and other top digital assets have enjoyed profits recently, Dogecoin has slumped sideways, with returns standing utterly flat in the past week.
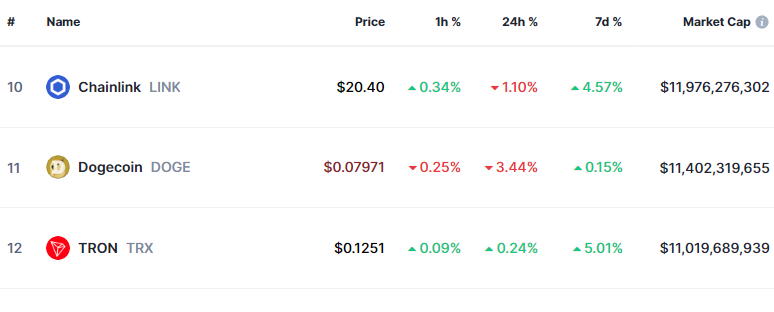
Currently, DOGE is trading around the .08 level, as the chart below shows.
Due to Dogecoin’s recent poor performance, it lost its spot in the top 10 cryptocurrencies by market cap list to Chainlink (LINK). If the coin’s struggle continues, it might slip further down the list, as Tron (TRX) is lurking just behind the asset now.
A Comeback Story: Here’s How The XRP Trading Volume Fared In Q4 2023
A recent report released by Ripple in its Q4 2023 XRP Markets Report unveiled that XRP experienced a substantial increase in daily trading volume, hitting roughly 0 million this quarter. According to the report, this surge represented a 75-100% growth compared to the lower trading volumes observed in Q3.
Notably, the Ripple report suggests a rejuvenation in investor interest and market activity for the altcoin, marking a notable shift from the previous quarter’s performance.
Ripple’s XRP Holdings And Other Crypto Volume In Q4 2023
Ripple’s Q4 report also provided insights into the company’s XRP holdings. As of September 30, 2023, Ripple’s total XRP holdings were more than 5.25 billion, stored in its wallets, plus another 41.3 billion XRP secured in on-ledger escrow.
However, by the close of December 2023, Ripple’s wallet holdings had slightly reduced to about 5.08 billion of this token, and the XRP in on-ledger escrow had also decreased to approximately 40.7 billion.
According to the report, Ripple’s access to the escrowed XRP is restricted until scheduled monthly releases occur, a mechanism that ensures the controlled release of tokens into the market.
Meanwhile, in addition to the surge in XRP’s trading volume, the Ripple markets report also revealed that other major cryptocurrencies, such as Bitcoin (BTC) and Ethereum (ETH), saw considerable increases in their trading volumes.
BTC volumes rose by 88% quarter-on-quarter (QoQ), while ETH recorded a 140% increase over the same period. These trends indicate a broader recovery and bullish sentiment across the crypto market during the quarter.

XRP’s Market Performance And Future Outlook
Despite the recent surge in trading volume, XRP’s market price has shown varying trends. In the last quarter of 2023, the altcoin traded above .60, but as of the latest price action, it hovers just above .5, indicating a decline.
Although there has been a 3.7% increase in the past week and a 2.2% rise in the past day, the asset is currently trading around .52.
Nevertheless, the community and analysts remain optimistic about its future potential. Crypto analyst Jaydee recently pointed out a historical pattern suggesting an imminent parabolic move for XRP. According to Jaydee, the altcoin is currently testing a 10-year trendline, similar to previous instances that led to significant price increases.
#XRP – Last two times we tested the 10-year trendline, $XRP 39x – 650x in price w/in a year! We are now testing multi-year trendline!
Can we bounce off trendline to finally break structure?! Do NOT “KNOW WHAT YOU HOLD”,
we taking “calculated profits!”
RT/Like for updates!… pic.twitter.com/flIQcDh4Ls
— JD
(@jaydee_757) February 3, 2024

Additionally, Crypto Patel, another analyst, shared his forecast, emphasizing XRP’s potential to shine and go parabolic, drawing parallels to past market trends.
Patel also referred to the legal developments involving Ripple and the US Securities and Exchange Commission (SEC), suggesting that the recent legal victory for Ripple could open doors for XRP’s breakout in the next bull run.
The analyst drew attention to a specific chart pattern from 2017 that preceded a massive rally for altcoin. If this trend repeats, Patel posits, the asset could witness an ‘extraordinary’ surge, potentially reaching over .
Is This Finally XRP’s Time To SHINE, WIll hit ?
Last bull #XRP seriously underperformed while stuck fighting the #SEC
But with the SEC case now won – the floodgates may finally BE OPEN!
— Crypto Patel (@CryptoPatel) February 7, 2024
Featured image from Unsplash, Chart from TradingView
Quantum Cats NFT Collection Jumps in Value, Dominates Secondary Market Trade Volume

Following the launch of Taproot Wizards’ Quantum Cats non-fungible token (NFT) series, secondary market activity reveals significant trading volume and a significant increase in the collection’s minimum value. Initially offered at 0.1 bitcoin each, Quantum Cats’ lowest value now fluctuates around 0.303 bitcoin or ,062 for each NFT.
Quantum Cats Floor Values Leap to New Heights
Just 48 hours prior, Bitcoin.com News covered the Quantum Cats NFT launch, which had experienced some setbacks. Post-launch, having garnered over million through initial sales, Quantum Cats are now commanding prices well above the 0.1 BTC initial cost. According to Magic Eden’s figures, transactions totaling 257.6658 BTC, equivalent to .1 million, have been executed for Quantum Cat since they were introduced to the secondary market.
Moreover, on the Okx Bitcoin inscriptions trading platform, the Ordinals series has recorded 245.3061 BTC or .57 million in transactions since its debut. Magic Eden lists the Quantum Cats collection’s minimum value at 0.303 BTC or ,062, whereas Okx shows a minimum of 0.338 BTC or ,571 per collectible. This indicates that since their initial listing, the NFTs’ lowest value has surged to more than threefold the original sale price.
Currently, of the 3,333 NFTs, 533 are up for grabs on Magic Eden, with only 28, or 0.84%, available on Okx’s inscriptions marketplace. With 2,720 distinct holders, the collection ranks as the leading NFT series on both Okx and Magic Eden as of 9:00 a.m. Eastern Time on Wednesday.
At the moment, Bitcoin-centric NFT sales rank just behind Ethereum, with a total of ,615,064 in sales over the previous week, compared to Ethereum’s 0,712,013. Despite this, Quantum Cats face stiff competition from established Bitcoin inscription series like Bitcoin Punks and Ordinal Maxi Biz. Notably, five days ago, Bitcoin Punk #60 fetched 9,266, marking it as the priciest Ordinal inscription sold in the last week.
What do you think about the Quantum Cats NFTs rising in value on secondary markets? Share your thoughts and opinions about this subject in the comments section below.
Binance Sets New Record: Spot Trading Volume Reaches $427 Billion
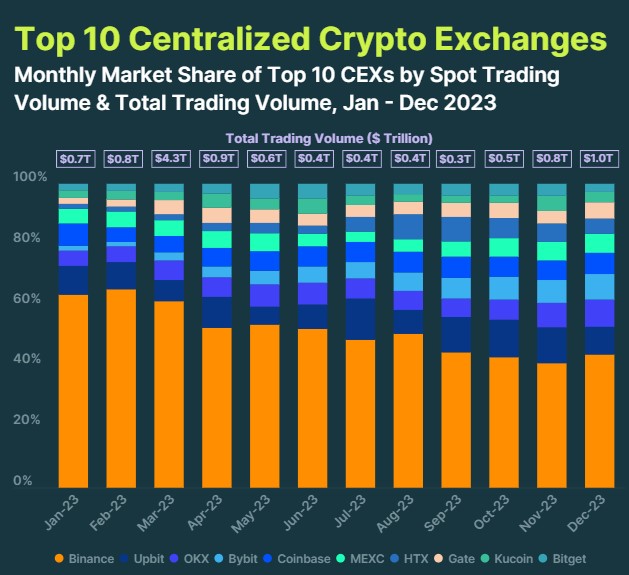
According to a recent CoinGecko report, Binance, the world’s largest centralized exchange (CEX) by trading volume, has retained its market leadership position in 2023.
Despite facing increased regulatory scrutiny and undergoing significant leadership changes, Binance maintained a market share of 43.7% and saw its spot trading volume rise to 7.1 billion in December 2023, representing a 37.5% month-on-month (MoM) increase.
Binance Trading Volume Reached .8 Trillion In 2023
According to CoinGecko’s report, Binance started the year with a commanding 63.5% market share but experienced a gradual decline throughout 2023, ending with a 43.7% market share in December.
While Binance still dominated the market with 52.6% of the total spot trading volume in 2023, the exchange’s relative market share decline was notable. In absolute terms, Binance generated .8 trillion in trading volume throughout the year.
As previously reported, Binance faced significant regulatory pressure throughout 2023, culminating in a settlement agreement in November that required the exchange to pay a .3 billion fine to the Department of Justice (DOJ) and the Commodity Futures Trading Commission (CTFC) for alleged financial breaches.
As part of the settlement, Binance’s CEO, Changpeng Zhao (CZ), also agreed to step down. Richard Teng has assumed the role of the company’s head, while CZ remains restricted from traveling outside the jurisdiction of the United States as the legal battle unfolds.
Upbit And OKX Follow Closely
Upbit, South Korea’s largest cryptocurrency exchange, managed to maintain its position as the second-largest centralized exchange in 2023, with a 9.5% market share and 7.0 billion in spot trading volume for the year.
According to the report, Upbit benefited from the Kimchi Premium, which resulted in strong local demand and premium prices for crypto assets.
The exchange’s monthly spot trading volume hit a yearly high of .7 billion in December, with a 93.5% quarter-on-quarter (QoQ) increase.
Conversely, OKX secured the third position among centralized exchanges in 2023, with a 6.7% market share and 5.9 billion in trading volume. Throughout the year, OKX experienced a steady increase in market share, starting at 5.1% in January and ending at 8.9% in December. The exchange’s trading volume in Q4 reached 7.9 billion, reflecting a notable 151.6% QoQ gain.
Among the top 10 centralized exchanges, CoinGecko reports that MEXC recorded the highest growth in Q4 2023, with trading volume surging by 203.7% to .4 billion.
Bybit followed closely with a growth rate of 162.1% (7.5 billion), while KuCoin experienced a growth rate of 161.2% (.2 billion). KuCoin regained its spot in the Top 10 in Q4 after briefly losing it in Q3, with a market share of 3.3% at the end of December.
Binance Coin (BNB) has successfully maintained its position above the 0 threshold, with the current trading price standing at 4. This represents a 1.8% decrease in price over the past 24 hours.
Featured image from Shutterstock, chart from TradingView.com
Ethereum Technical Analysis: ETH Trade Volume Remains Low Amid Selling Pressure
On Jan. 29, 2024, ethereum’s price dynamics display a nuanced interplay of market elements. The current price of ether stands at ,247, with a 24-hour range fluctuating between ,246 and ,284. Despite its substantial market capitalization of 0 billion, ether trading volume remains modest, hinting at possible investor wariness.
Ethereum
The hourly chart of ethereum (ETH) paints a picture of a volatile ether market. Prices swing from ,246 to ,284, signaling opportunities for short-term trading or day traders. This fluctuation is pivotal for traders who capitalize on brief price movements, offering potential points for entry at support levels and exit strategies beneath these points to minimize risk.
On the 4-hour chart, ether exhibits a mild rebound from its low at ,169, endeavoring to find its footing around ,300. This pattern, characterized by alternating rises and falls, suggests an overarching downward trend, but with inklings of possible stabilization. Traders are advised to tread carefully, entering only if a consistent pattern of increasing lows and highs becomes evident.
ETH’s daily high accentuates a pronounced downward trajectory, with its price descending from roughly ,719 to ,034. This descent signifies a bearish market, predominantly controlled by sellers. Astute traders already in the market may use recent lows as markers for stop-loss orders, while prospective buyers should await signs of a reversal before committing.
Oscillators like the relative strength index (RSI) and Stochastic imply a neutral stance, indicating an absence of a definitive directional momentum. The commodity channel index (CCI) and the average directional index (ADI) corroborate this neutrality. Nonetheless, the momentum and moving average convergence/divergence (MACD) indicators hint at bearish nuances, suggesting potential downward pressures on ethereum’s price.
In terms of moving averages (MAs), the sentiment predominantly skews bearish. The 10, 20, 30, and 50-period exponential (EMAs) and simple moving averages (SMAs) all reinforce this perspective. Conversely, the 100 and 200-period averages signal a positive momentum, hinting at the potential for long-term growth.
Bull Verdict:
Despite the current bearish signals from various technical indicators, a bullish perspective could arise from the resilience of ethereum’s price at key support levels. The juxtaposition of long-term moving averages signaling positive sentiment suggests underlying strength and a potential reversal from the current downtrend. Optimism for a bullish future is predicated on ETH’s ability to break through current resistance levels, coupled with an increase in trading volume and positive market sentiment.
Bear Verdict:
The bearish outlook for ethereum (ETH) is reinforced by the prevailing downward trends observed in the daily chart and the bearish signals from most short-term moving averages. The neutral to bearish indications from oscillators, coupled with the current lack of strong buy signals, point towards ongoing downward pressure. This scenario suggests a cautious approach for long-term and short-term traders alike, with the potential for further price decreases unless there are significant shifts in market dynamics or investor sentiment.
Register your email here to get weekly price analysis updates sent to your inbox:
What do you think about ether’s market action on Monday morning? Share your thoughts and opinions about this subject in the comments section below.
Solana Stablecoin Volume Reaches Record High Of $300 Billion In January
According to the latest on-chain data, the Layer-1 network Solana has hit a significant milestone in terms of the transfer volume of stablecoins this month.
Solana Overtakes Tron In Stablecoin Transfer Volume
Data from the blockchain analytics platform Artemis shows that the stablecoin transfer volume on Solana has already surpassed 0 billion in January. This is the largest transfer volume recorded by stablecoins on the Layer-1 blockchain in a single month.
To put this figure into context, the Solana network registered 7 billion in stablecoin volume in the entire December. Meanwhile, the blockchain’s stablecoin transfer volume was about .56 billion in January 2023, reflecting an over 2,500% growth in the past year.
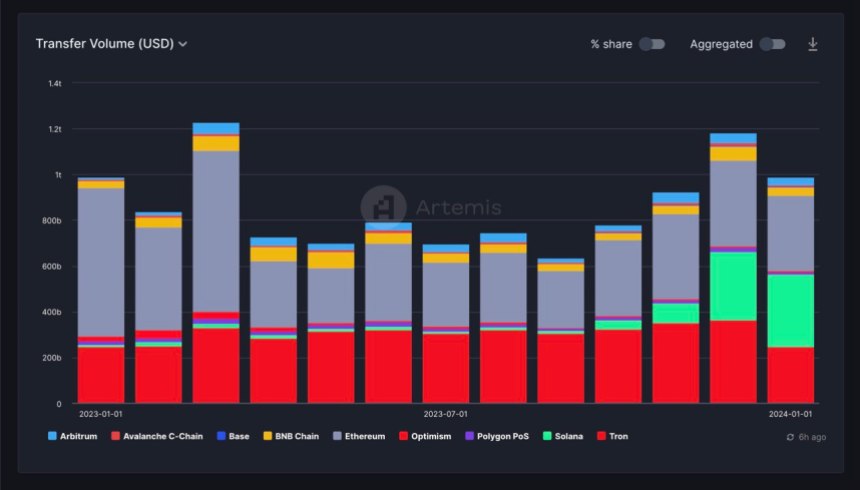
From the chart above, it is clear that Solana’s stablecoin activity has been on a steady rise since October, increasing by more than 650% in the past few months. This growth has also impacted the network’s share in the stablecoin market, with Solana now boasting about 32% market share.
Unsurprisingly, Ethereum leads the market for stablecoins, with its transfer volume already reaching almost 7 billion in January. Meanwhile, the Tron network trails Solana in third place, with a stablecoin volume of roughly 0 billion.
On Thursday, January 18, Paxos revealed the launch of its regulated stablecoin, USDP, on the Solana network. According to DefiLlama data, USDC remains the dominant stablecoin on the Layer-1 network, with a market cap of over billion.
Paxos is thrilled to share our regulated stablecoin USDP is now live on the @solana blockchain! This integration makes it easier for anyone to access and use the safest, most reliable stablecoins in the market. Learn more here: https://t.co/0j4Kj0yyPk pic.twitter.com/1doexKvVmY
— Paxos (@Paxos) January 18, 2024
SOL Price Overview
Despite Solana’s burgeoning network activity, the price performance of its native token SOL has somewhat dampened in the past few weeks. As of this writing, the Solana token is valued at , reflecting a 0.6% decline in the last 24 hours.
This sluggish performance in the past day underscores the altcoin’s challenges since the turn of the year. After reaching a multi-month high of 4 at the end of 2023, the SOL price has largely struggled to hold above the 0 mark.
According to data from CoinGecko, the Solana token is down by more than 5% in the past week. Meanwhile, the coin has declined by about double that figure since the beginning of 2024.
Nevertheless, SOL maintains its position as the fifth-largest cryptocurrency in the sector, with a market capitalization of more than billion.
GBTC’s Mixed Fortune: 54% Market Share in ETF Trade Volume Accompanied by $2 Billion BTC Exodus

Over a span of six days in the U.S. market, nine newly launched spot bitcoin exchange-traded funds (ETFs), along with the recently revamped GBTC, collectively saw a trading volume of .53 billion. GBTC, commanding the majority of this trade volume, experienced a substantial reduction in its bitcoin holdings. In just the past 24 hours, the trust shed over 14,300 bitcoin, decreasing its total holdings to 566,973 bitcoin.
Billion in Bitcoin Depart Grayscale’s GBTC Since Jan. 12
GBTC, now recognized as a spot bitcoin ETF, maintains a considerable reserve of bitcoin (BTC). Since transitioning into a publicly traded ETF, the trust has experienced notable outflows. On Thursday, GBTC’s holdings decreased by 10,823.86 BTC, and following the trading sessions on Friday, the fund saw a further reduction of 14,300.52 BTC. Cumulatively, since Jan. 12, 2024, the trust has seen an outflow of 50,106.59 BTC, valued at slightly above billion, from its reserves.
WHEN WILL THE BLEEDING STOP? I don’t know, but this this is some serious daily outflows for The Nine to have to battle every single day.. they’ve done a great job so far but damn its a lot to ask.. pic.twitter.com/LqwPRETrQf
— Eric Balchunas (@EricBalchunas) January 19, 2024
Several factors contribute to the intense selling of GBTC. Initially, GBTC shareholders might have felt constrained when the shares, initially trading at a premium to their net asset value (NAV), abruptly transitioned to a discount. This discount began in February 2021 and persisted almost until the onset of this year. Long-term investors might have been biding their time, waiting for an opportunity to sell once the discount narrowed. Additionally, investors who speculated that the discount would diminish and bought GBTC at a lower price may now be offloading their shares for substantial gains.
Another possible reason for the sell-off is that some investors in GBTC are exploring alternatives with more competitive management fees, given that Grayscale’s GBTC has the highest fees in its category. On the other hand, Grayscale’s bitcoin trust has seen the highest volume out of all nine newly launched ETFs with .97 billion of the .53 billion aggregate. This means GBTC trades accounted for 54.26% of all the trading action spot bitcoin ETFs recorded.
Before the mass approvals on Jan. 11, 2024, the prevailing narrative largely centered on the expected inflows, with little attention paid to potential outflows from GBTC. However, a modest semblance of equilibrium has emerged, as IBIT and FBTC now possess a combined total of 53,479 BTC, slightly surpassing the outflows GBTC experienced since Jan. 12.
Additionally, the cluster of ETFs vying with GBTC, IBIT, and FBTC have also witnessed growth in their BTC reserves, though not even close to a striking extent. Despite IBIT and FBTC holding significant amounts of bitcoin, these funds, along with the seven other ETFs, remain substantially smaller in comparison to GBTC’s vast reserve of hundreds of thousands of bitcoin.
What do you think about the outflow GBTC has seen since Jan. 12? Share your thoughts and opinions about this subject in the comments section below.
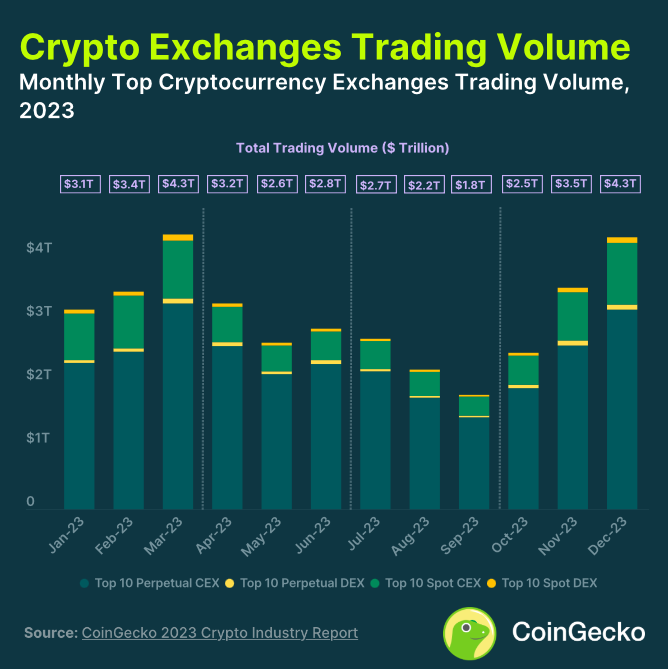
Crypto Exchanges Trading Volume Hit $10.3T in 2023, New Data Shows
CoinGecko’s 2023 Annual Crypto Industry Report has been released. It covers crypto exchanges and their current state, Bitcoin’s +155.2% and Ethereum’s +90.5% growth, analyzing NFT trading volume throughout the year, and more.
Among the report’s highlights is the comprehensive review of the crypto trading volume in 2023 through the performance of centralized crypto exchanges (CEX) and decentralized exchanges (DEX).
Centralized Crypto Exchanges Dominated
Crypto saw a .6 trillion trading volume in 2023, with a volume increase of +53.1% from Q3 (.7 trillion) to Q4 (.3 T). The Q4 increase marked the first quarter-on-quarter (QoQ) growth of 2023 and could be attributed to the “growing bullish sentiment” in the crypto market due to the anticipation of spot Bitcoin ETFs’ approval by the SEC.
Despite the market’s challenges, such as the aftermath of FTX’s collapse, the worldwide banking crisis, or Binance’s regulatory difficulties in 2023, the data presented in the report shows an overall market recovery.
In December 2023, the trading volume increased sharply to .3 trillion, a volume not seen since March 2023. Overall 2023, centralized exchanges dominated the year despite the challenges, especially when compared to decentralized exchanges (DEX). The report details:
- CEXto DEX spot trading volume ratio hovered around 91.5% in Q4.
- CEX to DEX derivatives trading volume ratio dropped to 97.3% from 98.5%.
- CEX to DEX spot ratio stood at 91.4% in 2023.
- CEX to DEX derivatives ratio was 98.1% in 2023.
Binance, Upbit, OKX, Bybit, and Coinbase are among the Top 10 centralized exchanges by trading volume. Binance managed to dominate the list despite dropping to a yearly low market share of 41% in November, following a continued loss throughout 2023.
There was a +98.1% increase QoQ, after the top 10 CEXes recorded .20 trillion in spot trading volume in 2023 Q4. Previously, the trading volume had failed to reach above trillion for two consecutive quarters.
Altogether, the top 10 CEXes recorded .2 trillion in spot trading volume in 2023 compared to .4 trillion in 2022, representing a -23.4% year-on-year (YoY) decline.
Deep Dive Into The Spot Decentralized Exchanges (DEX) Trading Volume In 2023
The Top 10 DEXes recorded 5.3 billion in spot trading volume in 2023 Q4, indicating a +87.1% Total Trading Volume Increase QoQ. Uniswap, Pancakeswap, Orca, Curve, and THORSwap dominate the DEXes in 2023’s Top 10 spot DEX trading volume.
Notably, the report names Orca and THORSwap as the biggest gainers amongst the DEXes in 2023 Q4, with Orca increasing 1,079% (.2 billion), while THORSwap saw a surge of 422.4% (.1 billion)
When breaking down the 2023 spot DEX trading volume breakdown by chain, the report details that Ethereum had .3 billion of DEX trading volume in 2023 Q4, displaying an increase of +38.3% from 2023 Q3. However, it ended with a low 41% dominance, dropping below 50% for the first time in 2023 in November and December.
It’s worth noting that Solana was the biggest gainer, with a 985.5% increase in QoQ, while THORChain took second place with a 422.4% trading volume increase in Q4. The data shows that the two chains ranked #3 and #5 in December 2023.