 Tidal Investments has announced a proposal for an actively-managed exchange-traded fund (ETF) that combines investments in bitcoin and gold. This fund aims to provide long-term capital appreciation while mitigating short-term market volatility through dual exposure to these asset classes. Tidal Looks for SEC Approval for a Leveraged Bitcoin and Gold ETF The STKD Bitcoin and […]
Bitcoin News
Stablecoin Market Remains Steady in June Amidst Crypto Volatility
 While June was a lackluster period for crypto assets as many experienced double-digit losses against the U.S. dollar, the stablecoin market also saw minimal growth over the past 30 days. Ethena’s USDE led the growth, with its supply increasing by 21.4% since May. Stablecoin Economy Shows Little Change in June The stablecoin market remained relatively […]
Bitcoin News
Bitcoin Volatility Reaches Historic Low: Calm Before A 500% Bullish Storm?
Bitcoin price is back trading above ,000 after weeks of sideways price action. The recent boredom and sideways grind, however, isn’t necessarily a bad thing. In the past, such lulls in volatility have preceded the top cryptocurrency’s greatest rallies on record. Let’s take a look.
Bitcoin Historical Volatility Reaches Record Low
The term volatility often has a negative connotation surrounding it. For example, Oxford Languages defines volatility as the “liability to change rapidly and unpredictably, especially for the worse.” In financial markets, the term refers to how much and how fast price moves within a specific timeframe.
To measure volatility, technical analysts use the historical volatility metric, which compares volatility across the entire existence of an asset’s price timeline. Using such a tool, analysts can compare and contrast past bouts of high or low volatility in an asset like Bitcoin.
Turning this tool on in BTCUSD reveals that on the 2-week timeframe, the top cryptocurrency by market cap is coming off the lowest volatility phase in its entire existence. More importantly, however, is the fact that the last two times that BTCUSD was this boring, it led to an over 9,000% and over 2,000% rally. The most recent made Bitcoin a household name, rising from around ,000 to nearly ,000 at its peak in 2017.
Now the signal is back, but what might this mean for the cryptocurrency market and holders who have waited through the recent sideways price action.
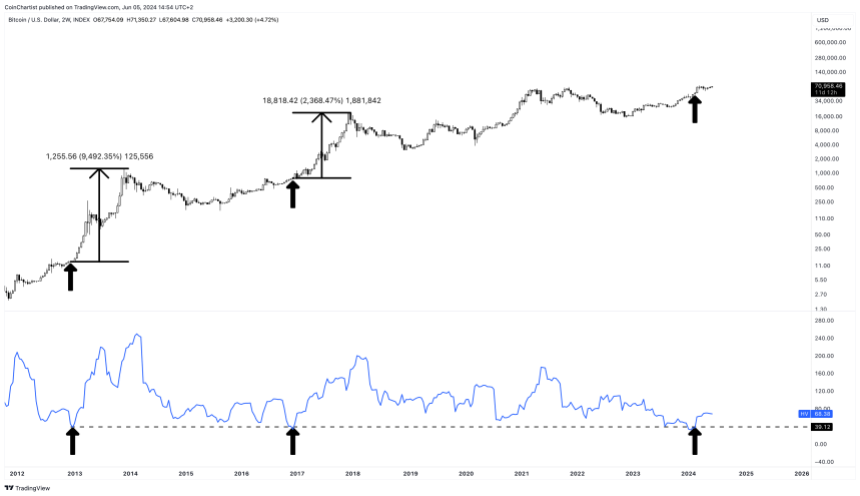
Third Time Is A Charm: Can BTC Climb 200-500%?
Volatility is cyclical in nature. After periods of high volatility and explosive price action, the market moves into a lull where prices move painfully sideways. When the sideways boredom ends, it usually ends with a bang and a return to the explosive price action that was evident before the lull.
Volatility can also be measured and even predicted using “implied volatility.” But the direction in which the volatility releases cannot be predicted with accuracy. Considering volatility is most often associated with negativity, there’s at least some probability that the low in volatility could be broken by an extreme dump in Bitcoin.
But the last two instances suggest otherwise, and the recent trend has been up. While BTCUSD likely won’t see another 9,000% rally nor a 2,000% rally like it did in 2013 and 2017, the first-ever cryptocurrency could do anywhere from a 200% to 500% surge.
At 200% and a price of ,000 per coin, Bitcoin could end up peaking this cycle at around 0,000. At a 500% move from current levels, Bitcoin could reach 0,000 per coin. Higher multiples are indeed possible, but not probable considering the law of diminishing returns.
Tony Severino, CMT is the author of the CoinChartist (VIP) newsletter. Sign up for free. Follow @TonyTheBullBTC & @coinchartist_io on Twitter. Or join the TonyTradesBTC Telegram for daily market insights and technical analysis education. Please note: Content is educational and should not be considered investment advice.
Bitcoin ‘Realized Volatility’ Showing Very Rare Trend: What Could Be Next
Data shows that the Bitcoin Realized Volatility metric has fallen to historically low levels. What generally happens after this pattern forms?
Bitcoin Realized Volatility Has Decline To Extreme Lows Recently
In a post on X, CryptoQuant author Axel Adler Jr has discussed about the latest trend taking place in the Realized Volatility of Bitcoin. The Realized Volatility here refers to an indicator that basically tells us about how volatile a given asset has been based on its price returns within a specified window.
When the value of this metric is high, it means that the asset in question has experienced a large number of fluctuations during the period. On the other hand, the low indicator implies that the price action has been stale for the commodity.
Now, here is a chart that shows the trend in the 1-week Realized Volatility for Bitcoin over the last few years:
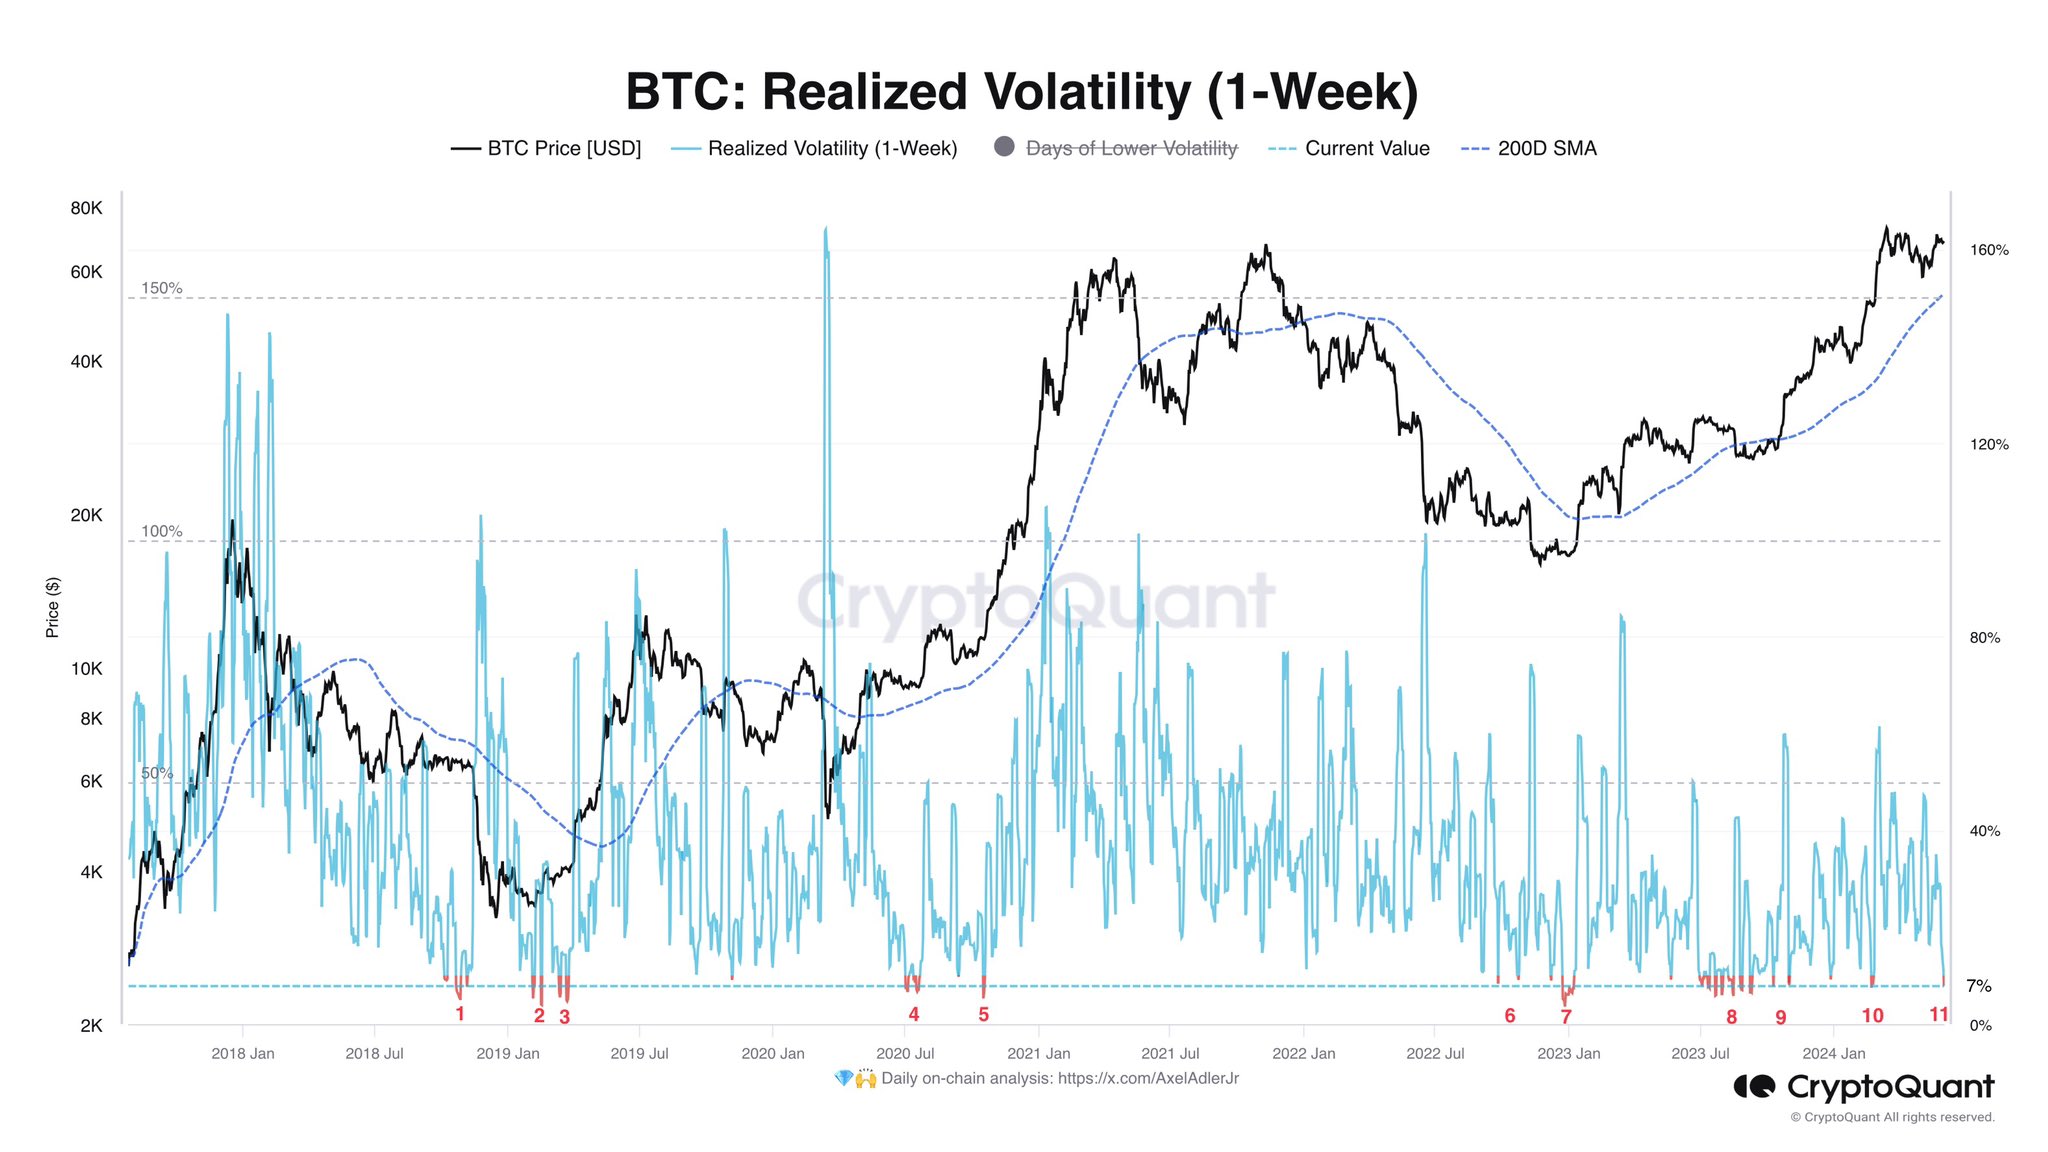
As displayed in the above graph, the 1-week Bitcoin Realized Volatility has declined to pretty low levels of around 7% recently. This is so extreme that only ten other instances in the past six years have seen the metric go similarly low.
This means that the cryptocurrency’s recent consolidation has been amongst the tightest in its history; as for what this trend in the indicator could mean for the cryptocurrency, perhaps past patterns could provide some hints.
An inspection of the chart reveals that such stale price action in the asset has generally unwound with a burst of sharp volatility. The latest instance occurred right before the rally towards the new all-time high (ATH).
Given this pattern, it’s possible that the recent BTC consolidation could also lead to another sharp move for the cryptocurrency. Something to note, however, is that the volatility emerging out of lows in the Realized Volatility has historically gone either way, implying that the price move emerging out of this tight range could very well be a crash.
It remains to be seen how the Bitcoin price will develop from here on out, given the historically stale action it has witnessed over the past week.
In other news, as Axel pointed out in another X post, the recent movement from the bankrupt exchange Mt. Gox has meant that many on-chain indicators have shown false signals.
The analyst has cited the Bitcoin Adjusted Spent Output Profit Ratio (aSOPR) chart as an example.
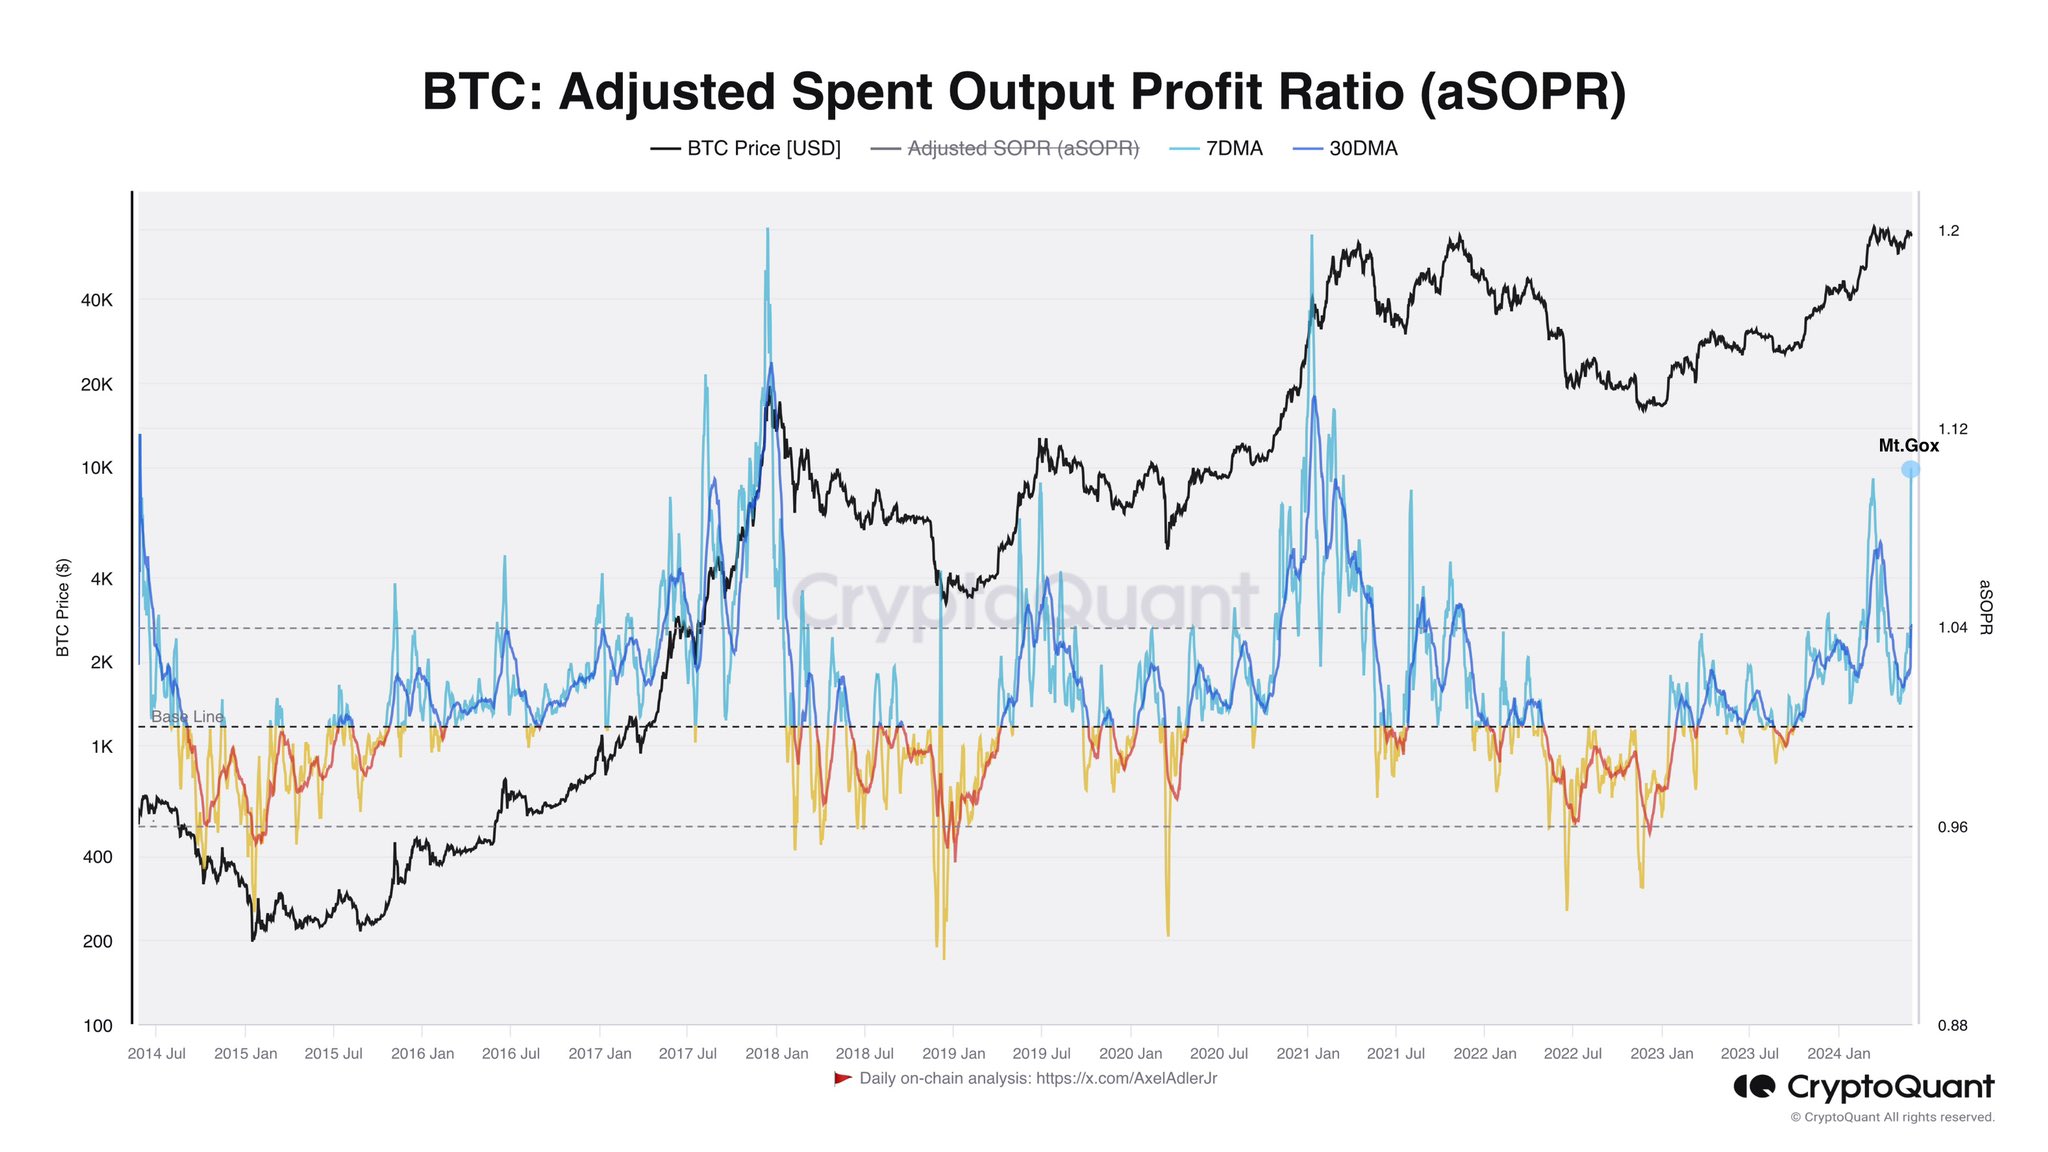
The aSOPR keeps track of the net profit or loss investors across the network realize. As the Mt. Gox BTC had been sitting still in wallets for quite a long time, it’s not surprising that its movement has “realized” a large amount of profit.
Of course, this spike in the indicator isn’t actually a sign of profit-taking, so it’s not a signal that would impact the market.
BTC Price
Bitcoin has declined over the past day as its price is now down to ,800.
Bitcoin Technical Analysis: BTC Shows Consolidation Phase Amid Recent Volatility
 Bitcoin’s price on May 29, 2024, reflects a period of consolidation following recent volatility. The current price stands at ,739 with an intraday range of ,201 to ,880. Technical indicators and moving averages provide a mixed outlook, indicating both potential stability and the possibility of future movements. Bitcoin Bitcoin’s 1-hour chart reveals a high of […]
Bitcoin News
South Korean Bitcoin Premium Rises to 2.23% Amid Market Volatility
 This week, bitcoin’s price briefly exceeded ,000 per coin before declining after the movement of Mt Gox bitcoins, yet the premium for bitcoin in South Korea has significantly increased. Having fallen below the 1% range, the premium on South Korean exchanges has now climbed to 2.23%. Bitcoin Premium in South Korea Grows Bitcoin (BTC) saw […]
Bitcoin News
Bitcoin Whales Buy Up $1.4 Billion Worth Of BTC Amid Heightened Volatility
Bitcoin whales have continued to show their resilience and unwavering bullishness on the flagship crypto. This category of investors has accumulated a significant amount of the crypto token in the last seven days amid heightened volatility in Bitcoin’s price.
Bitcoin Whales Accumulate .4 Worth Of BTC
Data from the market intelligence platform IntoTheBlock shows that Bitcoin addresses holding between 1,000 and 10,000 BTC have combined to accumulate 20,000 BTC (.4 billion) over the past seven days. This accumulation coincides with Bitcoin’s recent price surge above ,000.

Furthermore, these whales’ purchases suggest that volume is picking up for the flagship crypto, which could help trigger more price rallies. Moreover, on-chain analytics platform Glassnode noted in a recent market report that the selling pressure on Bitcoin was declining. Therefore, Bitcoin’s price looks primed to take off sooner rather than later with significant buys like the one made by these whales.
Meanwhile, institutional investors are also back in the fold and look to be doubling their bets on the flagship crypto. This is evident in the fact that inflows into the Spot Bitcoin ETFs have picked up over the last two weeks. Data from Farside Investors shows that these funds have taken in almost 0 million in this week alone.
Crypto analyst James Check (also known as Checkmatey) noted in a recent market report that these funds could lead the next wave of demand, driving Bitcoin’s price to a new all-time high (ATH). These Spot Bitcoin ETFs have already been instrumental to Bitcoin’s growth this year, with the flagship crypto hitting its current ATH of ,750 earlier in March.
Like Check, crypto analyst Gustavo Faria also noted in a recent blog post that there are signs that a new wave of demand is emerging. This has raised the possibility of the next rally happening even sooner than expected. Crypto analysts like BitQuant have provided insights into how high Bitcoin could rise on its next leg up, predicting that the crypto token will reach ,000.
No Need To Worry About Price Dips
On-chain analytics platform Santiment suggested there was no need to worry about any price correction for Bitcoin as the bulls have enough capital to buy up these dips. The platform highlighted that the amount of non-empty stablecoin wallets is rising, indicating that more whales are loading up their bags to invest in the crypto market.

Specifically, USDC non-empty wallets have grown by over 13%, and Tether non-empty wallets have grown by over 15%. This figure is expected to keep rising as the bull run progresses later in the year.
At the time of writing, Bitcoin is trading at around ,200, down over 3% in the last 24 hours, according to data from CoinMarketCap.
Crypto Countdown: $2.4B In Bitcoin and Ethereum Options Set To Expire, Market Volatility Ahead?
As the clock ticks closer to the end of today, May 3, the cryptocurrency market braces itself for potential upheavals, with roughly .4 billion worth of Bitcoin and Ethereum options set to expire.
This significant event could catalyze notable shifts in market dynamics, steering the trajectory of Bitcoin and Ethereum prices in the near term.
Notably, Options contracts in the crypto sphere allow traders to hedge against price volatility or speculate on future price movements without directly holding the assets. Typically structured as either calls or puts, these contracts enable buying (call) or selling (put) at predetermined prices within a specified timeframe.
As the expiry date approaches, movements within these contracts tend to introduce heightened volatility into the market, given the adjustments traders make to hedge their positions or capitalize on anticipated price movements.
Market Mechanics And Sentiment Indicators
The mechanics of options trading offer insights into market sentiment, primarily through analyzing the put/call ratio. This ratio gauges the market’s bullish or bearish stance, depending on whether the volume of call options (betting on price rises) outweighs put options (betting on price drops) or vice versa.
Presently, the put-to-call ratio for Bitcoin stands at a relatively low 0.5, suggesting a bullish sentiment as more traders bet on rising prices with the maximum pain point—a price level causing maximum trader losses—at about ,000 and a notional value of .4 billion.

In contrast, Ethereum’s options market is also teeming with activity, marked by the upcoming expiry of contracts valued at around billion. With a put-to-call ratio of 0.37, the sentiment leans even more bullish than Bitcoin, indicating stronger trader confidence in Ethereum’s price performance.
Ethereum’s designated maximum pain point sits at ,000, aligning with key psychological and technical support levels.
May 3 Options Data
23,000 BTC options are about to expire with a Put Call Ratio of 0.49, a Maxpain point of ,000 and a notional value of .4 billion.
330,000 ETH options are due to expire with a Put Call Ratio of 0.36, Maxpain point of ,000 and notional value of … pic.twitter.com/mEA4PV98C3— Greeks.live (@GreeksLive) May 3, 2024
Implications And Bitcoin Insights
Historically, the expiration of such a voluminous cache of options has precipitated abrupt price fluctuations in the spot markets for Bitcoin and Ethereum. This is attributed to the large-scale repositioning by institutional and retail investors in anticipation of or in response to the expiry outcomes.
These strategic movements are particularly pivotal when both cryptocurrencies recover from recent pullbacks. GreeksLive noted:
The current point of sustained sideways trading is unlikely, no rebound is bound to be a downward relay, the giant whale on the lack of confidence in the market, Block trading is worth strengthening attention.
Meanwhile, Bitcoin appears to be recovering from the recent downturn with a 5.4% increase in the past day, momentarily piercing the ,000 mark, signaling a potential resumption of its upward march.
Similarly, Ethereum has shown resilience, climbing above the ,000 threshold with a modest 3% gain. These upticks coincide with broader market analyses like that of Marco Johanning, a well-known crypto analyst and founder of The Summit Club, suggesting that foundational bullish sentiments remain intact despite recent corrections.
Featured image from Unsplash, Chart from TradingView
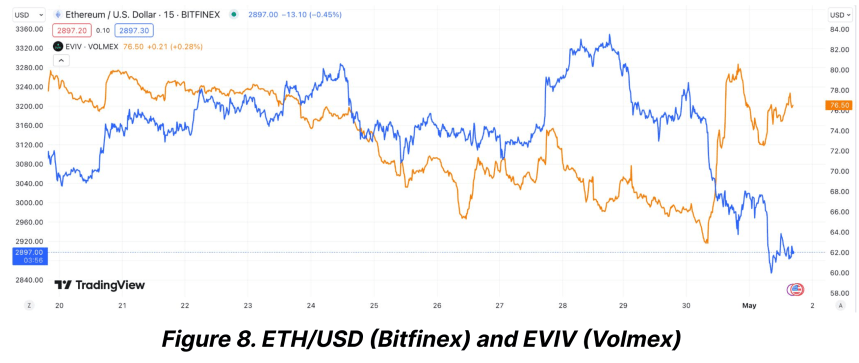
Ethereum’s Wild Fluctuations: Here’s What ETH Implied Volatility Tells Us
The cryptocurrency market has recently exhibited distinct divergences in the behavior of its two leading assets, Bitcoin and Ethereum. While Bitcoin appears to be stepping into a phase of relative stability, Ethereum’s journey paints a contrasting picture of sustained uncertainty, particularly in its options market.
This divergence is highlighted by the sustained high levels of implied volatility associated with Ethereum options, signaling a cautious outlook among investors regarding its future price movements.
Ethereum Persisting Volatility: A Comparative Analysis
Implied volatility (IV) serves as a crucial indicator in the options market, providing insights into the expected price fluctuations of an asset over a specific period. It reflects the market’s temperature, gauging the intensity of potential price movements traders anticipate.
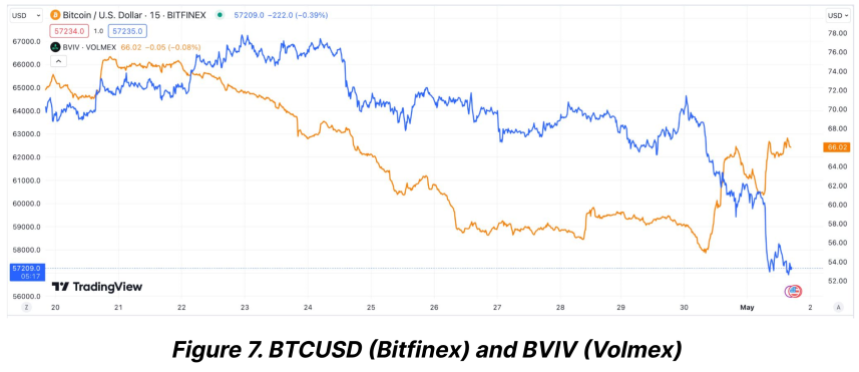
Recent analyses suggest that while Bitcoin’s implied volatility has settled down significantly post-halving, Ethereum’s has not followed suit. As Bitcoin’s IV dipped to a multi-month low, indicating a calming market, Ethereum’s IV remains stubbornly high.
Contrary to the calming waves in the Bitcoin market, Ethereum wrestles with heightened volatility. According to data from Bitfinex Alpha Report, Bitcoin’s volatility index sharply declined from 72% at the time of its latest halving event to about 55%.
On the other hand, Ethereum saw a more modest reduction in its volatility index, dropping from 76% to 65% in the same period. This persistent volatility in Ethereum’s market is primarily fueled by uncertainties surrounding significant upcoming regulatory decisions and broader market implications.
The Ethereum market is particularly jittery in anticipation of the US Securities and Exchange Commission’s (SEC) impending decision on two spot Ethereum ETFs, slated for late May 2024.
This upcoming regulatory milestone is considered a critical event that could either catalyze a major market move or exacerbate the current volatility.
The Bitfinex Alpha report underscores that regulatory uncertainty is a primary driver behind Ethereum’s less significant drop in its Volatility Risk Premium (VRP) compared to Bitcoin’s.
ETH And BTC Show Signs of Recovery Amid Volatility
Ethereum and Bitcoin have shown signs of recovery over the past week in terms of trading performance. Bitcoin has seen a 4.1% increase, while Ethereum reported a more modest gain of 2.4%.
However, the last 24 hours have been less favorable for Ethereum, with a slight dip of 0.7%, underscoring the ongoing volatility and investor caution.
Moreover, Ethereum’s network dynamics also reflect a subdued activity with a marked decrease in ETH burn rate attributed to reduced transaction fees.
This technical aspect further complements a cautious Ethereum market narrative, poised on the brink of potentially significant shifts depending on external regulatory actions.
Despite all these, analysts like Ashcrypto suggest that the current volatility could set the stage for a strong rebound in the year’s third quarter. Drawing on historical patterns, Ethereum’s speculative forecast is potentially reaching the ,000 mark, provided market conditions align favorably.
Featured image from Unsplash, Chart from TradingView
Fidelity Digital Assets Study: Bitcoin’s Volatility Declines as It Grows, Echoing Historical Asset Trends
 A new study by Fidelity Digital Assets reveals that as bitcoin matures, its volatility is decreasing, making it less volatile than several S&P 500 stocks. “As the asset class matures and its total market cap grows, the inflow of capital is expected to have a smaller impact because it will be flowing into a larger […]
Bitcoin News