 Based on statistics from the past three months, the non-fungible token (NFT) collections Cryptopunks and Bored Ape Yacht Club (BAYC) have seen a notable decrease in value. On March 17, 2024, the floor value of Cryptopunks was approximately 49 ether, but 90 days later, it dropped to 25.45 ether. Major Declines in Cryptopunks, BAYC, and […]
Bitcoin News
Predicting Bitcoin’s Bull Run Values: Plan B’s S2F Model and Ledn CIO’s $92,000 Target
 As bitcoin hovers around the ,000 mark on March 18, 2024, there’s still widespread speculation about the potential for its price to climb even higher. The analyst Plan B continues to shed light on his well-known stock-to-flow (S2F) model, which suggests that “exponential growth” is expected to “continue.” Plan B: ‘S2F = Exponential Growth’ The […]
Bitcoin News
Bitcoin NFT Bubble Bursts: Values Plummet 60% After Holiday Frenzy
The short-lived reign of Bitcoin as the leading NFT platform came to an end this month, with Ethereum reclaiming the top spot as NFT sales on the Bitcoin network plummeted over 60% compared to December’s record highs.
Data from NFT analytics platform CryptoSlam reveals a stark reversal in fortunes. After surpassing Ethereum in December with 1 million worth of NFT sales, Bitcoin’s January volume has sunk to 4 million as of two days before month-end. Meanwhile, Ethereum has maintained a steadier pace, registering 8 million in sales over the past 28 days.
Bitcoin NFT Loses Its Appeal
This shift can be attributed to the fading fervor surrounding Ordinals, a technology enabling inscriptions and non-fungible tokens directly on the Bitcoin blockchain. The December surge in Bitcoin NFT activity was largely driven by Ordinals-related hype, leading to high fees for inscription minting. For instance, on December 10th, Bitcoin saw a single-day high fee of million due to inscription transactions.
However, with the broader digital asset market facing turbulence, interest in Ordinals has waned significantly. Minting fees have plummeted by 83% since peaking at million on January 14th, now standing at just 8,000 as of January 28th. This decline reflects a drop in demand for blockspace for non-traditional Bitcoin transactions, further suggesting a diminished appetite for Ordinals-based NFTs.
Ethereum, on the other hand, benefits from its established ecosystem and diverse functionalities. Its NFT landscape encompasses a wider range of projects and applications compared to the nascent Ordinals scene on Bitcoin. This, coupled with the relative stability of the Ethereum network, likely contributed to its ability to retain user interest and NFT trading volume throughout December and January.
NFT Landscape Shifts: Adaptability Crucial
The rapid change in the NFT landscape highlights the need for adaptability and innovation within the industry. While Ordinals brought a novel use case to Bitcoin, its technical limitations and niche appeal may hamper its long-term sustainability. Conversely, Ethereum’s flexibility and established infrastructure position it well to adapt to evolving market trends and user preferences.
Furthermore, the broader decline in digital asset class interest likely impacted both Bitcoin and Ethereum NFTs. However, Ethereum’s larger and more diverse user base, along with its established NFT ecosystem, suggest it may be better equipped to weather the current market downturn.
The future of the NFT market remains uncertain, but one thing is clear: the landscape is constantly shifting, and players must be able to adapt to stay ahead of the curve.
Featured image from Pixabay, chart from TradingView
Bitcoin NFTs Skyrocket With $425M in Sales This Week; Key Collections Cement Strong Floor Values

In the last week, markets for non-fungible tokens (NFTs) minted on top of Bitcoin have generated approximately 5.63 million in sales. The leading ten NFT collections over the seven-day period all originate from the Bitcoin blockchain. Several collections of Ordinal inscriptions based on Bitcoin are witnessing substantial trading volumes, establishing strong baseline values for these digital collectibles.
Bitcoin NFT Market Continues to Evolve
In the past six weeks, Bitcoin-based NFTs, also known as Ordinal inscriptions, have been selling at an impressive rate. In November, NFT sales from Bitcoin exceeded those from Ethereum, and this trend has persisted into December.
Data from cryptoslam.io this week reveals that Bitcoin achieved 5.63 million in NFT sales, surpassing the runner-up Solana, which recorded 4 million in seven days. Ethereum, previously the frontrunner in NFT sales, now ranks third with approximately .98 million in sales over the seven-day period.
Currently, the leading trio of marketplaces in the realm of Bitcoin-based NFT sales comprises Okx, Unisat, and Magic Eden. As of Dec. 20, 2023, Okx has a commanding lead, holding over 85% of the market share in this niche.
Unisat follows with an 8.3% share, while Magic Eden captures about 4.3%, according to data from Dune Analytics. In the past week, Magic Eden’s seven-day market data reports that Bitcoin Frogs has been the most traded collection in the BTC-based NFT space.
As for the market value, a Bitcoin Frog NFT had a floor price of 0.395 BTC, equivalent to ,241, based on the current BTC exchange rates. Magic Eden saw Bitcoin Frogs reach 193.26 BTC in sales volume, amounting to .43 million, within a week.
Across various platforms listing Bitcoin Frogs, the collection amassed a total of 328.95 BTC, or .35 million in sales. This week’s other notable collections include bitmap, early sub-100K Ordinals indicating they were minted before the 100,000th mark, MNCHRMS, Bitcoin Punks, Ordinal Maxi, Fuzzy Fox, and early sub-10K Ordinals.
Bitcoin Ordinal inscription collections, although not quite matching the value of leading Ethereum NFT collections such as Cryptopunks, Bored Ape Yacht Club (BAYC), and Mutant Ape Yacht Club (MAYC), are rapidly approaching their stature.
The market valuation of Cryptopunks stands at .14 billion, significantly overshadowing the 2 million market cap of Bitcoin Frogs. Yet, the market cap of Bitcoin Frogs is more comparable to that of BAYC, valued at 2 million, and MAYC, with a market cap of 4 million.
What do you think about Bitcoin-based NFT sales leading the ranks? Share your thoughts and opinions about this subject in the comments section below.
Bitcoin’s Price Tide: Could ASIC Miner Values Signal An Approaching Crypto Surge?
Adam Back, the co-founder and CEO of Blockstream, has recently drawn attention to a notable correlation, which is that the prices of ASIC (Application-Specific Integrated Circuit) miners tend to align with Bitcoin prices.
This parallel trend has been confirmed historically, with the miners peaking in price during the 2021 Bitcoin bull run, just as BTC reached its peak of ,000.
Back’s analysis shows that even as the market navigates through changing tides, the fate of mining equipment is an important piece of the puzzle for understanding the overall ecosystem.
The CEO of Blockstream also suggests that the price of ASIC miners is not just a reflection of manufacturing costs or technological advancements but also an indicator of market sentiment toward Bitcoin itself.
The Miners’ Market: A Reflection Of Bitcoin’s Value
According to Back in a video posted on X (formerly known as Twitter), during the prelude to the 2021 bull market, the price of ASIC miners was low, mirroring the anticipation and optimism of the Bitcoin community for a significant rally.
However, as Bitcoin’s value skyrocketed, so did the price for these mining machines, hitting a peak of 0/Terrahash (TH) alongside Bitcoin’s all-time high. Yet, with the subsequent decline in BTC value, the demand and price for ASIC miners plummeted, currently trading hands at under /TH—a stark contrast to their previous highs.
Despite a positive momentum for Bitcoin this year, ASIC miner prices have remained subdued. However, Back maintains an optimistic outlook for a potential resurgence in ASIC miner prices.
Historically there’s been a high correlation between ASIC miner and #Bitcoin prices. Learn how the new the Blockstream ASIC (BASIC) Note investment opportunity capitalizes on this thesis. Blockstream CEO Dr. @adam3us explains: pic.twitter.com/zHAqhLsGet
— Blockstream (@Blockstream) October 31, 2023
The CEO of Blockstream suggests that as Bitcoin enters deeper into a bull phase, the value of these essential mining components is likely to increase.
Back points to the upcoming Bitcoin Halving — an event that historically impacts Bitcoin’s price due to the reduced rate at which new Bitcoins are generated — as a possible catalyst for Bitcoin’s price surge and a parallel rise in ASIC miner values.
Bitcoin Path To Reclaim ,000
Despite several predictions and analyses about Bitcoin, the top crypto has continued to move at its own pace. After retracing from the previously tapped ,000, the asset has begun to thrive to reclaim that price zone.
Currently, the asset trades at ,269, down by 1.1% in the past 24 hours. However, looking at its weekly performance, Bitcoin still appears to be in gains. Though it has dropped by 0.7% in the past 7 days, it is still up by 20% in the past two weeks.
Back mentioned that the Bitcoin Halving appears as a significant milestone that could precede a notable increase in Bitcoin’s price, typically starting around six months post-halving.
While the CEO of Blockstream hesitates to make a definitive prediction about the exact outcome this time, he remains optimistic about Bitcoin’s prospects, positing that the cryptocurrency could still grow further this year or next year.
Featured image from Unsplash, Chart from TradingView
Elon Musk Warns Commercial Real Estate ‘Melting Down Fast’ — Predicts ‘Home Values Next’

Tesla and Spacex CEO Elon Musk says commercial real estate is “melting down fast,” warning that home values will be next. Some experts disagree with Musk regarding the residential real estate market, including Shark Tank star Barbara Corcoran. However, she agrees that the commercial real estate market is “going to be a bit of a bloodbath before it gets better.”
Elon Musk’s Real Estate Market Warnings
Tesla and Spacex CEO Elon Musk warned about real estate markets in a tweet Monday. The billionaire cautioned that the commercial real estate market is “melting down fast,” predicting that home values will be next.

Musk’s tweet was in reply to venture capitalist David Sacks, founder and partner of Craft Ventures, who extensively discussed the challenges faced by the commercial real estate market through a series of tweets over the past few days.
Sacks highlighted the effects of the Federal Reserve raising interest rates from near 0% to about 5% in the past year, stating that they correspond to the “3 stages of the financial crisis we’re in.” Noting that the first stage is the banking crisis, the second is the commercial real estate crisis, and the third is the government debt crisis, the VC stressed:
We’re seeing the first stage play out now. The second and third stages are yet to come.
Multiple people have warned about the impending collapse of the commercial real estate market, including Shark Tank star Barbara Corcoran. The veteran real estate investor said Wednesday that the commercial market is “in trouble,” stating that “no one has the confidence to buy now” and “no one really believes it’s going to turn the corner.” She opined:
I don’t see that turning around. I think it’s going to be a bit of a bloodbath before it gets better.
Experts Disagree With Musk on Residential Real Estate Market
While Musk warned about a potential decline in home values, some people disagreed. Federal Reserve Governor Michelle Bowman stated on Wednesday that home prices have been “leveling out recently, which has implications for our fight to lower inflation.”
Corcoran similarly told Fox Business Wednesday that the residential real estate sector is beginning to rebound, emphasizing that Musk is wrong. “So you get a Mexican standoff going on, but things are changing,” the Shark Tank star detailed. “The people who are going out there and buying are finding they’re overbuilding. They’re having a hard time getting their hands on the house. And right now, what everybody’s afraid of is the high-interest rates. But the minute those interest rates come down, all hell is going to break loose and prices are going to go through the roof.”
Glenn Kelman, the CEO of residential real estate brokerage operator Redfin, also disagreed with Musk. Responding to the Tesla CEO’s tweet, he wrote:
The loss in demand for commercial real estate is what’s driving demand for residential real estate. People who work from home need more space at home. Sales volume is down because inventory is down. Today, home prices increased for a second straight month.
Do you agree with Elon Musk regarding commercial and residential real estate markets? Let us know in the comments section below.
Bitcoin Coinbase Premium Declines, But Still At Green Values, Bullish Signal?
Data shows the Bitcoin Coinbase Premium has seen some decline, but the metric remains at very positive values, a sign that may be bullish for the price.
Bitcoin Coinbase Premium Index Has Registered A Decrease Recently
As pointed out by an analyst in a CryptoQuant post, the BTC Coinbase Premium Index hit a new all-time high just a few days ago. The “Coinbase Premium Index” here is an indicator that measures the percentage difference between the Bitcoin price listed on Coinbase and that on Binance.
Usually, Binance receives global traffic, while the Coinbase userbase is more heavily dominated by investors based in the US. Large American institutions, especially, are popularly known to prefer the exchange.
This means that the Coinbase Premium Index can give us an idea about which of the userbases are currently buying more (or selling more) of the cryptocurrency.
When the value of this metric is positive, it means the price listed on Coinbase is more than that on Binance right now. This kind of trend implies that US investors are putting a higher amount of buying pressure (or alternatively, they are applying a lower amount of selling pressure) compared to the worldwide users.
On the other hand, the metric having negative values suggests a higher degree of selling has been taking place by the American investors than the global Binance userbase.
Now, here is a chart that shows how the Bitcoin Coinbase Premium Index has changed recently:
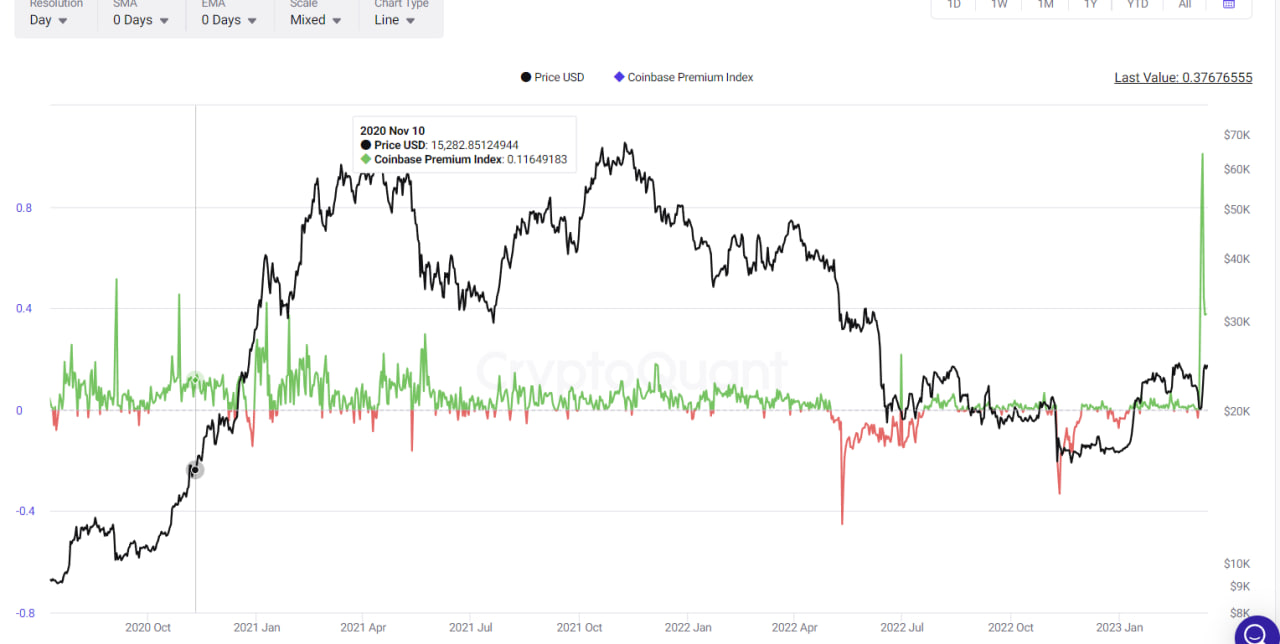
As displayed in the above graph, the Bitcoin Coinbase Premium Index shot up inside the positive zone as the Silicon Valley Bank debacle took place a few days back. During this spike, the indicator set a new all-time high of about 1, which means that the price listed on Coinbase was around 1% more than on Binance.
Shortly after the metric started to surge, the price of the cryptocurrency also began to lift off. This was a sign that the buying pressure from the US investors on Coinbase was a factor in the asset’s value shooting up.
After the price peaked above ,000, however, the Coinbase Premium Index started sliding off, and the indicator has now fallen to just under 0.4 as the BTC price has also observed a plunge below the ,000 level.
The fact that the buying pressure dropping off on Coinbase was followed by the price also seeing a decline may be further evidence that it was indeed the accumulation from the American investors that was fueling the surge.
Nonetheless, even with the decline, the indicator’s value is still pretty positive, which means that the buying pressure hasn’t completely disappeared yet. This could be a bullish sign for the asset’s price, as it may show that some US investors are still backing the potential of the cryptocurrency’s rise to continue.
BTC Price
At the time of writing, Bitcoin is trading around ,800, up 15% in the last week.
Bitcoin 30-Day Long-Term Holder SOPR Is Yet To Hit Bottom Values
On-chain data shows the Bitcoin 30-day long-term holder SOPR hasn’t yet reached the historical bottom level during the current cycle.
Bitcoin 30-Day Long-Term Holder SOPR Has Declined Recently
As pointed out by an analyst in a CryptoQuant post, the long-term holders haven’t attained their maximum pressure point yet.
The “Spent Output Profit Ratio” (or SOPR in short) is an indicator tells us whether the average Bitcoin investor is selling at a profit or at a loss right now.
When the value of this metric is less than 1, it means the overall market is realizing some amount of profit currently.
On the other hand, the indicator having values than the threshold suggests that investors as a whole are moving coins at a loss at the moment.
“Long-term holders” (LTHs) are a cohort of Bitcoin investors who hold their coins for at least 155 days before selling or moving them.
Here is a chart that shows the trend in the 30-day moving average BTC SOPR over the last several years specifically for these LTHs:
The 30-day MA value of the metric seems to have been going down in recent days | Source: CryptoQuant
As you can see in the above graph, the 30-day MA Bitcoin LTH SOPR seems to have hit a specific level around the price bottom in each of the previous two cycles.
These touches of the level in the loss region didn’t exactly coincide with the cycle lows, but they were still quite close, making them good buying opportunities for the crypto.
In recent months, as the bear has taken over, the indicator’s value has declined below the 1 mark, implying the LTHs have been selling at a loss recently.
While the metric has declined deep into the red zone by this point, it’s still not at the level where the historical cycles observed their bottoms.
Though, as the chart shows in the bottom, the DPO (an indicator that’s popularly used for finding cycle tops and bottoms of any quantity) of the LTH SOPR has started turning back up recently.
In the past bear markets, the LTH SOPR reached the bottom level not too long after the DPO reversed trend like this. If a similar pattern follows now as well, it may not be too long until long-term holder loss selling reaches its maximum point.
BTC Price
At the time of writing, Bitcoin’s price floats around .2k, up 1% in the past week.
Looks like BTC has been moving sideways again during the last few days | Source: BTCUSD on TradingView
Featured image from Kanchanara on Unsplash.com, charts from TradingView.com, CryptoQuant.com
NewsBTC
Ethereum Bullish Signal: Exchange Inflows Decline To Low Values
On-chain data shows the Ethereum exchange inflows have declined to low values recently, a sign that could be bullish for the crypto’s price.
Ethereum 7-day MA Exchange Inflows Have Gone Down In Recent Weeks
As pointed out by an analyst in a CryptoQuant post, the ETH price has been reversing up as the PoS merge comes near.
The “exchange inflow” is an indicator that measures the total amount of Ethereum moving into wallets of all centralized exchanges.
When the value of this metric shoots up, it means a large number of coins are being deposited into exchanges right now. Since investors usually transfer to exchanges for selling purposes, such a trend can be bearish for the price of the crypto.
On the other hand, low values of the indicator can suggest holders aren’t sending in many coins to exchanges at the moment. Depending on whether they are also withdrawing or not, this trend could be either bullish or neutral for the value of ETH.
Now, here is a chart that shows the trend in the Ethereum 7-day moving average all exchanges inflow over the past six months:
The 7-day MA value of the metric seems to have been going down in recent days | Source: CryptoQuant
As you can see in the above graph, the Ethereum exchange inflows sharply rose up in June and hit a peak. The price simultaneously suffered a big hit due to the selloff.
Following this surge, the indicator’s value started to observe a decline. Around when the ETH developers announced the 19th September date for the PoS merge, the coin’s price started making recovery as the inflows continued to trend down.
Now the metric finds itself at pretty low values. There has only been one dip below the current values in 2022, which was back in March.
These rock-bottom inflow values can imply Ethereum might see more bullish momentum in the near future as long as the selling pressure remains muted.
The chart also displays data for the “open interest,” another on-chain indicator that measures the amount of positions currently open in the derivatives market.
It looks like the ETH positions have recently seen some growth. An active futures market can result in higher volatility due to excess of leverage, and in this year so far, high open interest hasn’t been constructive for the crypto’s price.
ETH Price
At the time of writing, Ethereum’s price floats around .7k, up 12% in the last week. Over the past month, the crypto has gained 56% in value.
The below chart shows the trend in the price of the coin over the last five days.
Looks like the value of the crypto has moved sideways recently | Source: ETHUSD on TradingView
Featured image from Bastian Riccardi on Unsplash.com, charts from TradingView.com, CryptoQuant.com
NewsBTC
Bitcoin Trading Volume Has Now Stabilized At High Values, But For How Long?
Data shows the Bitcoin trading volume now seems to be stabilizing at higher values than 2022’s average, but given the trend in the metric this year so far, it may not last too long.
7-Day Average Bitcoin Trading Volume Has Remained Fixed Around Billion Recently
According to the latest weekly report from Arcane Research, after staying at low values for much of 2022, the BTC trading volume looks to have found some ground at high values recently.
The “daily trading volume” is an indicator that measures the total amount of Bitcoin being transacted on the blockchain on any given day.
When the value of this metric goes up, it means the BTC network is becoming more active as a larger amount of coins are being moved around on the chain.
On the other hand, when the value of the volume decreases, it implies the network is turning less active. Such a trend may be there because investors are waiting for the crypto to reach certain price targets before they make their move. It may also just show a general lack of interest around Bitcoin at the moment.
Related Reading | Bitcoin Exchange Reserve Has Now Reached An Equilibrium After 2 Years Of Downtrend
Now, here is a chart that shows the trend in the BTC trading volume over the past year:
The indicator seems to be at high values for 2022 right now | Source: Arcane Research’s The Weekly Update – Week 9, 2022
As you can see in the above graph, the Bitcoin trading volume seems to be around billion right now, and has been around this value for some time now.
This value is significantly higher than what has been there for much of 2022. This means that the network has become more active recently.
Related Reading | Why Is Bitcoin So Volatile, Anyway? Fidelity Digital Assets Explains
However, a few times in the year already the metric has shown similar surges, but the volume always died down soon after.
If Bitcoin isn’t able to make any significant price moves in the near term, the volume may once again sink down as traders start becoming disinterested, just like the instances earlier in 2022.
Low volume can be quite problematic for the crypto since any big price move requires a sufficiently large amount of traders participating, but as during periods of low volume the activity is low, a big price climb won’t sustain for too long.
BTC Price
At the time of writing, Bitcoin’s price floats around .9k, down 4% in the past week. The below chart shows the trend in the price of the coin over the last five days.
Looks like the price of Bitcoin has surged up over the past 24 hours | Source: BTCUSD on TradingView
Featured image from Unsplash.com, charts from TradingView.com, Arcane Research
NewsBTC