 As the Bitcoin network nears its fourth halving event, numerous market watchers and cryptocurrency enthusiasts are curious about whether the price will experience a temporary decline before the halving occurs. Historically, bitcoin’s value has surged six to seven months ahead of halvings, yet there has consistently been a significant decrease before the subsequent increase that […]
Bitcoin News
Bitcoin ETFs Threaten Gold’s Dominance As Digitalization Trends Gain Momentum
In just over a month since their approval by the US Securities and Exchange Commission (SEC), Bitcoin ETFs have swiftly gained traction in the market, posing a formidable challenge to the long-standing dominance of gold ETFs.
Bitcoin ETFs Gain Ground on Gold ETFs
The rapid rise of Bitcoin ETFs has led to a convergence in asset values, with BTC ETFs closing the gap with gold ETFs. Bitcoin ETFs hold approximately billion in assets after only 25 trading days, while gold ETFs have accumulated billion in over 20 years of trading.
In this regard, Bloomberg’s Senior Commodity Strategist, Mike McGlone, emphasizes the shifting landscape, stating, “Tangible Gold is Losing Luster to Intangible Bitcoin.”
According to McGlone, the US stock market’s continued resilience, the US currency’s strength, and 5% interest rates have presented headwinds for gold. Moreover, as the world increasingly embraces digitalization, the emergence of Bitcoin ETFs in the United States adds further competition to the precious metal.
McGlone further states that while the bias for gold prices remains upward, investors who solely focus on gold may risk falling behind potential paradigm-shifting digitalization trends.
Ultimately, McGlone suggests that investors should consider diversifying their portfolios by incorporating Bitcoin or other digital assets to stay ahead in the evolving investment landscape.
Bitcoin Rally Driven By Institutional Demand
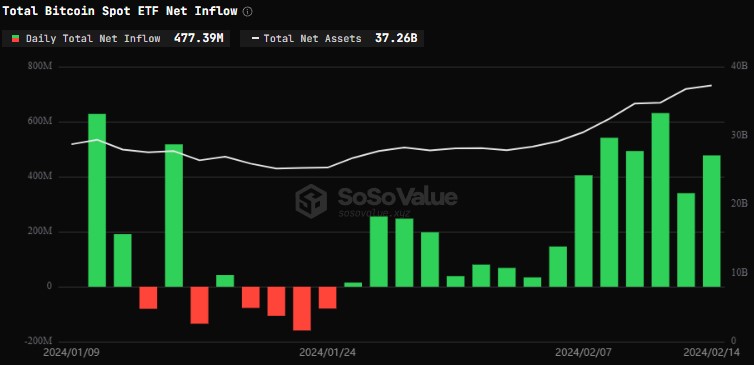
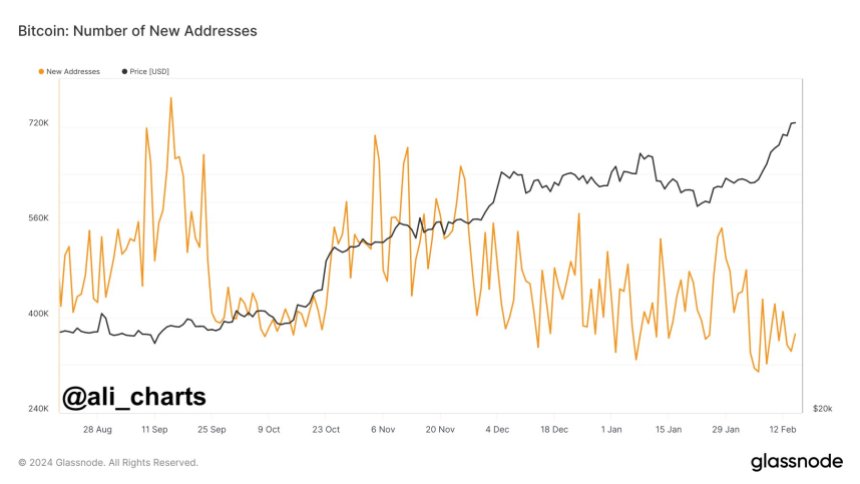
The success of Bitcoin ETFs is further demonstrated by recent data suggesting that the upward trend in Bitcoin prices is driven primarily by institutional demand. At the same time, retail participation appears to be declining.
According to analyst Ali Martinez, as the price of Bitcoin continues to hover between ,800 and ,100, there has been a noticeable decrease in the creation of new Bitcoin addresses daily, indicating a lack of retail participation in the current bull rally and highlighting the growing influence of institutional investors in the cryptocurrency market.
However, market expert Crypto Con points out a significant shift in Long-Term Bitcoin holder positions, signaling a potential downside movement.
As seen in the chart below shared by Crypto Con, the position change line crossed below -50.00 for the first time in over a year, a pattern that has historically occurred at critical moments in Bitcoin’s market cycles. These moments include the cycle bottom, mid-top (which occurred only once), and the start/end of a cycle top parabola (which occurred most frequently).
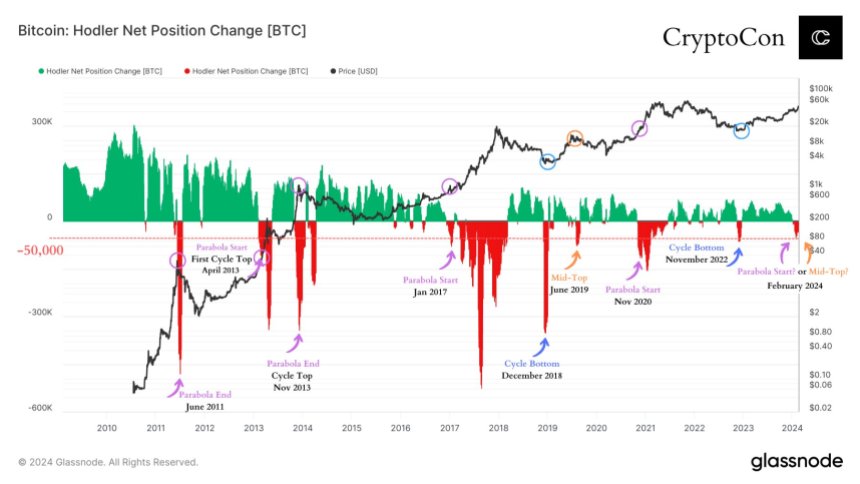
According to Crypto Con, this recent shift in long-term holder positions raises two possible scenarios: a mid-top or an imminent parabolic movement. Such a movement at this stage in the cycle is considered unusual.
Primarily, it indicates that long-term Bitcoin holders are exiting their positions in significant numbers, possibly anticipating a market correction or a change in the overall trend.
Overall, the shift in Bitcoin holder positions and the decline in retail participation present contrasting dynamics in the current market landscape. While institutional demand continues to drive the price of Bitcoin higher, long-term holders appear to be taking profit or adjusting their positions.
While BTC is currently trading at ,800, it remains to be seen what the direction of the next move will be and how institutions will continue to influence the price action of the largest cryptocurrency as spot Bitcoin ETFs gain traction.
Featured image from Shutterstock, chart from TradingView.com
Bitcoin Soars Above $52K, Yet Public Interest Shows Decline, Google Trends Data Reveals
 As bitcoin’s value surged to ,545 this week, the fascination with it appears subdued, with Google Trends indicating a low level of interest. Currently, global metrics from the last 90 days reveal the search term “bitcoin” holds a score of 36 out of 100, significantly less than when bitcoin first exceeded the K threshold nearly […]
Bitcoin News
Can Bitcoin Overcome Past Trends? Examining The Pre-Halving Rally And Resistance Levels
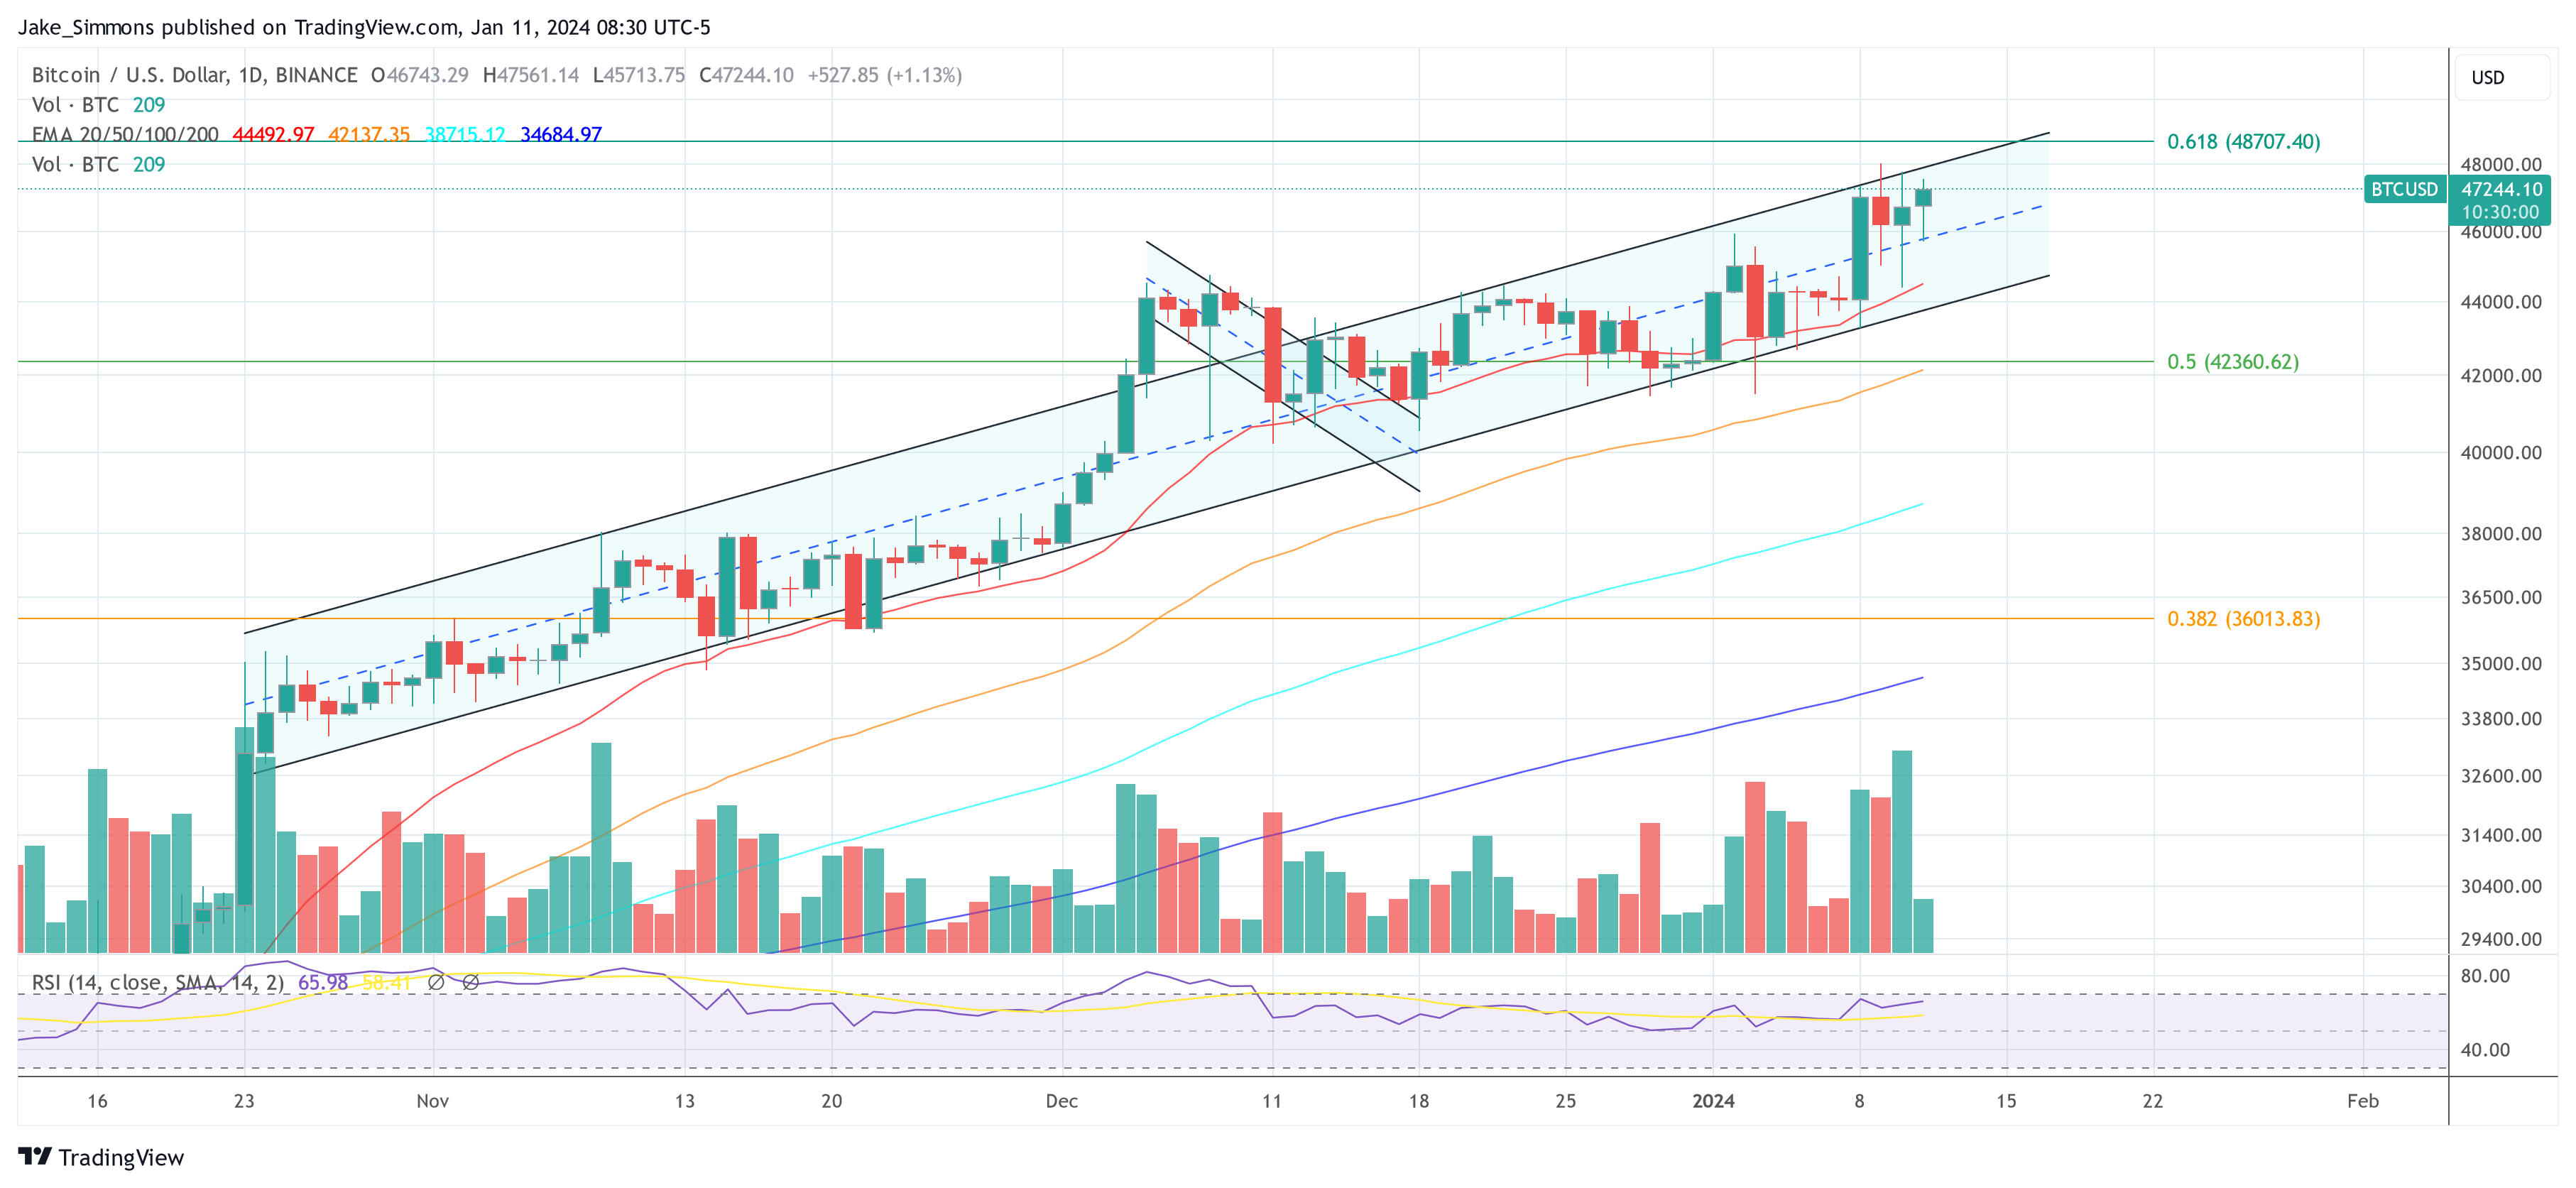
Bitcoin (BTC), the largest cryptocurrency in the market by trading volume and capitalization, has embarked on a renewed bullish uptrend, reclaiming previously lost territories and surpassing resistance levels, igniting optimism among investors.
Currently trading just below its 25-month high of ,000 at ,900, Bitcoin has experienced a remarkable price increase of over 6% within 24 hours and a significant 11% surge over the past seven days.
Mapping BTC’s Path Amidst Pre-Halving Rally
However, amidst the market’s excitement, it is crucial to consider historical tendencies and their potential impact on Bitcoin’s trajectory leading up to the upcoming halving event. Market expert and analyst Rekt Capital highlights two noteworthy historical patterns:
Firstly, the “Pre-Halving Rally” phase appears to be commencing. This phase refers to a period where Bitcoin experiences a surge in price before the halving event takes place.
Secondly, historical data reveals that Bitcoin has struggled to break beyond the macro diagonal resistance before the halving, which Rekt places at ,000. Additionally, it has encountered difficulty surpassing its Four Year Cycle resistance, which is approximately ,000 in the current cycle.
It is worth noting that even though the price has surpassed these resistance levels, a consolidation or continuation of the uptrend must be seen, as a retracement could take place and leave the BTC price stuck between these resistances.
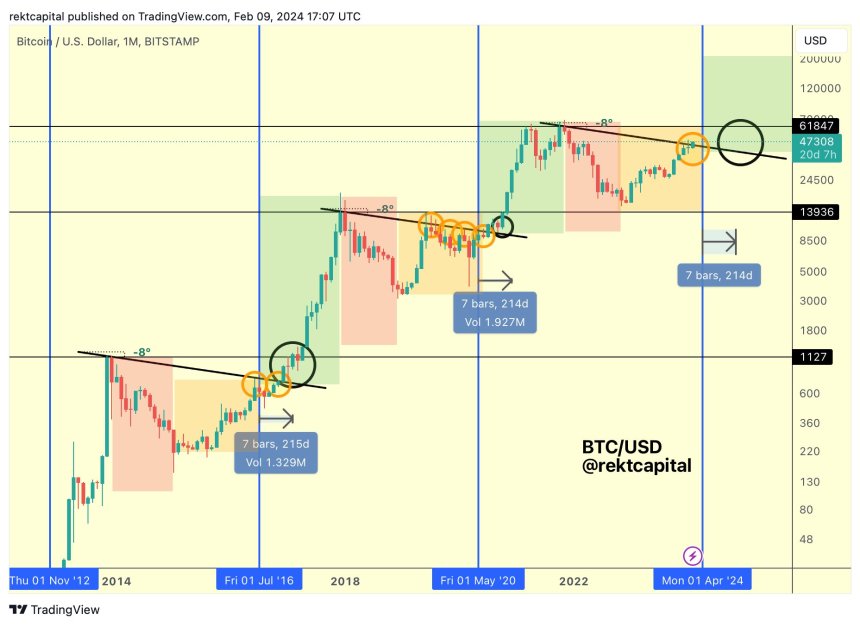
Given these historical trends, exploring how Bitcoin could potentially reconcile these patterns is interesting. Rekt Capital offers insights into one possible path that Bitcoin could take:
During the pre-halving rally phase, Bitcoin may produce limited upside, resulting in an upside wick at the end of February. This pattern has been observed in previous months and 2019.
Following this, Bitcoin might establish another range at higher price levels in March, potentially allowing altcoin rallies to take center stage. Finally, a few weeks before the halving event, Bitcoin could experience a pullback, creating a pre-halving retrace.
This proposed path suggests that Bitcoin could surpass the Macro Diagonal resistance with an upside wick but remain below it in terms of end-of-month monthly candle closes during this gradually concluding pre-halving period.
Bitcoin Bull Run Indicator Flashing Buy Signal
Crypto analyst Ali Martinez has added to the growing bullish sentiment surrounding Bitcoin by highlighting a key indicator that suggests potential upside movement.
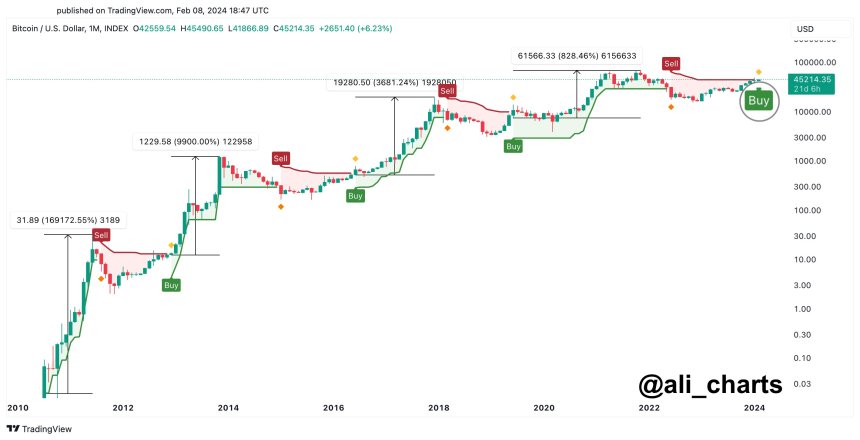
According to Martinez, the Super Trend indicator flashed a buy signal on the BTC monthly chart. This tool is renowned for its precision in predicting bullish trends in Bitcoin markets.
The indicator’s track record underscores the significance of this buy signal. Martinez points out that the Super Trend has issued four buy signals since Bitcoin’s inception, and all four have been validated, leading to substantial gains. These gains amount to an impressive 169,172%, 9,900%, 3,680%, and 828%, respectively.
However, amidst the bullish outlook, Martinez also highlights a potential strategy that may soon impact Bitcoin’s price.
According to the Bitcoin liquidation heatmap, a scenario is unfolding where liquidity hunters could drive the price of Bitcoin down to ,810. The intention behind this move would be to trigger liquidations amounting to a substantial .73 million.
It is important to understand that liquidity hunters aim to exploit price movements to trigger forced liquidations among overleveraged traders. By strategically driving the price down, they can force these traders to sell their positions, resulting in cascading liquidations that potentially amplify price downward movements.
Featured image from Shutterstock, chart from TradingView.com
Report: Ethereum and Solana Showcase Unique Market Dynamics in Recent Altcoin Trends

In the dynamic world of crypto markets, recent trends have illuminated intriguing divergences in the altcoin market, particularly between ethereum and solana, relative to bitcoin. A comprehensive report published by Glassnode, an onchain analytics firm, delves into this phenomenon.
Altcoin Dynamics Altered: Ethereum and Solana Lead Post-ETF Era
In the latest edition of Glassnode’s “The Week Onchain,” Alice Kohn’s research, published on Jan. 23, 2024, highlights ethereum’s (ETH) standout performance, marked by a notable surge in derivatives market activity, and the impressive journey of solana (SOL), especially post-bitcoin exchange-traded fund (ETF) approval. Ether has recently outshone bitcoin, recording its strongest performance since late 2022. Kohn’s report notes a surge of over 20% in ethereum’s value relative to bitcoin, coinciding with a revitalized interest in ethereum’s derivatives market.

This resurgence, signaling a potential shift in capital flows, has led to increased speculation about a forthcoming spot-based ethereum ETF. However, despite these gains, ethereum still trails behind the broader altcoin market in terms of momentum, underperforming by 17%. Solana, on the other hand, has charted a different course, Glassnode’s report details. SOL witnessed exceptional price performance last year, despite setbacks linked to its association with FTX.
SOL has significantly outperformed ETH in this period, with the SOL/BTC ratio increasing by 290% since October 2023. Interestingly, unlike ETH, solana’s price did not experience a significant revaluation following the BTC ETF approvals, as Glassnode’s Kohn suggests a divergent market response to broader sector movements. The broader altcoin market, as a whole, has seen nearly a 69% increase in market cap since the filing of the Blackrock Bitcoin ETF.
On Jan. 14, 2024, Bitcoin.com News highlighted that blockchaincenter.net’s Altcoin Season Index indicated the commencement of altseason. The index continues to declare it is “altcoin season,” with the leading 50 coins outperforming BTC in the previous season (90 days). Glassnode’s Kohn emphasized that the trend is primarily driven by tokens related to ethereum scaling solutions such as Optimism, Arbitrum, and Polygon. Staking and Gamefi tokens also outperformed BTC in the early stages of 2023, indicating a varied appetite for risk across different altcoin sectors.
Kohn’s research stresses the importance of these developments: “The approval of the new bitcoin ETFs has become a classic sell-the-news event, leading to a tumultuous few weeks in the market.” Glassnode says that ethereum has emerged as the short-term winner, with investors recording a multi-year high in net realized profits. This suggests a growing willingness to engage in speculative activities, particularly concerning an ETH ETF and capital rotation.
What do you think about Glassnode’s report concerning altered altcoin dynamics in the crypto market? Let us know what you think about this subject in the comments section below.
Bitcoin Expected To Mirror Historical Trends: Glassnode Sets $120K Price Prediction For 2024
Bitcoin (BTC), the largest cryptocurrency in the market, has encountered a significant downturn following the waning hype around exchange-traded funds (ETFs), resulting in a 9% decline over the past fourteen days.
However, Glassnode co-founders remain optimistic, asserting that the recent price corrections align with historical patterns and could propel Bitcoin to new heights, nearly doubling its current all-time high (ATH) of ,000.
Healthy Market Correction?
In their latest analysis, the co-founders of the blockchain analytics firm posted on X (formerly Twitter), highlighting Bitcoin’s movement to the 6.618 Fibonacci Extension after a Bull Flag Correction.
They draw parallels between the current correction and similar market conditions observed in late 2017 and 2020. The question arises: Will history repeat itself in 2024, and will Bitcoin reach its 6.618 Fibonacci Extension during this bullish market, setting a target of approximately 0K?

Examining the chart above, the analysis by the Glassnode co-founders reveals a comparable price correction following Bitcoin’s breakout above the ,000 price level, which initiated the bull trend that propelled the cryptocurrency to a ,000 increase before reaching its current ATH of ,000.
Likewise, Bitcoin exhibited a similar bull flag pattern after surpassing the ,000 price level, leading to a 22-month high of ,900 on January 11. Notably, this surge occurred shortly after the approval of Bitcoin spot ETFs by the U.S. Securities and Exchange Commission (SEC).
Considering these developments, the key to Bitcoin’s future trajectory lies in maintaining support around the ,000 level and further consolidation above it. If these conditions are met in the coming months, Bitcoin has the potential to reach the 6.618 Fibonacci extension, pushing its price as high as 0,000.
New All-Time Highs Expected For Bitcoin
Like Glassnode co-founder’s recent price analysis, crypto analyst Crypto Con also relies on historical patterns to gauge the future price action of BTC. According to Crypto Con, the mid-top of this Bitcoin price cycle occurred slightly faster than previous cycles but slower than the third cycle.
Notably, this mid-top represents the only instance where it occurred outside of an early top, as indicated by the purple and yellow dots on the chart provided by the analyst.

Despite the 2019 mid-top occurring a year earlier than expected, the cycle top still manifested within the usual timeframe, plus or minus 21 days from November 28th, 2021.
Crypto Con stresses that there is currently no evidence apart from complex theories to support the notion of an accelerated cycle. The analyst cautions against assuming that ETFs prevent potential Bitcoin price corrections.
After November 28th, 2024, Crypto Con predicts the emergence of new all-time highs for the Bitcoin price of ,000 or 0,000 and significant growth for the cryptocurrency market.
At the time of writing, BTC is trading at ,590, down 2.5% in the past 24 hours. If this level is breached, Bitcoin could drop towards the ,650 level as it is the next major support for the cryptocurrency.
Featured image from Shutterstock, chart from TradingView.com
Ethereum Technical Analysis: Bearish Trends Dominate Across Multiple Timeframes
Similarly to bitcoin’s action, the second largest crypto asset by market cap, ethereum, has seen some market turmoil and a distinct downtrend. As of Jan. 22, 2024, ether has shown a notable decrease, registering a 3.3% drop in 24 hours and a 5.7% decline over the past week.
Ethereum
Ethereum’s (ETH) market capitalization stands at 7 billion, a reflection of its significant presence in the crypto market. However, its 24-hour trading range of ,364 to ,479 and a 24-hour trade volume of .84 billion indicate a period of heightened volatility and trader caution. This is underscored by the current price of ,380 per ETH, which is down from recent highs, suggesting a bearish sentiment among traders.
The oscillators paint a picture of neutrality with a slight inclination towards bearishness. The relative strength index (RSI) at 48.8, Stochastic at 47.1, and the commodity channel index (CCI) at -10.3 all indicate a neutral stance. However, the momentum indicator at -127.9 signals bullish sentiment, whereas the moving average convergence/divergence (MACD) level at 46.8 suggests bearish action, highlighting the mixed signals in the current market.
Ethereum’s moving averages (MAs) predominantly suggest a bearish outlook. The short-term exponential moving averages (EMAs) at 10 and 20 days, along with the simple moving averages (SMAs) at the same periods, show bearish sentiment. In contrast, longer-term MAs, particularly the EMAs and SMAs for 50, 100, and 200 days, indicate bullish opportunities. This divergence between short-term and long-term MAs could suggest a potential shift in market dynamics.
The 4-hour chart analysis presents a marked downtrend, marked by successive declines, signaling robust bearish momentum. A slight uptick on Monday morning at 9 a.m. Eastern Time hints at a possible recovery, but the subdued trading volume implies a weak buying interest. For traders, considering entry points would depend on a clear trend shift, while opportunities for exiting or engaging in short-selling might emerge with the confirmation of a persistent downtrend.
Parallel to the 4-hour chart, the daily chart underscores this downtrend through a sequence of unbroken drops. A significant sell-off, characterized by heavy volume, underscores the prevailing bearish mood. The subsequent price action indicates a state of market uncertainty. Savvy traders eyeing long positions should be vigilant for signs of bullish trend reversals, whereas those looking to exit or take short positions may find opportunities in the ongoing downtrend. Currently, the trend appears to be inclined towards a downward trajectory.
On the one-hour chart, the detailed view corroborates the bearish trend observed in the longer-term analyses, as evidenced by a consistent pattern of declines forming lower lows. This morning’s rise may suggest a temporary trend reversal; however, the modest volume accompanying this increase still warrants caution.
Bull Verdict:
The current ETH market, while showing signs of bearish trends in the short term, holds the potential for a bullish reversal. Key indicators such as the long-term moving averages and certain oscillator readings suggest underlying strength. This, coupled with the potential for market dynamics to shift rapidly in the ethereum trading arena, could pave the way for a bullish resurgence.
Bear Verdict:
Ether’s market analysis, predominantly driven by the current bearish sentiment visible in the short-term moving averages and oscillator readings, indicates a continuation of the downward trend. The consistent pattern of declining prices across various time frames, coupled with high volatility and cautious trader behavior, suggests a bear market scenario.
Register your email here to get weekly price analysis updates sent to your inbox:
What do you think about ether’s market action on Monday morning? Share your thoughts and opinions about this subject in the comments section below.
Bitcoin Hits Peak Interest on Google Trends Following SEC’s ETF Approvals

In the week spanning Jan. 7th to the 13th, 2024, Google Trends revealed a peak interest score of 100 for the search term bitcoin. A closer examination of Google Trends over the past three months highlights that this interest surged to its apex on Jan. 11. This was the day after the U.S. Securities and Exchange Commission (SEC) sanctioned 11 spot bitcoin exchange-traded funds (ETFs). Following the buzz around the ETF approvals, attention is now shifting towards Bitcoin’s upcoming reward halving.
2024 Sees Bitcoin Reach New Heights in Online Searches Post-ETF Approval
Over the previous year, dating back to the week of Jan. 15th to 21st, 2023, the search term “bitcoin” garnered a rating of 55 out of a possible 100, as shown by Google Trends. Google’s service assigns a score from 1 to 100, reflecting the search interest for a given term in a specific time and location. The scoring is relative to the proportion of searches for a term like “bitcoin” against the total search volume during that period and place. A score of 100 signifies the term’s peak popularity. By the close of March 2023, the score for “bitcoin” had climbed to 65.

Throughout much of 2023, the search interest for “bitcoin” searches remained consistently low, bottoming out at a score of 35 in the week of October 8th to 14th. However, following this period, interest in the term began to rise, achieving a score of 61 in the final week of October. The peak for 2023 came in the week of December 3rd to 9th, when “bitcoin” hit a high of 70 out of 100. It wasn’t until the second week of January 2024, however, that the search term finally reached its zenith with a perfect score of 100.

Delving deeper into a 90-day snapshot of global search popularity, Google Trends reveals that the peak score of 100 for “bitcoin” was attained on Jan. 11. Yet, by Jan. 15, this figure had fallen to 41. With the buzz around the spot bitcoin ETFs fading, the fervor in search interest has similarly waned. As we enter the third week of January 2024, El Salvador emerges as the leading region for “bitcoin” searches, followed by Nigeria, Switzerland, Austria, and the Netherlands.
The related topics and queries circling “bitcoin” predominantly focus on ETFs. “Exchange-traded fund,” for example, ranks highly, alongside the “U.S. Securities and Exchange Commission.” Other prominent topics include “Solana,” “Tether,” and “Bitcoin Dominance.” Key associated queries feature terms like “bitcoin etf approval,” “bitcoin ETFs,” “bitcoin etf news,” “bitcoin ETF approved,” and “ETF bitcoin.” Additional trending topics linked to “bitcoin” are “Blackrock” and “bitcoin price.”
The next significant milestone for BTC is its reward halving, anticipated in April 2024. Analyzing the specific query “bitcoin halving” reveals a similarly spiked interest recently. This more refined term also achieved a peak score of 100 on Jan. 11, 2024, following the ETF approvals. However, since then, interest, primarily from Slovenia, Cyprus, Switzerland, the Netherlands, and Austria, has significantly diminished. As of Jan. 15, 2024, the “bitcoin halving” search term registers a score of 49.

The surge in search popularity, driven by the SEC’s ETF approvals and anticipation of the reward halving, underscores the leading crypto asset’s evolving influence in finance, technology, and economic freedoms. As interest normalizes, it’s evident that bitcoin continues to captivate global attention, reflecting its growing integration in mainstream economic discussions and its potential future impact. Nonetheless, widespread acceptance and engagement with the censorship-resistant asset must persist to maintain public interest. Only time will reveal its enduring appeal.
What do you think about the interest in bitcoin rising amid the ETF approvals and the drop that followed? Share your thoughts and opinions about this subject in the comments section below.
Analyst Predicts Cardano Future Using Historic Trends, And It’s Very Bullish
A crypto analyst has provided insights into why this year will be “massive” for Cardano (ADA) based on historical data. The analyst also highlighted how patience was key, as ADA could replicate a similar run like the one it did when it saw a gain of 8,288% following about two years of consolidation.
2024 Could Be Another Breakout Year For Cardano
In a recent video, the analyst behind the Crypto ZX YouTube channel alluded to ADA’s history as he provided a bullish narrative for the crypto token in this new year. He spoke about how Cardano launched at the peak of the 2018 bull market but didn’t make any significant gains until two years later.
ADA is said to have broken below the .11 support months after its launch and ranged within that time frame from around August 2018 to June 2020. After that, things began to pick up for the crypto token as it went up by 8,288% on its way to hitting its all-time of in 2021.
Based on this, the analyst urged ADA investors to be patient as he expects ADA to break out anytime soon and enjoy a parabolic move. He warned these investors against being like those who currently have regrets about not holding when ADA was at its lowest, considering that some of those who held made millions.
One Last Chance To Accumulate Before The Next Bull Run
The Crypto ZX analyst mentioned that the bear market cycle ends at the 78.6 Fibonacci retracement level. However, he noted that ADA is currently struggling to break that level as the selling pressure around that range is huge, and there is not enough demand for ADA. Going by previous cycles, he stated that “explosions” could come by May or June.
In his opinion, though, he believes that Cardano could get to that Fibonacci level before those months. However, he doesn’t expect “massive moves” until May at least. With this in mind and the fact that there could be another “shake-off” before Bitcoin Halving, the analyst believes this is a great opportunity to accumulate as many ADA tokens as possible.
Meanwhile, the “exciting times” will be in the third and fourth quarter of the year, as that is where this crypto analyst is personally targeting (possibly to take profits). He also predicted that this bull market would be the biggest of all time as he believes that other cryptocurrencies, including Cardano, could get their Spot ETF.
At the time of writing, ADA is trading at around .532, down in the last 24 hours, according to data from CoinMarketCap.
Top 8 Crypto Trends That Will Dominate The Market In 2024: Analyst
Renowned analyst Ted (@tedtalksmacro) has offered a detailed forecast for 2024 in the crypto market. His analysis on X (formerly Twitter) touches on several critical points, from macro events, the Bitcoin Halving to fresh liquidity in the market.
This is going to be quite a long post, summing up 2023 and looking ahead to the themes to watch if you're investing in 2024 – so please bare with me
Summing up 2023
– China printed almost trillion dollars but failed to push their economy out of the dumps– US…
— ted (@tedtalksmacro) January 11, 2024

#1 Spot Altcoin ETFs
Following the approval of spot Bitcoin ETFs and the anticipated approval of spot Ethereum ETFs, there is an expectation for a broader range of altcoin ETFs to emerge. Ted believes that the success of these initial ETFs will pave the way for more proposals and approvals, potentially by 2025.
He states, “The SEC has laid the precedent for many other crypto products to be proposed and approved, opening up even more avenues for large capital inflows into the crypto asset class.” Ted specifically mentions Solana and XRP as likely candidates for future ETFs. This development is seen as a significant step in attracting substantial capital inflows into the crypto asset class.
#2 The Federal Reserve Ending Quantitative Tightening
Ted forecasts that the Federal Reserve might cease or significantly slow down its current quantitative tightening (QT) program by Q3 of 2024. This prediction is based on the declining cash balance in reverse repos and aims to avoid a repeat of the funding stress experienced in 2019.
“An end to or a dramatic slowdown of the current QT programme could come even earlier though, given the scars of what happened back in 2019 following the monetary tightening of 2018,” he predicts. An end to QT could inject more liquidity into the market, potentially benefiting crypto assets.
#3 Resurgence Of Liquidity In Crypto
After a challenging period of 18 months marked by the collapse of crypto funds and exchanges and central bank tightening, Ted anticipates a return of liquidity to the crypto space. He points to stablecoin liquidity deltas approaching positive territory and the role of spot Bitcoin ETFs in attracting new capital, especially from investors seeking higher returns amid inflationary pressures.
#4 Bitcoin’s Halving Event
The anticipated Bitcoin halving in April 2024 is expected to create both a supply shock (due to reduced mining rewards) and a demand shock (following the approval of spot BTC ETFs). Historically, halvings have catalyzed significant price movements in Bitcoin, and Ted expects a similar pattern in 2024, with potential for substantial price increases following a brief post-halving sell-off.
#5 Inflation Stabilization
On the topic of inflation, Ted observes, “It typically takes 12-18 months for the full effects of changes in monetary policy to be felt in the economy, and we are verging into that territory now.” Despite the base effects of the 2021/22 inflation fading, Ted foresees a slight resurgence in inflation as economies continue to operate robustly.
However, he believes the central banks’ commitment to maintaining higher interest rates will cap the inflation rate below previous highs. He views this as an integral aspect of a strong economy and market.
#6 AI Advancement
Having witnessed AI go mainstream in 2023, Ted predicts 2024 to be a year of unprecedented improvements in AI technologies. This advancement is expected to boost AI stocks, crypto, and related products, enhancing productivity and potentially leading to deflation in developed economies.
#7 Dispelling Recession Fears
Contrary to predictions of a major recession, Ted anticipates continued economic growth, albeit at a slower pace than in 2023. Ted says, “Those calling for a recession akin to 08 or the Great Depression are likely to be disappointed… again.” He attributes this resilience to governments’ aggressive fiscal policies, including substantial cash injections and running large deficits.
#8 China’s Continued Monetary Expansion
Ted notes that China, struggling in the post-COVID era, is likely to continue its aggressive monetary policy, as evidenced by nearly trillion printed in 2023. He draws parallels with Japan’s situation in the 1990s, highlighting China’s focus on stimulating production over its flailing property market.
In summary, Ted’s analysis for 2024 presents a complex and dynamic picture of the crypto market, influenced by macroeconomic factors, regulatory developments, technological advancements, and geopolitical forces. These trends suggest a year of significant opportunities for investors in the crypto space.
At press time, BTC traded at ,244, up 5.1% in the last 24 hours.