 The landscape for altcoins appears notably bleak, with most experiencing consistent declines since March and with bitcoin’s dominance escalating, it diminishes the likelihood of a resurgence altcoin run-ups. On June 20, the X account ‘Altcoin Sherpa’ highlighted two prerequisites for an ‘Altcoin Season’ to emerge. Crypto Analyst Altcoin Sherpa Foresees Challenging Times for Altcoins The […]
Bitcoin News
Solana Price Faces Uphill Task: Tough Road Ahead For SOL Bulls
Solana tested the 8 zone before it started a recovery wave. SOL price must clear the 0 and 5 resistance levels to start a steady increase.
- SOL price is eyeing an upside break above the 0 resistance against the US Dollar.
- The price is now trading above 5 and the 100-hourly simple moving average.
- There is a connecting bullish trend line forming with support at 6 on the hourly chart of the SOL/USD pair (data source from Kraken).
- The pair could clear the 2.50 resistance to start a short-term uptrend.
Solana Price Eyes Steady Increase
Solana price extended losses below the 0 level like Bitcoin and Ethereum. SOL even declined below the 2 support before the bulls appeared near the 8 level. A low was formed at 8.01 and the price recently started a decent recovery wave.
The price was able to clear the 2 and 5 resistance levels. There was a move above the 50% Fib retracement level of the downward move from the 1.89 swing high to the 8.01 low. Solana price is now trading above 5 and the 100-hourly simple moving average. There is also a connecting bullish trend line forming with support at 6 on the hourly chart of the SOL/USD pair.
Immediate resistance is near the 0 level. The next major resistance is near the 2.50 level or the 61.8% Fib retracement level of the downward move from the 1.89 swing high to the 8.01 low.
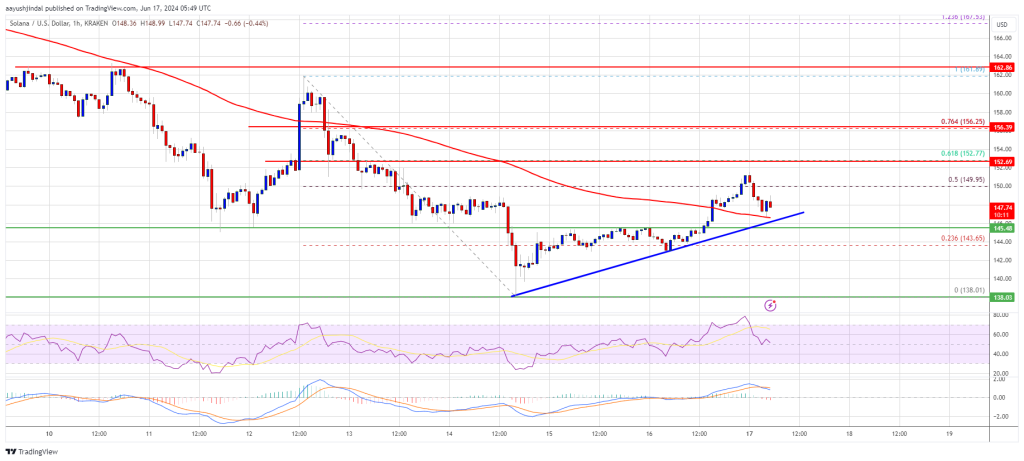
A successful close above the 2.50 resistance could set the pace for another major increase. The next key resistance is near 6.50. Any more gains might send the price toward the 0 level.
Another Decline in SOL?
If SOL fails to rally above the 2.50 resistance, it could start another decline. Initial support on the downside is near the 5 level and the trend line.
The first major support is near the 2 level, below which the price could test 8. If there is a close below the 2 support, the price could decline toward the 5 support in the near term.
Technical Indicators
Hourly MACD – The MACD for SOL/USD is losing pace in the bullish zone.
Hourly Hours RSI (Relative Strength Index) – The RSI for SOL/USD is near the 50 level.
Major Support Levels – 5, and 2.
Major Resistance Levels – 2.50, 6.50, and 0.
Solana’s Tough Climb: SOL Price Struggles to Find Solid Ground
Solana extended losses below the 0 support zone. SOL price is consolidating and might recover if it clears the 2.50 resistance zone.
- SOL price declined further and even traded below 0 against the US Dollar.
- The price is now trading below 0 and the 100-hourly simple moving average.
- There is a connecting bearish trend line forming with resistance at 0 on the hourly chart of the SOL/USD pair (data source from Kraken).
- The pair could clear the 2.50 resistance to start a short-term recovery wave.
Solana Price Eyes Recovery
Solana price remained in a short-term bearish zone like Bitcoin and Ethereum. SOL extended losses below the 0 support zone and is now consolidating losses. It is stuck below the 0 level.
There was a minor move above the 23.6% Fib retracement level of the downward move from the 3.25 swing high to the 5.03 low. Solana price is now trading below 5 and the 100-hourly simple moving average. Immediate resistance is near the 0 level.
There is also a connecting bearish trend line forming with resistance at 0 on the hourly chart of the SOL/USD pair. The next major resistance is near the 2.50 level. A successful close above the 2.50 resistance could set the pace for another major increase.
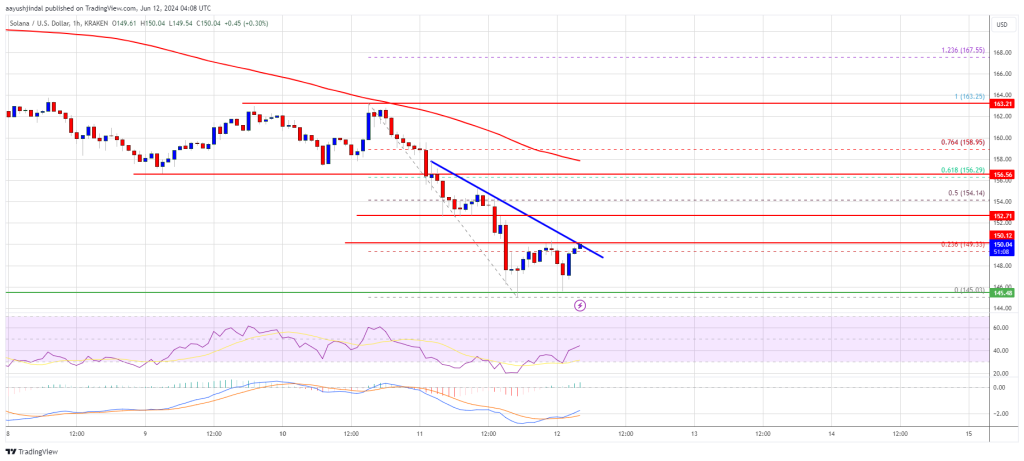
The next key resistance is near 7 or the 61.8% Fib retracement level of the downward move from the 3.25 swing high to the 5.03 low. Any more gains might send the price toward the 5 level.
More Losses in SOL?
If SOL fails to rally above the 2.50 resistance, it could start another decline. Initial support on the downside is near the 5 level.
The first major support is near the 2 level, below which the price could test 5. If there is a close below the 5 support, the price could decline toward the 0 support in the near term.
Technical Indicators
Hourly MACD – The MACD for SOL/USD is losing pace in the bearish zone.
Hourly Hours RSI (Relative Strength Index) – The RSI for SOL/USD is below the 50 level.
Major Support Levels – 5, and 2.
Major Resistance Levels – 2.50, 7, and 5.
Solana’s Tough Climb: SOL Price Struggles to Find Solid Ground
Solana extended losses below the 0 support zone. SOL price is consolidating and might recover if it clears the 2.50 resistance zone.
- SOL price declined further and even traded below 0 against the US Dollar.
- The price is now trading below 0 and the 100-hourly simple moving average.
- There is a connecting bearish trend line forming with resistance at 0 on the hourly chart of the SOL/USD pair (data source from Kraken).
- The pair could clear the 2.50 resistance to start a short-term recovery wave.
Solana Price Eyes Recovery
Solana price remained in a short-term bearish zone like Bitcoin and Ethereum. SOL extended losses below the 0 support zone and is now consolidating losses. It is stuck below the 0 level.
There was a minor move above the 23.6% Fib retracement level of the downward move from the 3.25 swing high to the 5.03 low. Solana price is now trading below 5 and the 100-hourly simple moving average. Immediate resistance is near the 0 level.
There is also a connecting bearish trend line forming with resistance at 0 on the hourly chart of the SOL/USD pair. The next major resistance is near the 2.50 level. A successful close above the 2.50 resistance could set the pace for another major increase.
The next key resistance is near 7 or the 61.8% Fib retracement level of the downward move from the 3.25 swing high to the 5.03 low. Any more gains might send the price toward the 5 level.
More Losses in SOL?
If SOL fails to rally above the 2.50 resistance, it could start another decline. Initial support on the downside is near the 5 level.
The first major support is near the 2 level, below which the price could test 5. If there is a close below the 5 support, the price could decline toward the 0 support in the near term.
Technical Indicators
Hourly MACD – The MACD for SOL/USD is losing pace in the bearish zone.
Hourly Hours RSI (Relative Strength Index) – The RSI for SOL/USD is below the 50 level.
Major Support Levels – 5, and 2.
Major Resistance Levels – 2.50, 7, and 5.
Meta Faces Tough Market Response as AI Investments Surge and Metaverse Losses Continue
 Meta’s shares dropped 15% in after-hours trading following announcements in April of plans for significant investment in AI, alongside a weaker revenue outlook and continued losses in its metaverse division, Reality Labs. The company anticipates its expenses will soar to between billion and billion for the fiscal year, attributing the increase to higher […]
Bitcoin News
Stellar Tough Spot: Will XLM Prices See A Dip Amid Mid-Range Struggles?
Stellar (XLM) investors were in for a surprise over the weekend as the cryptocurrency staged a remarkable comeback, defying the prevailing bearish trend across the crypto market.
The token’s price surged by 7.3% in the past 24 hours and recorded a 2.3% increase over the past week, now resting at .122461 according to CoinGecko.
While cryptocurrency enthusiasts are rejoicing over the impressive price performance, the question that lingers on everyone’s mind is: why did Stellar’s price jump during the weekend? Two plausible explanations have emerged.
XLM Surge Potential Triggers
One likely catalyst for the sudden Stellar surge is the tantalizing tease from its developers regarding an important announcement scheduled for next week. This cryptic hint has stirred anticipation and speculation in the crypto community, with investors eagerly awaiting what could be a game-changing revelation for Stellar.
Something cool is dropping in 10 days.
Get ready to gear up for a change that’s got us all excited. Stay curious
pic.twitter.com/CgNzfzwqmc
— Stellar (@StellarOrg) September 2, 2023
Another factor that might have contributed to the bullish sentiment around Stellar is the upcoming Meridian event set to be hosted by the blockchain platform later this month in Spain.
Meridian, known as Stellar’s flagship annual event, is expected to bring together a multitude of influential speakers from the blockchain and cryptocurrency space. Their speeches and insights have the potential to significantly influence market dynamics, possibly explaining the increased demand for XLM.
25 days until #Meridian2023! Get ready to dive into over 70 insightful sessions, connect with industry leaders, and unlock endless possibilities.
Grab your spot today! https://t.co/lRAGVzFLRl
— Stellar (@StellarOrg) September 1, 2023
Technical Analysis Indicates Potential Challenges Ahead
Despite the recent surge, some technical indicators suggest potential challenges for Stellar. XLM has consistently closed daily sessions below the mid-range price of .1150, signaling increasing seller leverage. A weekly session closure below this level could confirm the sellers’ advancement, potentially pushing XLM toward the range low of approximately .1000.
However, this range low is not without its silver lining. It coincides with a daily bullish Order Book (OB) ranging from .0953 to .0986, creating a strong support zone for the cryptocurrency. Investors will be closely monitoring whether XLM can maintain its foothold in this zone or if further bearish pressure awaits.
In the past few days, funding rates in the crypto market have been predominantly negative, underscoring the prevailing bearish bias. This bearish sentiment is further supported by the declining Open Interest (OI) rates witnessed in August and early September.
The decrease in OI reflects reduced demand for XLM during this period, suggesting that investors remain cautious in the face of market uncertainties.
As the crypto community eagerly anticipates the forthcoming news from Stellar’s developers and the Meridian event, XLM’s price trajectory remains uncertain.
Traders and investors are advised to exercise caution and closely monitor the evolving market dynamics in the coming days, as these developments could play a pivotal role in determining Stellar’s future price movements.
(This site’s content should not be construed as investment advice. Investing involves risk. When you invest, your capital is subject to risk).
Featured image from MEXC Blog
Algorand Faces Tough Times, Records New All-Time Low As Crypto Market Plunges
Algorand’s (ALGO) performance on the charts has been nothing short of a rollercoaster. According to data from CoinGecko, yesterday, the asset’s value plummeted to a historical bottom, and it’s currently down by nearly 10% in the past 24 hours.
Algorand Records New Low
Just yesterday, amid the significant downturn in the crypto market, Algorand’s price fell below notable support. The asset dropped to a price of .0905 despite maintaining its stability and striving to hold its ground above the .11 mark over the past week.
This price move resulted in more than million being wiped away from the asset’s market capitalization in the past day. Algorand’s market cap stands at a valuation of 5 million, a 7.1% drop from its earlier record of 8 million on Thursday.
Despite the bloodbath the asset’s market cap and price currently suffer, its trading volume has moved in the opposite direction. ALGO’s trading volume has surged from a low of .5 million yesterday to as high as sitting above million at the time of writing.
This isn’t surprising as it indicates a potential violent sell-off. Furthermore, it is worth noting that before ALGO’s current bloodbath, the US Securities and Exchange Commission Chairman once recognized Algorand as a “great technology.”
At least on Algorand, I agree with Gary. Gensler is bullish on Algorand!
pic.twitter.com/BnKkU8d8gS
— Mr. Huber
(@Leerzeit) November 14, 2021

However, despite receiving positive reviews, even from the SEC, the asset eventually became entangled in legal disputes, leading to its inability to maintain stability and ultimately hitting a historic low.
Legal Complications Taking A Toll?
Besides ALGO’s price action, the last few months have been tumultuous for Algorand. Two lawsuits have cast long shadows over its progress. In its suit against the cryptocurrency exchange Bittrex in April, the SEC hinted that ALGO is a security under US laws.
This classification opened Pandora’s box of regulatory challenges for Algorand, impacting its perception among investors.
Further complicating matters for Algorand was another SEC lawsuit aimed at the behemoth crypto exchange, Binance, in June 2023. This litigation mentioned ALGO, exacerbating its woes and dragging it to its recent historically low prices.
When reviewing a potential cause for ALGO’s bearish moves in the past months, both of these high-profile legal disputes within a short time frame could be considered one of the reasons, as external factors such as regulatory challenges can significantly sway investor sentiment.
Featured image from iStock, Chart from TradingView
Nasdaq Halts Crypto Custody Plans Amid Tough US Regulatory Environment

Adena Friedman, CEO of Nasdaq, the international securities marketplace, announced that the firm is postponing its cryptocurrency custody plans due to the United States’ “regulatory environment.” During a Q2 earnings call, Friedman disclosed that Nasdaq aimed to launch the service last quarter, but it has been put on hold.
U.S. ‘Regulatory Environment’ Forces Nasdaq to Postpone Crypto Custody Launch
In late March, Nasdaq unveiled its plans to introduce a crypto asset custody service. The company applied for a limited-purpose trust company charter from the New York Department of Financial Services.
Initially, it was reported that Nasdaq would provide custody for bitcoin (BTC) and ethereum (ETH), with plans to expand to additional cryptocurrencies. However, during a Q2 earnings call, CEO Adena Friedman stated that the project had been paused.
“This quarter, considering the shifting business and regulatory environment in the United States, we have made the decision to halt our launch of the U.S. digital assets custodian business and our related efforts to pursue relevant license,” said the Nasdaq executive. Friedman elaborated:
We continue to build and deliver technology capabilities that position Nasdaq as a leading digital assets software solutions provider to the broader global industry. This includes advancing our custody solution as a technology platform to serve the broader, global digital assets marketplace.
Since the U.S. Securities and Exchange Commission (SEC) took action against multiple crypto companies for alleged securities law violations, regulatory pressure has intensified in the U.S. The U.S. regulator has categorized 66 digital assets worth over billion as securities.
This prompted several businesses such as Bakkt, Etoro, and Robinhood to delist some cryptocurrencies. However, after Ripple Labs and XRP secured a partial victory regarding programmatic sales, numerous exchanges opted to re-list XRP.
What impact do you think Nasdaq’s decision to halt its cryptocurrency custody service might have on the broader digital assets market, and how could it influence future regulatory decisions in the U.S.? Share your thoughts and opinions about this subject in the comments section below.
Shiba Inu Facing Tough Hurdles For Weeks – How Could SHIB Overcome These?
Shiba Inu (SHIB) momentarily moved out of its bearish streak that’s been going for the past few weeks on October 25 when the crypto market made a rally to reclaim the trillion market cap turf.
- SHIB went up by 10% since October 25 before its recent price correction
- Shiba Inu lost 2% of its value over the last 24 hours
- The crypto is still up by almost 8% for the past week
In doing so, the Dogecoin spin-off crypto managed to upend weeks of being in a downward trend that’s been very brutal to the 14th ranked cryptocurrency in terms of market capitalization.
SHIB, however, wasn’t able to sustain its upward trajectory as it once again made a step back for the past 24 hours.
At press time, according to tracking from Coingecko, Shiba Inu is trading at .00001070. It’s been down by 2% over the last day but is still up by 7.9% for the past week.
Shiba Inu Price Chart Hints At Another Price Correction
SHIB’s 12-hour chart shows price trend is swinging sideways and there is no definite consolidation on a bullish region.
 Source: TradingView
The altcoin did manage to increase by up to 10% since October 25 but has suffered price correction over the last few hours.
Its Relative Strength Index (RSI) was leaning towards a bullish movement during that time but the current price movement says otherwise.
If Shiba Inu fails to rebound from this minor price dump, the crypto might find itself on a downward movement once again.
It’s also a surprise that Dogecoin’s momentum is no longer helping SHIB right now considering DOGE witnessed a significant price surge just moments after Tesla CEO Elon Musk took over Twitter.
Three Main Hurdles For SHIB
Frustratingly, Shiba Inu repeatedly tried and eventually failed to build up enough momentum to push its price to higher levels.
Experts believe there are three problems that are standing in the way of SHIB to move even just an inch closer in realizing its developers’ dream to flip Dogecoin.
The first issue is that its circulating supply remains highly concentrated as more than 63%of all available SHIB tokens are being held by just 10 wallets which could be owned by fewer than 10 individuals or all by one person.
Shiba Inu still has limited case uses as of this time as its most significant use is being a method of exchange. Moreover, there are only 112 merchants that accept the altcoin as a mode of payment.
The asset’s network development roadmap is also not clear as there is no definite direction for where it is headed.
It’s probably one of the reasons why investors are veering away of the crypto, shifting their focus and resources to assets with well-planned path that ensures ROI and profit.
SHIB market cap at .41 billion on the daily chart | Featured image from CryptoGlobe, Chart: TradingView.com
Disclaimer: The analysis represents the author’s personal knowledge and should not be construed as investment advice.
Ethereum Bulls Rally Above $1,500, But ETH Could Face A Tough Time Here
- ETH’s price shows strength as it bounces from a downtrend range with high volume, aiming for a rally to ,700.
- ETH faces a major issue to trend and holds higher above ,500 after the price broke out of its downtrend descending triangle price movement.
- ETH’s price remains strong on the daily timeframe above the 50 Exponential Moving Average (EMA) as the price aims for more rallies.
The price of Ethereum (ETH) has continued to hold strong as price trends toward the region of ,700 as the price faces a key issue ahead of a big move, considering how tough breaking above ,450 has been for the price of Ethereum after moving in range for several weeks. The past few days have seen the crypto market has looked more decent, with the likes of Bitcoin (BTC) and Ethereum (ETH) showing some great price movement in recent times. With ETH price rallying from ,300 to a region of ,580 as price aims to outperform BTC in the coming days ahead of its monthly close. (Data from Binance)
Ethereum (ETH) Price Analysis On The Weekly Chart
In recent times, Ethereum has struggled to regain its bullish momentum; despite the uncertainty that has befallen the crypto space, the price of ETH hasn’t enjoyed a measure of relief following the post “Ethereum Merge.” Before the merger, the price of ETH soared from a weekly low of 0 to a high of ,030.
ETH’s price has struggled to replicate such a rally, with the price falling from that high to a low of ,260 in recent weeks.
After trading in a range for weeks as the price continued its monotonous move from ,260 to ,300, ETH finally showed some movement, rallying to a high of ,580 after closing strong above ,370 on the weekly chart.
The price of ETH faces a difficult decision to rally to a high of ,700, as this could trigger further upside movement to the ,000 range. With ETH’s structure and the crypto market overall looking positive, we could see more rallies for ETH’s price to break ,700.
Weekly resistance for the price of ETH – ,642-,700.
Weekly Support for the price of ETH – ,350.
Price Analysis Of ETH On The Daily (1D) Chart

In the daily timeframe, the price of ETH continues to trade below the key resistance at ,640. After breaking out from its descending triangle,
The price of ETH needs to break and hold above ,640 for the price to trend higher to a region of ,700 and possibly ,000, which is a key supply zone for most traders.
The Fibonacci retracement (Fib) value of 50% indicates ETH has earlier had a rejection which the price is trying to overcome. The price of ,620 corresponds to the Fib value of 50%. If the price of ETH closes above this level, we could see a rally to ,700, which is the exact value for 61.8% Fib value acting as a strong rejection zone.
Daily resistance for the ETH price – ,640-,700.
Daily Support for the ETH price – ,450.
Featured Image From zipmex, Charts From Tradingview
NewsBTC