 Ethereum (ETH) continues to showcase its volatility and potential for strategic trading. As of June 10, 2024, ethereum’s price stands at ,677, reflecting a daily range of ,654 to ,714. Ethereum Ethereum’s 1-hour chart reveals short-term volatility, with ether’s price testing lower levels around ,642 and struggling to maintain above ,700. Key support is identified […]
Bitcoin News
Dogecoin’s Rally Ride: DOGE Hang On Tight or Prepare to Bark!
Dogecoin corrected gains and tested the .1620 zone against the US Dollar. DOGE is now forming a base and might start a fresh increase above .1680.
- DOGE price declined and tested the key support at .1620.
- The price is trading below the .1650 level and the 100-hourly simple moving average.
- There is a key bearish trend line forming with resistance at .1685 on the hourly chart of the DOGE/USD pair (data source from Kraken).
- The price must settle above .170 to move into a positive zone and start a fresh surge.
Dogecoin Price Holds Support
After a steady increase, Dogecoin price faced resistance near the .1750 zone. The recent swing high was formed at .1705 before DOGE started a downside correction like Bitcoin and Ethereum. There was a drop below the .1650 support zone.
A low was formed at .1620 and DOGE is now consolidating for the next move. Dogecoin is now trading below the .1650 level and the 100-hourly simple moving average. On the upside, the price is facing resistance near the .1664 level. It is near the 50% Fib retracement level of the downward move from the .1705 swing high to the .1620 low.
The next major resistance is near the .1685 level or the 76.4% Fib retracement level of the downward move from the .1705 swing high to the .1620 low. There is also a key bearish trend line forming with resistance at .1685 on the hourly chart of the DOGE/USD pair.
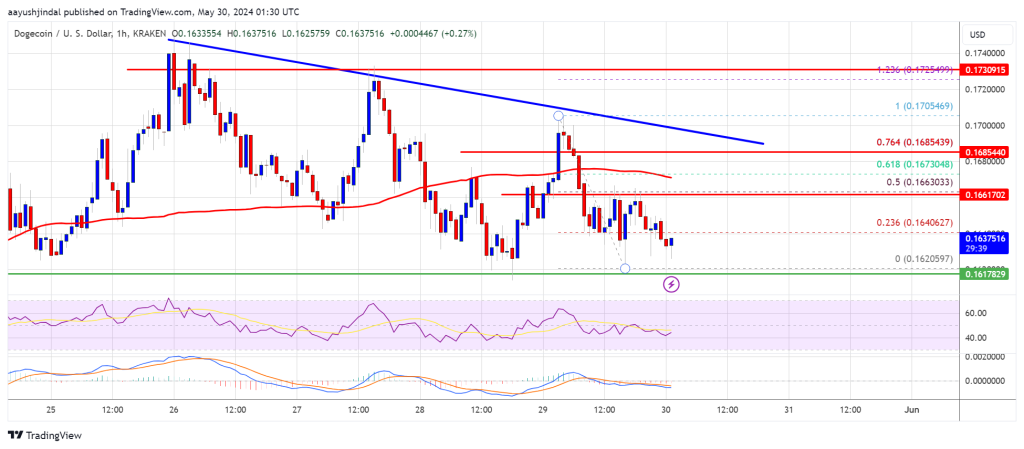
A close above the .1685 resistance might send the price toward the .1725 resistance. Any more gains might send the price toward the .1750 level. The next major stop for the bulls might be .1800.
More Losses In DOGE?
If DOGE’s price fails to gain pace above the .1685 level, it could start another decline. Initial support on the downside is near the .1620 level.
The next major support is near the .1550 level. If there is a downside break below the .1550 support, the price could decline further. In the stated case, the price might decline toward the .1520 level.
Technical Indicators
Hourly MACD – The MACD for DOGE/USD is now losing momentum in the bearish zone.
Hourly RSI (Relative Strength Index) – The RSI for DOGE/USD is now below the 50 level.
Major Support Levels – .1620, .1550 and .1520.
Major Resistance Levels – .1660, .1685, and .1720.
Bitcoin Technical Analysis: Traders Anticipate US Inflation Data Amidst Tight Trading Range

The crypto market is abuzz with the prospects of bitcoin exchange-traded funds (ETFs), sparking a rush of investments in anticipation of their approval. Investors and traders are bracing for the U.S. inflation report due to drop on Tuesday, which historically shakes up market sentiment and could tip the scales for future Federal Reserve rate hikes.
Bitcoin
Bitcoin (BTC) has consolidated a great deal over the weekend and is currently moving in a tighter triangular pattern. So far while remaining range bound, the relative strength index (RSI), a key gauge of price momentum, suggests bitcoin is still trading in overbought territory with a reading of 77, hinting at more price pullbacks.
Bitcoin’s price has been between ,692 and ,291 per coin during the past 24 hours. The leading crypto asset’s trade volume on Monday is around .63 billion, while BTC’s market cap is 0 billion. The price is still up 4.2% and 30-day statistics show a rise of 36% against the U.S. dollar.
Meanwhile, the Stochastic oscillator sits at a neutral 76, barely shy of the overbought distinction, which may imply a plateau in bitcoin’s upward thrust. A Stochastic value hovering near the threshold can often foreshadow a phase of market stabilization and range-bound action or slight corrections as part of the natural ebb and flow of trading patterns.
Adding to the bearish outlook, the commodity channel index (CCI) of 130 corroborates an inclination towards selling, echoing the sentiment suggested by the RSI. The CCI’s role in signaling new trends or extreme conditions becomes particularly significant when its readings climb past the typical overbought level of 100, casting a spotlight on the potential for a trend reversal.
In contrast, the allure of the bullish trend is still maintained by bitcoin’s moving averages, with the 10-day simple moving average (SMA) and exponential moving average (EMA) indicating optimistic market sentiment at respective values of ,133 and ,232. The longer-term 20 and 30-day averages also advocate for sustained upward momentum, standing well below current price levels, painting a picture of enduring bullish sentiments.
Bull Verdict:
The prevailing bullish signals from bitcoin’s moving averages may trump short-term overbought concerns, suggesting that the underlying momentum remains strong. If historical patterns hold true, the dip indicated by the RSI may be a natural breather, offering a buying opportunity before the next upward swing.
Bear Verdict:
Despite bullish trends in moving averages, the overbought signals from the RSI and CCI hint at a market that’s ripe for a correction.
Register your email here to get weekly price analysis updates sent to your inbox:
How will Tuesday’s CPI report impact crypto markets? Leave your thoughts in the comments below.
Dogecoin In Tight Zone: Why A Rally Will Happen If DOGE Clears $0.076
An analyst has explained how the next major Dogecoin resistance hurdle would be at .084 if the memecoin manages to clear .076.
Dogecoin Is Currently Sandwiched Between Major Support And Resistance Levels
In a new post on X, analyst Ali has discussed what the on-chain support and resistance levels are looking like for Dogecoin right now. A price level is said to be an on-chain support or resistance level on the basis of whether a large number of investors share their cost basis at it or not.
“Cost basis” here naturally refers to the average price at which a holder acquired their DOGE. When the spot price is below the cost basis of an investor, they are naturally in a state of loss, while it being above implies they are enjoying positive returns.
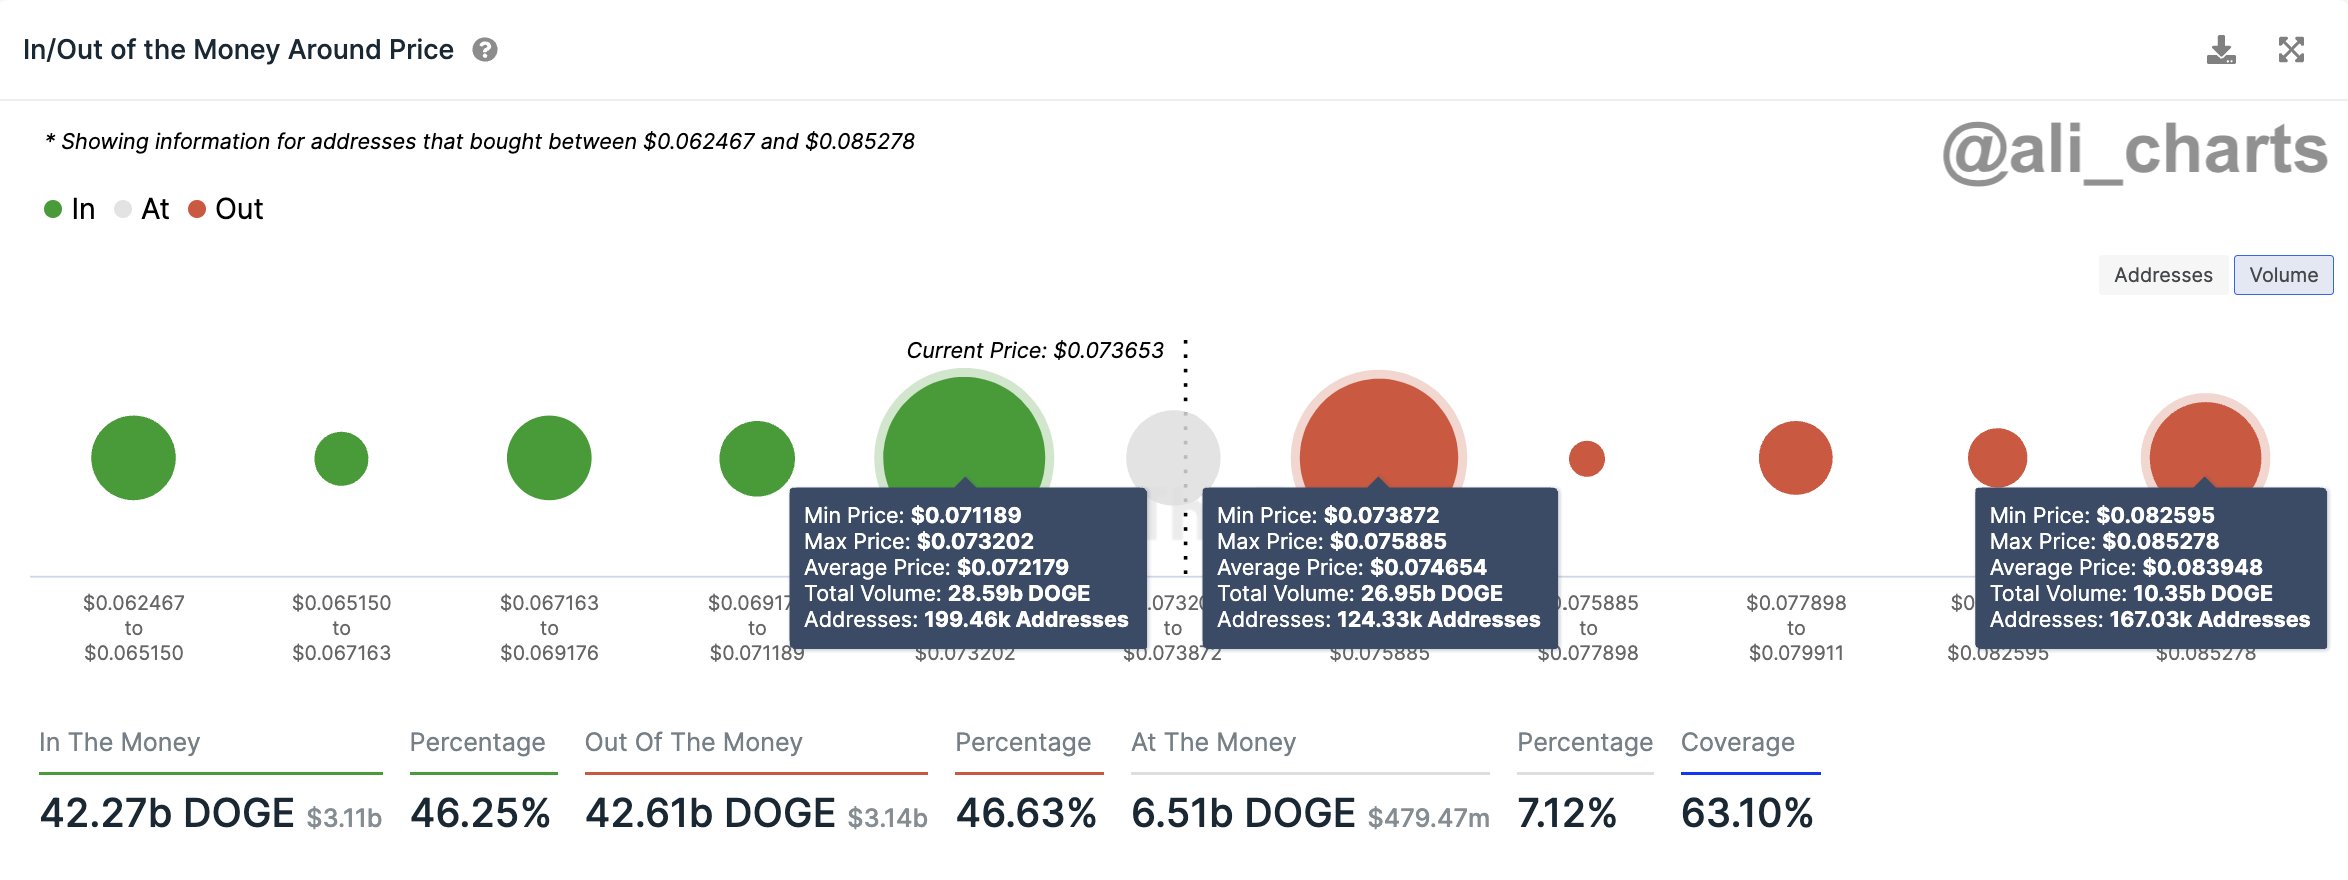
The below chart shows what the distribution of Dogecoin investors looks like currently on the basis of the price range that their cost basis lies.
For any investor, their cost basis is an important psychological level and they may be prone to making some moves whenever the spot price retests it. Thus, if a large number of holders share their cost basis close together inside a particular range, the market could potentially see a sizeable reaction when the asset’s price ventures into the range.
Generally, whenever this retest happens from above (that is, the investors had been in profits before this), the meme coin’s price could feel some degree of support.
The reason behind this is that the holders may tend to believe that if this same level had been profitable earlier, it might be so again in the future, so they participate in some accumulation.
The opposite is the case whenever the Dogecoin price retests the cost basis of a large amount of investors from below. These investors would be tempted to exit at their break-even so the cryptocurrency could face resistance.
From the above graph, it’s visible that the DOGE levels above and below the current price both host the acquisition points of a large number of addresses. In particular, the .071 to .073 range has the cost basis of almost 200,000 holders, while the .074 to .076 range has 124,000 addresses.
“Note that support outstrips resistance in strength, hinting at the potential for an upward breakout,” says Ali. If Dogecoin can manage to clear this range of significant resistance off the back of this strong support, the next price level where it will face a hurdle would be around .084.
The in-between levels all have a relatively low amount of investors, so at least in theory, the memecoin shouldn’t have too hard a time mowing through them. Especially considering that, once the .076 level is through, the block that’s providing resistance right now would turn into a support boundary.
DOGE Price
Dogecoin is currently battling against the resistance offered by the aforementioned range as its price is floating around .075.
Bitcoin Difficulty Soars to Record 62.46 Trillion, Miners Unfazed Amidst Tight Competition Between Foundry and Antpool
On October 29, 2023, Bitcoin’s difficulty rose 2.35%, reaching a record 62.46 trillion. This uptick represented the fourth consecutive rise over the preceding six weeks. The next difficulty epoch is slated for November 12, 2023, and as it stands, the recent spate of increases seems to have left miners undeterred, with the total hashrate demonstrating both resilience and stability.
Bitcoin Difficulty Marks 2.35% Uptick in Fourth Consecutive Rise
After a 6.47% increase on October 16, Bitcoin’s difficulty has risen again. On October 29, 2023, at block height 814,464, the network saw a 2.35% boost in difficulty, moving from 61.03 trillion to a new high of 62.46 trillion.
This development has made mining bitcoin block rewards more challenging than at any previous point in history. Despite this increased complexity, bitcoin miners remain unfazed, sustaining a total hashrate of just above 450 exahash per second (EH/s).

Currently, block times remain below the ten-minute average, with data indicating speeds ranging from nine minutes and 17 seconds to slightly above the nine-minute mark per block. A total of 42 mining pools are contributing a minimum of 3 gigahash per second (GH/s) to the Bitcoin blockchain.
Furthermore, nearly 17 pools boast upwards of 1 EH/s of hashpower dedicated to mining bitcoin. On October 30, 2023, around 26 mining pools are operating with approximately 1 petahash per second (PH/s) of hashpower.
A mere 48 hours ago, Antpool held the reins as the predominant mining pool. However, recent statistics reveal that Foundry has taken the lead, boasting 27.02% of the total hashrate, while Antpool follows closely with 26.58%.
Together, these two pools govern a staggering 53.6% of the network’s entire hashrate. Over the past week, Foundry and Antpool have been locked in a close race in terms of hashrate, with Foundry slightly ahead on October 30, with 120 EH/s compared to Antpool’s 118 EH/s.
What do you think about the recent difficulty rise? Share your thoughts and opinions about this subject in the comments section below.
Binance CEO Changpeng Zhao Reveals His Secret for Building ‘Tight Teams’: External Pressure
Changpeng Zhao, CEO of Binance, the largest cryptocurrency exchange in volume traded, has revealed his secret for building a comprehensive team of employees for any startup. According to Zhao, external pressure has contributed to the unity of the team behind the exchange, and it also makes the Binance team more driven to its objective of increasing the “freedom of money for people all around the world.”
Binance CEO Changpeng Zhao States Pressure Contributes to Building ‘Tight Teams’
Changpeng Zhao, CEO of Binance, took to social media to explain what he believes is a “little secret” for building “tight teams” in companies. Amidst recent reports indicating that several high-level executives had left the company after a response to an ongoing investigation by the U.S. Department of Justice, Zhao detailed the elements needed to build and maintain a comprehensive team in a startup.
Zhao stated:
It’s not fancy team building dinners, outings, etc. It’s not the coaching exercises, mentors or magical shrinks. It’s not the rah rah speeches of inspirational leaders. All of the above helps but fades over time, but the secret is just … some external pressure.
Zhao explained that this pressure should not be life-threatening and that “fighting in the trenches together is the best way to build tight teams.”
Tough Times Ahead
Zhao’s statements come at a time when Binance is facing pressure from regulatory agencies from all over the world and especially in the U.S., where it is currency battling the Commodity Futures Trading Commission (CFTC) and the Securities and Exchange Commission (SEC) in a pair of lawsuits, both including Zhao’s name. Some international regulators have asked the exchange to withdraw operations from their jurisdictions, reducing the exchange’s area of operation.
However, Zhao attributes the Binance team’s strength to these events, as he believes these situations make the exchange more resilient. He detailed:
I believe this is the one of the big reasons Binance has such a tight team. We have always had external pressure, FUD, etc. As a result, we are constantly in the trenches together.
Before, Zhao had reacted to the rumors of a so-called “crisis” created by several high-level executives leaving Binance by qualifying these reports as FUD (fear, uncertainty, doubt), stating the reasons presented by the news organizations behind these reports were “completely wrong.”
What do you think about the recent statements of Changpeng Zhao regarding the internal situation at Binance? Tell us in the comments section below.
Hong Kong to Have Tight Crypto Regulations, Head of Monetary Authority Says
Companies attracted by the plan to turn Hong Kong into a hub for digital assets should expect strict regulations, the region has indicated. Authorities are preparing new licensing rules for service providers working with cryptocurrencies and guidelines for banks interacting with crypto firms.
Crypto Hub Hong Kong Has No Intentions to Adopt ‘Light-Touch’ Regulations
Hong Kong’s central banking institution has made it clear that crypto companies enticed by the city’s attempt to establish itself as a hotspot for digital-asset business will not operate under very lax regulations. In an interview on Tuesday, the Chief Executive of the Hong Kong Monetary Authority (HKMA) Eddie Yue elaborated:
Our regulation will be tight. We will let them create the ecosystem here and that actually brings a lot of excitement. But that doesn’t mean light-touch regulation.
On June 1, Hong Kong will launch a new licensing regime for virtual-asset service providers, Bloomberg noted in a report quoting Yue’s statements. The plan is also to allow retail investors to acquire and trade major cryptocurrencies like bitcoin and ether.
The crypto-friendly move is part of efforts by authorities in China’s special administrative region to restore Hong Kong’s credentials as a leading financial center in the aftermath of restrictions imposed in response to the Covid pandemic and political unrest in the territory.
While there has been no change in China’s official policy regarding crypto-related activities, which remain heavily restricted in the mainland, there have been indications that Hong Kong’s push to become a major hub for digital assets has the backing of Beijing.
A report in late March revealed that state-owned Chinese banks are ready to serve crypto companies in the city. Further guidance for providing banking services to clients in the sector are under development, Yue said during the Bloomberg Wealth Asia Summit.
Regulations for the industry have been tightening around the world following last year’s market crash and the collapse of major players such as FTX, a leading cryptocurrency exchange. While the U.S., for example, has been cracking down on businesses with enforcement actions and lawsuits, Hong Kong seems to be moving in the opposite direction.
The city’s crypto guardrails were very tight in the last few years, Yue commented. They have now been lowered to a “reasonable and sustainable level” but they won’t allow the recurrence of any FTX-type event in the city, he emphasized. Hong Kong’s legislative framework introducing the new crypto rules will bring transparency and clarity, Yue insisted in the interview.
Do you think Hong Kong’s new regulations will be favorable enough to attract a significant number of crypto companies to the region? Share your thoughts on the subject in the comments section below.
Ethereum In Tight Range – Will Selling Pressure Push ETH Below $1,250?
Ethereum, the undisputed ruler of the altcoin market, is now stuck in a bear market as the token struggles to break the ,300 resistance level. However, the current market price is ,302.87, only 0.22 percent more than the key psychological buy point.
Despite how good this sounds, the way the market is moving right now, the bear market is likely to continue this month, which is not good news for ETH.
The possibilities of a bear market recovery for ETH are slim due to the terrible state of the macroeconomy, according to The Guardian.
In this year’s much-hyped “Uptober,” the token is probably going to experience even more misery than usual. However, what do the graphs show?
Trading In A Tight Band
At the time of writing, the altcoin was expected to trade in a narrow band. Before that, however, the price of ETH has fluctuated over the past 25 days between ,188 and ,411. Since this coincides with when the Federal Reserve hiked interest rates, it demonstrates especially tumultuous market conditions at the time.
As previously indicated, Ether is presently following a pennant formation. This pattern is a bearish sign that matches the preceding price action. The price has decreased to ,300.35, where we anticipate a significant price movement on or near the price level.
Chart: TradingView
With the current sideways market action, technical analysis is also quite neutral. The momentum indicator demonstrates a sharp decline following the market meltdown on September 13, which was followed by a rebound and leveling from September 21 to the present.
Chaikin’s money flow index, which currently stands at 0.05, is positive, indicating that bulls rule the market. Stochastic RSI values also confirm this strengthening bullish momentum.
As the RSI is close to oversold zone, it strengthens the bullish momentum seen in other technical indicators, giving investors a good buying opportunity.
Ethereum: Price Reversal Likely?
Despite the price narrowing to a point, ETH may be repeating the previous July-August rally in which it created three bottoms before rising. As of this writing, the altcoin has already established these three bottoms and may be on the ascent.
Despite this, bulls should continue to be cautious due to the difficult market conditions. If today’s market closes in the green above ,300, we may witness a rally that tests or breaches the ,345 level of resistance.
ETHUSD pair trading at 20 on the weekend chart | Featured image from TradeMap, Chart: TradingView.com
Disclaimer: The analysis represents the author’s personal views and should not be construed as investment advice.
NewsBTC
High Leverage and Tight Spreads Make CryptoAltum a Worthy Contender in Crowded Crypto CFD Space
The new Marshall Island-based crypto derivatives trading platform is making a wave in the trading community by offering attractive trading opportunities. Less than a year old, the CryptoAltum platform is a feature-rich CFD trading platform with a range of trading instruments including Cryptocurrencies, Forex, Equity Indices and Gold.
CryptoAltum is an easy to use platform that is designed keeping the users’ convenience in mind. It is designed to accommodate both novice and experienced traders, with different trading tiers in place based on their trading activity on the platform. It should not take more than a few minutes to register and start trading on CryptoAltum. All one has to provide is their name, email address, and country of residence to open an account.
Trading on CryptoAltum
With the account open, users can fund their account with BTC, BCH, XRP, ETH, LTC or USDT and start trading any of the available instruments, 24/7. All trades are executed using a Straight Through Processing (STP) model at the best available market price. The CryptoAltum platform provides users with the highest leverage of 500X at low spreads, which makes it an attractive option for those who intend to make huge profits. Its leverage offering is the highest in crypto markets, which when combined with an average spread of as less as (for the highly volatile BTC), makes it quite tight when it comes to cryptocurrencies. Meanwhile, the platform has some of the top global exchanges as liquidity providers, which allows CryptoAltum traders to enjoy the best prices.
Along with high leverage and tight spreads, CryptoAltum offers the best-in-class trading experience with the industry-leading trading solution. The crypto CFD trading platform is available on almost all devices, thanks to its integration with MetaTrader 5. Users can either use the WebTrader or download MetaTrader 5 (MT5) application on their computers or mobile phones to start trading. The highly customizable MT5 suite offers a range of charts and trading tools to the traders, helping them in the decision-making process for profitable trades.
Users on CryptoAltum can create multiple accounts, one each for all the base currencies except BTC and XRP, for which 2 accounts are allowed. There is also a free demo account feature available, where users can practice trading without risking their deposit.
Combine the features and trading infrastructure with zero commissions, a huge 100% first deposit and a 50% second deposit bonus, CryptoAltum emerges as the perfect recipe for profitable crypto CFD trading.
Security and Support
CryptoAltum assures the safety of funds and private information stored on the platform by implementing strict cybersecurity measures. The amount of private information collected and stored by the platform is minimal as it does not insist on any identifying information apart from a valid email address. Similarly, majority of crypto funds handled by the platform are secured in multi-signature cold storage facilities in four different locations. It also implements advanced protection against viruses, malware, and keylogging software to preserve the platform’s integrity. At any point, if there is any doubt about the ability of the platform, or have issues with accounts or trades, the CryptoAltum customer support team is always within reach. They can be reached 24/7 over email, live chat, WhatsApp, Telegram or Facebook Messenger at any time.
Overall, CryptoAltum has proven itself to be a platform that can deliver the best crypto trading experience within months of entering the market.
Learn more about CryptoAltum – https://cryptoaltum.com/
Join CryptoAltum at – https://portal.cryptoaltum.com/register
Crypto Analyst: Bitcoin Price Could Be Trapped in Tight Range Until Halving
Bitcoin price action has turned bullish in anticipation of its upcoming halving since the start of 2019, and the leading crypto asset by market cap has only recently started to take a pause to consolidate on weekly price charts.
Weekly resistance at ,500 continues to play an important price level to beat, while bears have been unable to push below the mid-,000 range. One crypto analysts believe that the two price levels will act as a tight trading range on weekly price charts for the rest of the year and may not be broken until Bitcoin’s halving in May 2020.
Bitcoin Price Could Be Locked In ,000 Range For Rest of 2019
In recent weeks, Bitcoin price was rejected at ,800 after a three-month-long parabolic rally, and since then it has been ranging and consolidating. The market has, again and again, tried to choose a direction but indecision has kept Bitcoin price ranging between recent local highs and lows.
Related Reading | Bitcoin Price Weekly Close Above ,500 Would Be First in Nearly 18 Months
It’s something that crypto investors and traders may want to get used to, as it could last the rest of the year, and extend into 2020 until Bitcoin’s halving in May of next year.
According to a weekly Bitcoin price chart shared by a prominent crypto analyst, the first-ever cryptocurrency could be trapped in a tight trading range between weekly resistance at ,500 and weekly support at ,500. The chart suggests that BTC could be locked in the range until Bitcoin’s halving. Others believe that Bitcoin price could be as much as ,000 by that time.
BTC Weekly:
Range bound until the halving? pic.twitter.com/1HooowmAtP
— Nunya Bizniz (@Pladizow) August 10, 2019
The theory would fall in line with Bitcoin entering a reaccumulation phase and natural profit-taking, following post-accumulation markup selling, but before the real bull run begins.
Alternative BTC Range With Wider Weekly Resistance and Support
BTC and other crypto-assets are highly volatile and often see massive, few-hundred and even few-thousand dollar price movements. By raising weekly resistance to the next logical level, and doing the same for support, a more realistic and less restrictive trading range is demonstrated.

Both charts would still have Bitcoin price trading in a range for the remainder of the year through halving, but would also allow for a deeper correction and touch of a trend line extending back to Bitcoin’s bottom trading range below ,000.
At those lows, Bitcoin price was trading in a ,000 trading range, but at that point represented over 25% of its price. At current prices, 25% of its price would be roughly ,750 adding further credence to the tight trading range in the first chart as the market continues to show indecision.
Related Reading | CNBC Host Pushes Bitcoin, Cites Halving and Scarcity As Catalyst for K BTC
If either of the major weekly supports or resistances are broken with a weekly candle close, the wider range could be in play. Or, none of this happens and Bitcoin price reaches ,000 according to other widely adopted models in circulation.
The post Crypto Analyst: Bitcoin Price Could Be Trapped in Tight Range Until Halving appeared first on NewsBTC.