 Argentina is reaping its first rewards in the fight against inflation, as a private consulting firm found that the inflation in food and beverages reached 0% during June’s third week. President Javier Milei celebrated this achievement, stating that his administration was rewriting economic theory and that he might receive the Nobel prize if successful. Javier […]
Bitcoin News
Elliot Wave Theory Predicts Bitcoin Bottom And Top, Here Are The Targets
Bitcoin looks to be stuck in a consolidation zone between ,000 and ,000, with neither the bulls nor the bears succeeding in completely taking control of the trend. This performance has sparked a number of speculations on whether the BTC price has finally found a local top. One of those who have speculated on the price direction is crypto analyst Alan Santana, who has used the Elliot Wave Theory to predict where the price of the cryptocurrency might be headed next.
Elliot Wave Points To Correction To ,800
In the analysis shared by Alan Santana on TradingView, the Elliot Wave theory could point out the direction that the Bitcoin price could be headed next. The theory, which consists of five waves, has so far completed three waves, with the fourth wave expected to happen soon.
Given that the third wave is very bullish and the price has risen so fast, the fourth wave is expected to be more bearish. As Santana explains, this fourth wave points toward an upcoming correction. They also reveal that their analysis included Elliot’s Law of Alternation, and applying it to this scenario, the fourth wave is bearish, but would not go as low as the second wave.
Once this fourth wave moves into action, the Bitcoin price is expected to see a sharp correction. At the low end of this correction, though, is the ,800 level, the analyst believes. So, in this scenario, there will be a return to the ,000s before Bitcoin resumes its next leg up.
“This wave four of a higher degree cannot enter the territory of wave two, which puts the lowest price possible for the upcoming correction at ,805 based on Elliot Wave Theory,” Santana said. He further added that: “Just as wave three would lead to a correction (wave four), wave four invariable leads to another impulse; the final and fifth wave of the higher degree.”
Bitcoin Top At 8,000
Not only does the Elliot Wave theory points toward a possible bottom, it also gives an idea for where the Bitcoin top might lie in the fifth wave. The crypto analyst uses one of the two Wave Principle methods to forecast this price, which takes into account the peak of the third wave and then uses that to give the peak of the fifth wave.
So far, the local top of this third wave looks to be ,985, where Bitcoin peaked earlier this week. Since the Wave Principle says that the peak of Wave 5 would be three times higher than that of Wave 3, the analyst multiples ,985 by 3, which gives a cycle top of 8,714.
As for when this peak will roll around, Santana explains that the whole thing could play out by 2025, which is when the peak would take place. “So the potential for the final impulse or fifth wave based on the Elliot Wave Theory system, amounts to 8,714. This can happen sometime in 2025,” the analyst stated.
XRP Price Poised To Hit $20,000: Chad Steingraber Theory Outlines How
Chad Steingraber, a professional game designer and a prominent figure in the XRP community, recently updated his theory, originally posted in August 2022, about the potential future price of XRP. Dubbed “The Chad Steingraber Theory,” it presents an intricate roadmap predicting XRP’s journey towards a staggering ,000 mark.
Central to Steingraber’s argument is the principle of asset scarcity in relation to supply and demand. He explains how scarcity, much like in an auction where numerous bidders vie for a limited asset, can escalate the asset’s value.
“Asset Scarcity, part of supply and demand, is also an issue, like an auction bid where many people are bidding on a limited set of assets that only some of them may own. This can drive up value, it ONLY stops when no one else is willing to pay a higher price,” he notes, underlining how this scarcity could be a driving force for XRP’s valuation.
Steingraber also delves into the realm of market appreciation and ‘phantom money’. He elucidates how the current price of an asset can reflect its anticipated future value, a concept akin to selling the idea of a future desirable house on a valuable plot of land at today’s perceived value. He further introduces the notion of ‘Phantom Money’, indicating that market caps often mirror perceived, rather than actual, invested value.
“Today XRP market cap is billion.. but wait, that doesn’t mean there is actually B of money that has been put into XRP. […] There’s far less as the market cap is just a reflection of the current value anyone is willing to pay. Phantom Money, remember?, Steingraber explained.
Drawing parallels with unique and limited assets like the Mona Lisa, Steingraber highlights the perception of value. He points out that value is often ascribed based on uniqueness and societal significance, stating, “The Mona Lisa is valuable because it’s the only one… That value is in our minds.” This analogy serves to emphasize the perceived value of the coin in the cryptocurrency market.
“The Chad Steingraber Theory” – The Road to a K #XRPA Thread
from The Future (UPDATED)
It’s been a year and a half since I wrote this original thread and A LOT has happened, including some parts of this theory.
Grab a drink, grab a snack and let’s take a ride, shall we? https://t.co/TU7CLwwh1T
— Chad Steingraber (@ChadSteingraber) December 30, 2023
Banks Will Drive The XRP Price To ,000
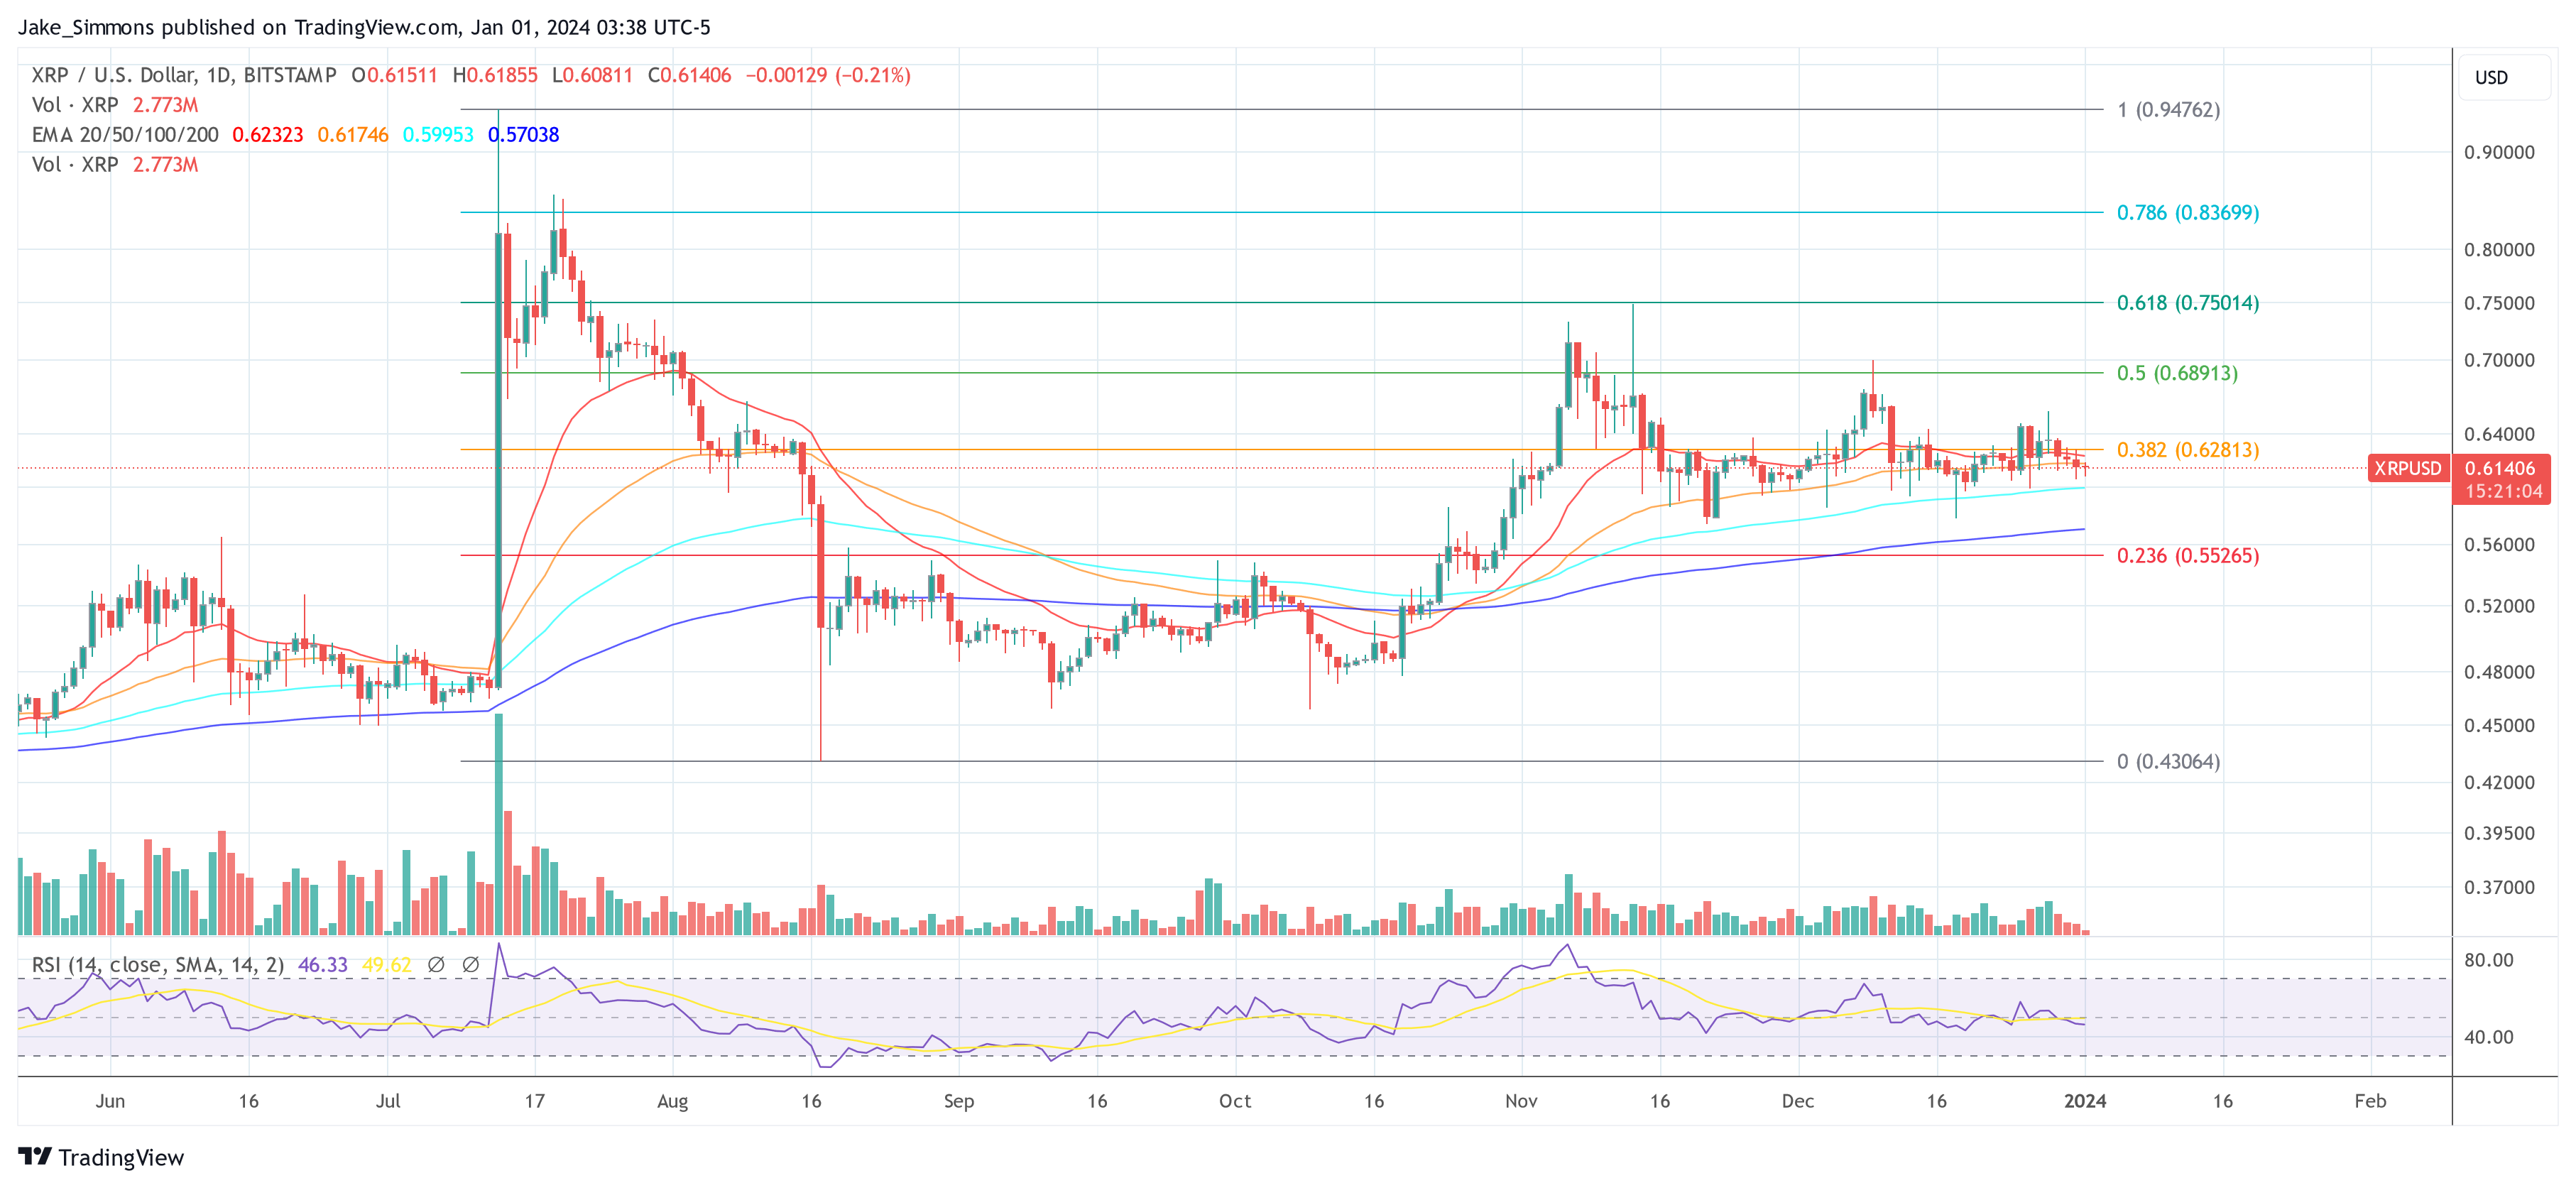
Central to Steingraber’s theory is the idea of banks holding XRP as a reserve asset, akin to gold. He explicitly states, “Banks holding XRP, that’s the Holy Grail,” emphasizing the potential shift in how financial institutions perceive XRP. This change would elevate the cryptocurrency’s status, positioning it not just as a transactional cryptocurrency but as a foundational asset in banking operations.
Steingraber envisions a future where banks will create private ledgers for internal operations, necessitating substantial XRP reserves. “Banks will create a Private Ledger and HOLD XRP as a reserve asset like how a central bank will hold Gold as a backing asset,” he explains. This approach to using XRP mirrors the traditional banking system’s reliance on gold, suggesting a paradigm shift in digital asset management.
The theory also highlights the crucial role of liquidity hubs, like Metaco, in this new banking ecosystem. Steingraber points out that these hubs would need to maintain large XRP balances to facilitate transactions between banks. “The LHs also hold a balance of XRP because they ARE the 3rd Party exchange that requires a transfer on the XRPL of the issued IOU Derivative into another IOU Derivative,” he notes, underlining the importance of XRP in this process.
A pivotal aspect of Steingraber’s theory is the ensuing scarcity of XRP in the public market as banks accumulate it. He predicts a significant shift in the public supply, stating, “The circulating public supply of XRP on crypto exchanges is far less than people realize… The banks, when ready, are coming for the public XRP supply and once they have it… IT’S GONE.” This anticipated scarcity is expected to trigger a FOMO among financial institutions, leading to a rapid depletion of XRP’s public availability.
Steingraber’s theory culminates in the projection of a massive increase in XRP’s price, driven by the combined effects of banks treating it as a reserve asset, the creation of private ledgers, the crucial role of liquidity hubs, and the resulting public supply scarcity. He posits a future where the value of the cryptocurrency could skyrocket due to these factors, potentially reaching up to ,000.
At press time, XRP traded at .61406.
Elliott Wave Theory Forecasts XRP Price Of $27 By 2026: Crypto Analyst
Renowned crypto analyst Egrag presented a compelling Elliott Wave analysis on the potential XRP price trajectory in a tweet today. Drawing attention to the inner workings of the Elliott Wave theory, he highlighted that XRP has entered Wave 3 in recent days, which in particular plays a transformative role in determining the course of asset prices.
In Egrag’s words: “XRP aiming to – Wave 1 inside Wave 3: Diving into the Elliott Wave theory as we explore the potential for XRP to reach ! Wave 3 is typically a game-changer in the Elliott Wave theory.”
Elliott Wave Analysis: Wave 3
The crypto analyst further elaborated that Wave 3 emerges as the trend’s dominant force, outshining other waves in size and influence. This stage often witnesses positive news that prompts fundamental analysts to revise their outlook, giving a boost to upward momentum.
Notably, prices tend to shoot up rapidly during this phase, with minimal corrections. Investors who try to enter the market on a pullback often find themselves missing out as the third wave gains traction. At the outset, pessimistic news might still dominate, with most market participants maintaining a bearish stance. However, as Wave 3 unfolds, a significant shift towards bullish sentiment becomes evident among the majority.
Deep-diving into the XRP analysis, Egrag points out that the green wave count reflects the Grand Cycle spanning from 2014 to 2018. This cycle commenced with Wave 1 and was succeeded by a corrective Wave 2. “Presently, XRP finds itself amidst the thrilling currents of Wave 1 within the Grand Cycle’s Wave 3. Prepare for a fascinating journey ahead!” he noted.
He further elucidated that XRP has adeptly navigated through the initial waves and is now setting its course for the anticipated Wave 3, which he predicts will touch the Fibonacci 1.618 mark at .5, followed by a brief correction. The subsequent and concluding phase, Wave 5, according to Egrag’s analysis, will propel the XRP price to a staggering .
A Deep-Dive Into Egrag’s XRP Price Chart
Egrag’s analysis delineates the intricate voyage of the XRP price through the conceptual lenses of the Elliott Wave theory. The chart starts its narrative in March 2020, when the subordinate Wave 1 began. This initial phase witnessed XRP escalating to a prominent peak of .96, buoyed by a favorable outcome in Ripple’s legal battle with the US Securities and Exchange Commission (SEC).
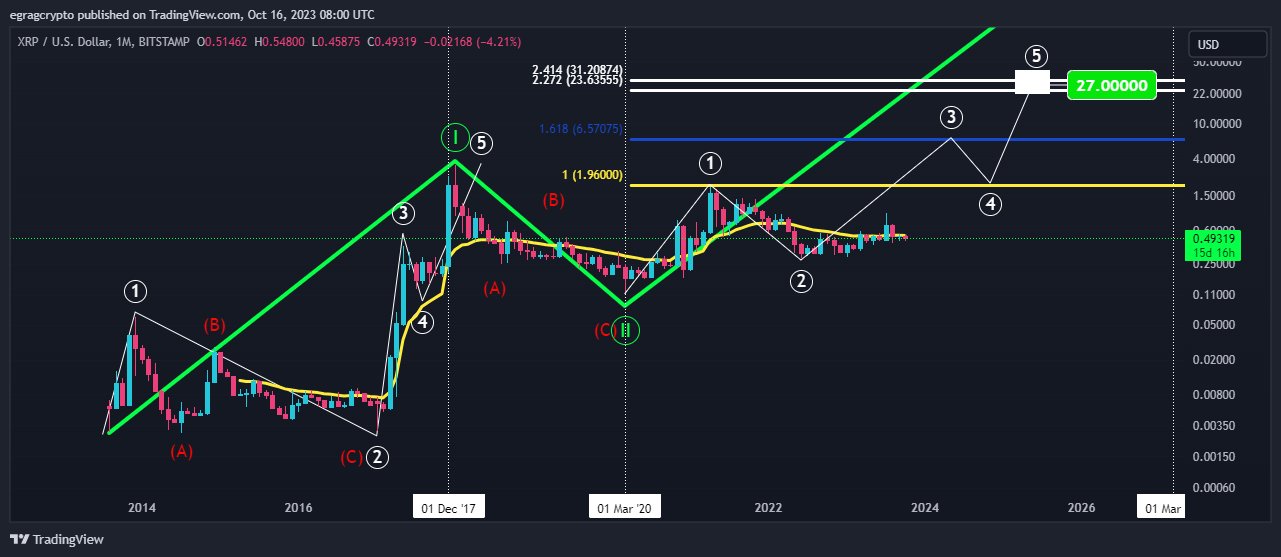
Subsequent to the apex of Wave 1, the chart navigates through a territory marked by correction, which is dubbed Wave 2. In this segment, the XRP price experienced a pullback and dropped to a low of .4313. This corrective phase, although incisive, respects the sanctity of Elliott wave norms by not falling below the initial point of Wave 1.
With the transition into the Wave 3 area, bullish momentum is currently starting to build up. Egrag, with a combination of analysis and foresight, expects the XRP price to rise beyond the zenith of Wave 1 and target the Fibonacci extension of 1.618, valued at around .57. This upside, plotted on Egrag’s chart, is expected to end sometime in 2024 or 2025.
Wave 4, as described by Egrag, provides for a corrective move following the upswing of Wave 3. At this point, the XRP price is expected to drop heavily and find support at .96, which interestingly mirrors the peak of Wave 1.
In Egrag’s chart, Wave 5 emerges as the pinnacle of the bull market. In this decisive phase, the analyst projects his most audacious forecast for the XRP price trajectory. Anticipating a monumental bull surge in 2025, he envisions XRP oscillating between Fibonacci extension levels of 2.272 and 2.414, corresponding to price points of .63 and .20. Egrag, averaging the values, subsequently forecasts a price target of for XRP.
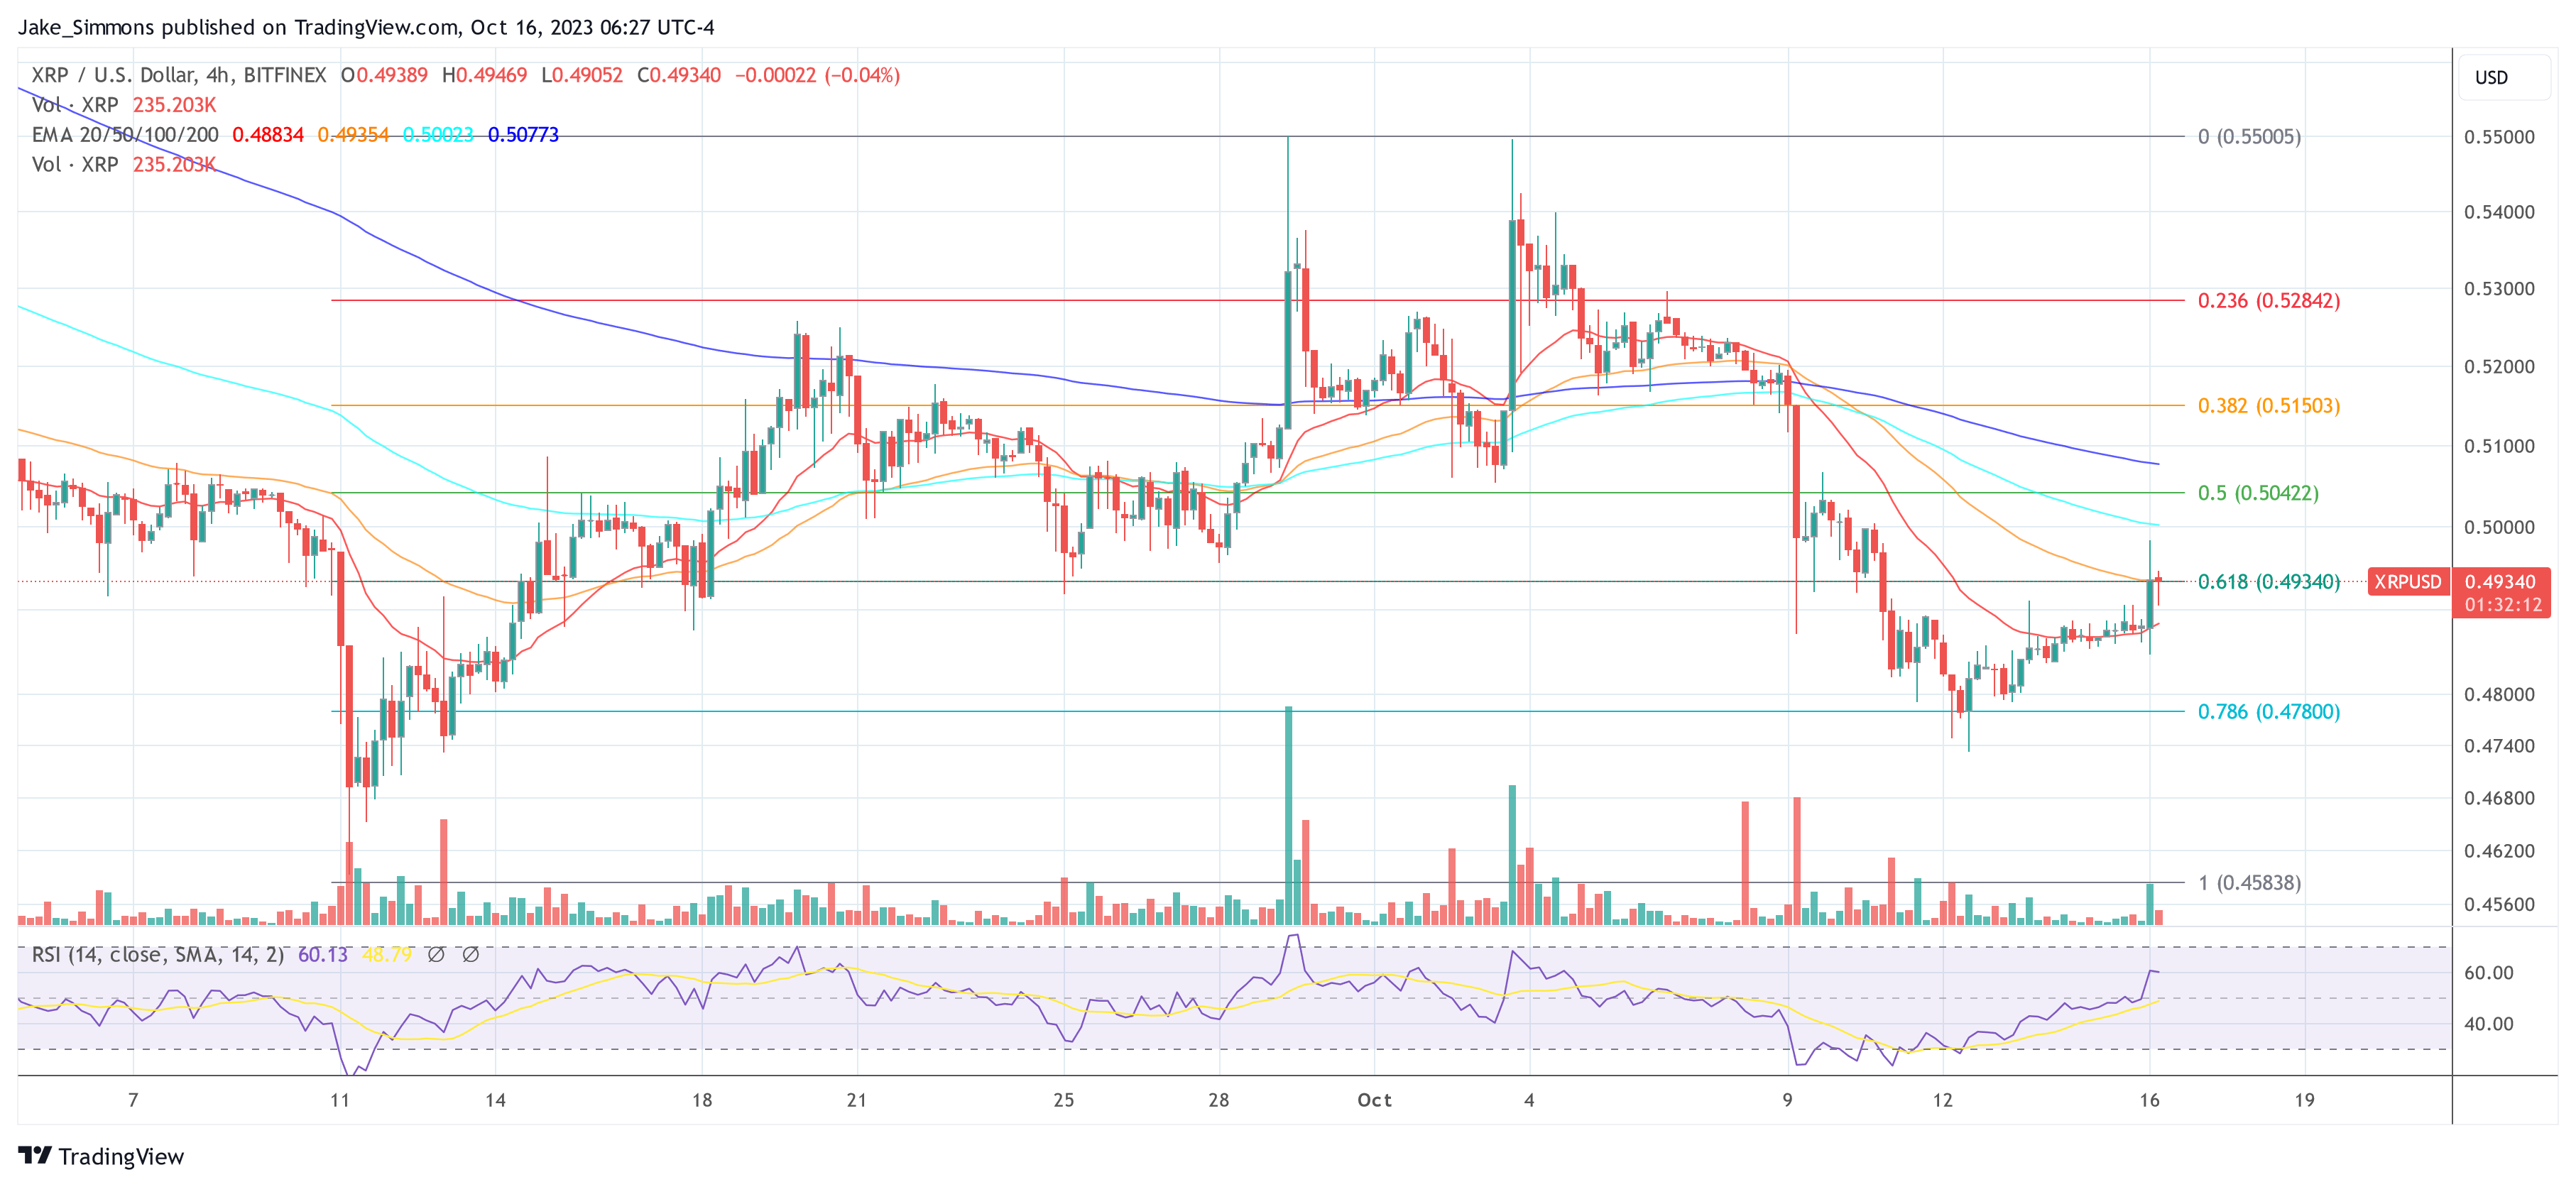
At press time, XRP traded at .4934.
XRP Price Set Theory Debunked By Community, Here’s What It’s About
In a recent series of exchanges on X, prominent XRP community influencer, Crypto Eri, addressed the controversial theory that the XRP price can be artificially set by a central authority. The debate has ignited discussions among enthusiasts, experts, and Ripple insiders.
Eri’s initial tweet emphasized the decentralized nature of cryptocurrencies, stating, “Decentralized crypto-assets like XRP, cannot be ‘price set’. Price is determined by supply & demand dynamics in the global open market, sometimes with Influence factors like trading, sentiment, adoption, news & liquidity.” She further warned against the “deceptive false price hype” that has been circulating within the community.
Can XRP Price Be Set?
In a hypothetical scenario presented by a user, the idea of “setting the price” was explored, suggesting that if a powerful entity like OPEC decided to trade a barrel of oil for 1 XRP, it would effectively set the price. Eri responded, “Granted, artificial price setting has been tried, but If the price is above the equilibrium level, then the quantity supplied has always exceeded the quantity demanded… In the Crypto Market, you can’t ignore arbitrage.”
Khaled Elawadi.XRP, another community member, argued that the tokens price could be set in different ways, either directly by Ripple or by determining a face value through various parties. Eri swiftly countered, clarifying the distinction between XRP, the XRP Ledger, and RippleNet, a software solution created by Ripple.
She emphasized, “Fact 1: The digital asset XRP is not a unique software product… Fact 2: Ripple does not control XRP or the Ledger… Fact 3: Ripplenet is the name of a software created by the Company Ripple, that can use XRP (or any asset) in a solution.”
Jesse Hynes, a renowned community lawyer, humorously questioned the persistence of the price set theory, “Are people still saying that there’s going to be a price set?”, to which Eri simply replied, “Yes.”
Neil Hartner, a Senior staff software engineer at Ripple for On-Demand Liquidity (ODL), weighed in on the debate as well, questioning the logic behind two parties artificially setting a price, stating, “Why would 2 parties do that unless they want to lose a lot of money? Unless those 2 parties are willing to defend the price and not run out of money, it won’t last.”
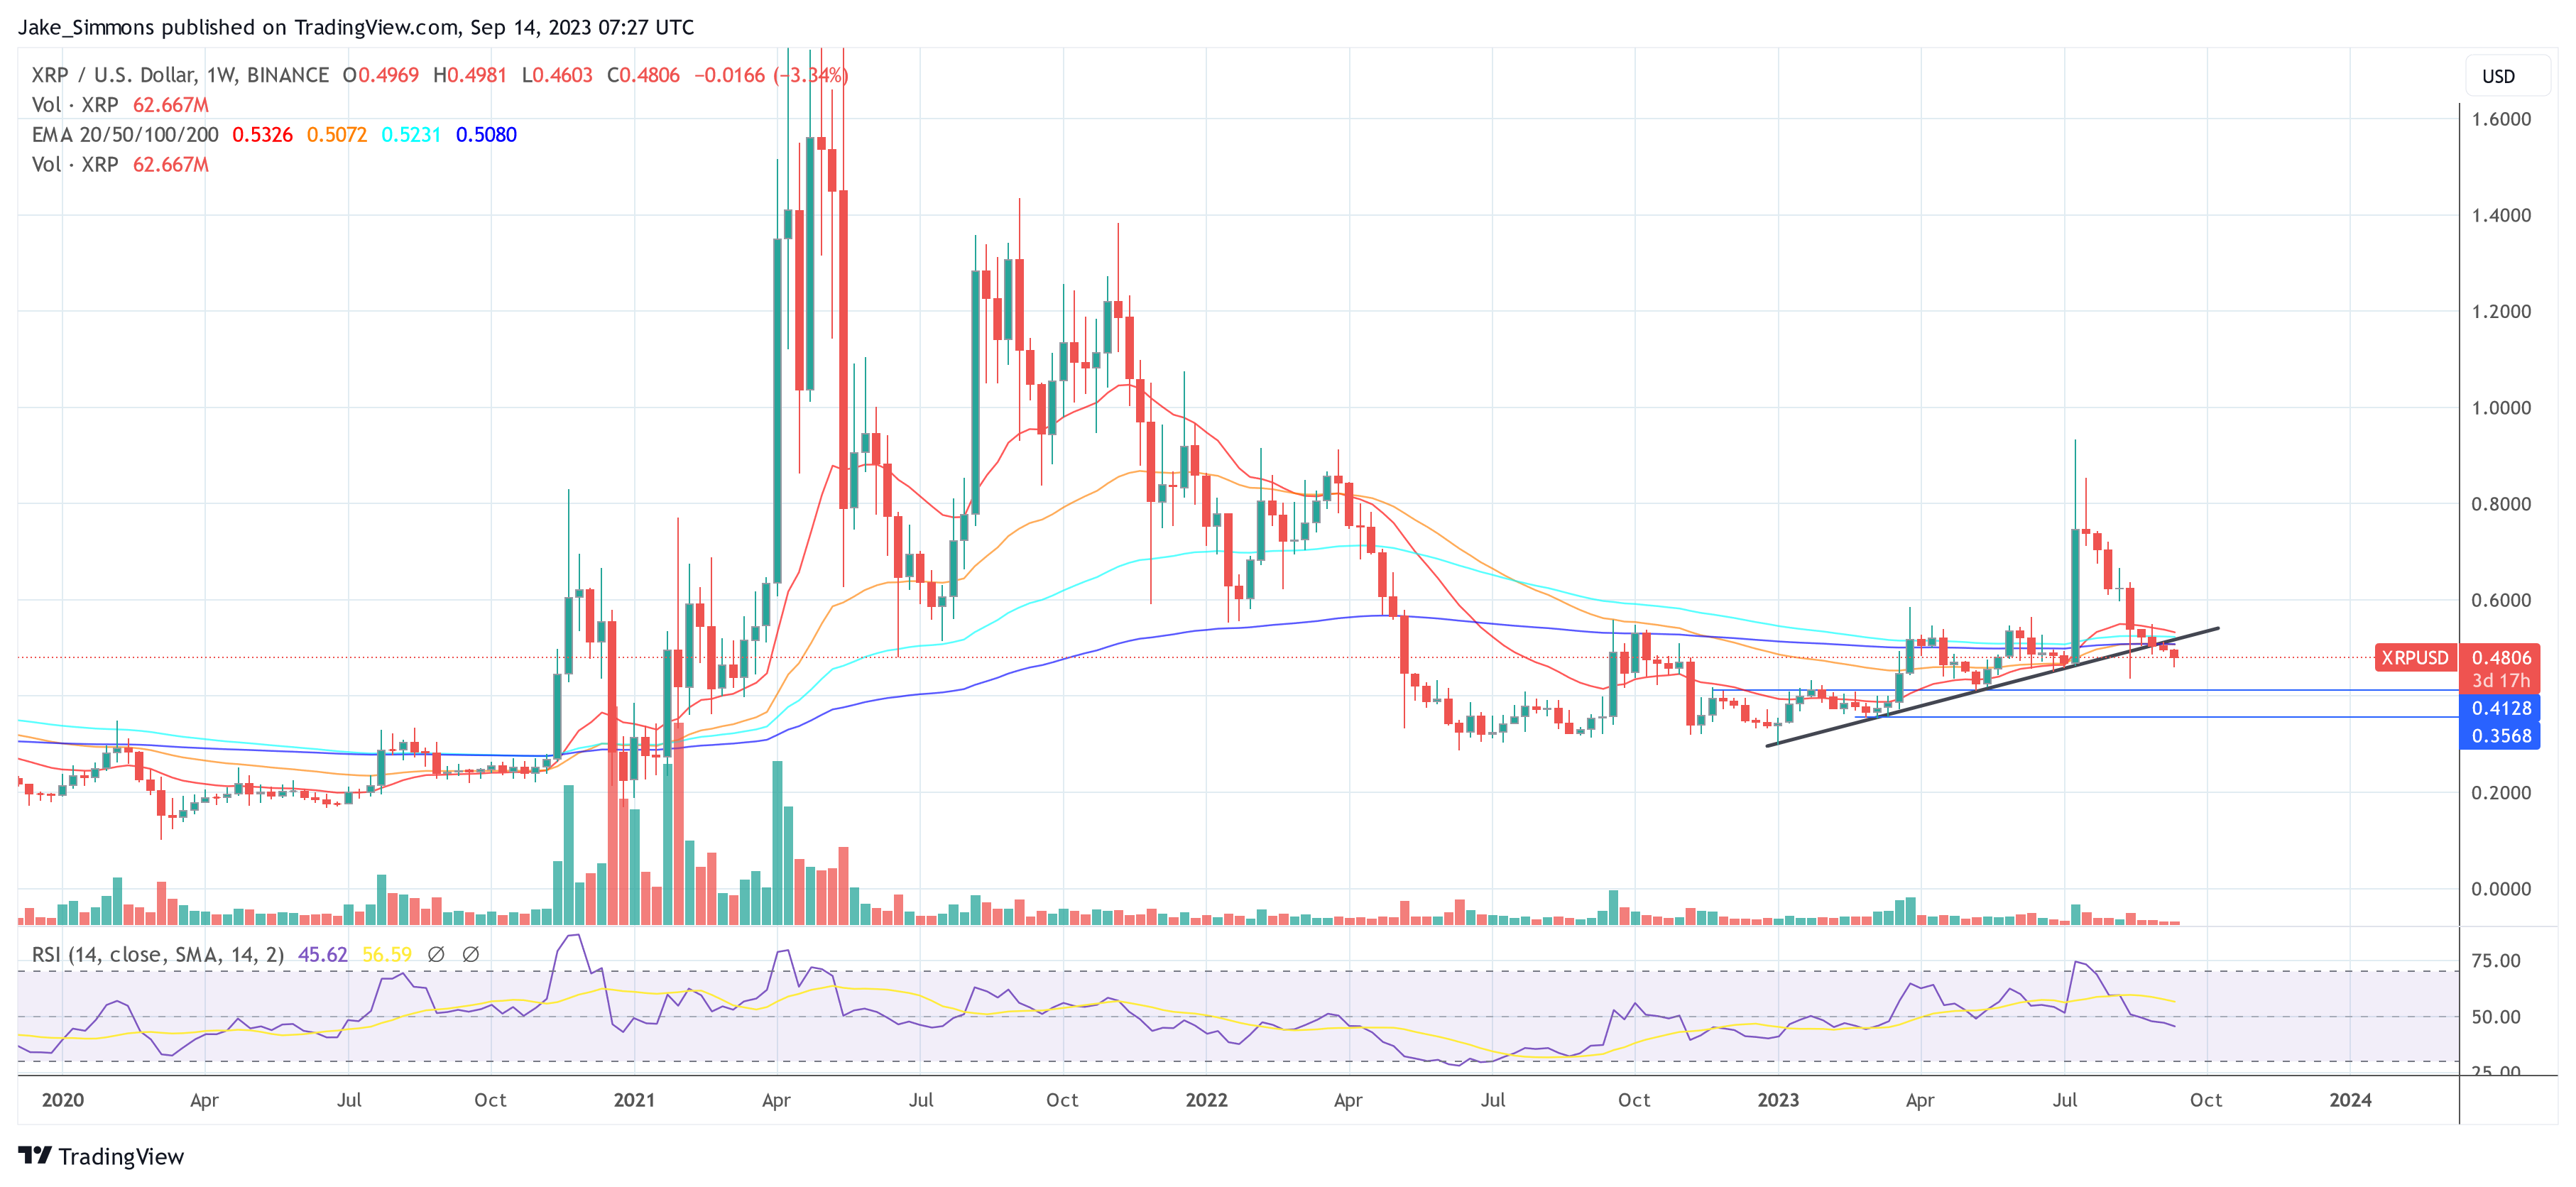
The debate took another turn when Vandell Aljarrah, founder of Black Swan Capitalist, drew parallels between XRP and gold, suggesting that the token could achieve a stable value similar to gold in the future. He cited the capped supply of 100 billion tokens as a potential factor for increased demand as the market matures.
Another perspective emerged from a community member who believed that a decentralized asset’s price could be pegged or fixed, drawing comparisons to the former “gold window” of the Federal Reserve. They posited that entities like the IMF or Ripple could act as central authorities in such a scenario.
As the debate continues, it’s clear that the community remains divided on the issue. While some believe in the potential for a centralized price setting, others, like Eri, firmly stand by the principles of supply, demand, and market dynamics.
At press time, XRP traded at .4806.
Bitcoin’s Path to Money: Menger’s Theory and the Debate on Medium of Exchange vs. Store of Value

Over the past ten years, fervent supporters of digital currency have engaged in intense debates: Is bitcoin (BTC) designed as peer-to-peer electronic cash as illustrated in Satoshi’s groundbreaking white paper, or does it serve as a digital store of value, similar to gold? Additionally, a central question emerges regarding the primary role of money: should its capacity as a medium of exchange take precedence over its value preservation attributes? The following Learning and Insights explainer delves into the Austrian school of economics, shining a spotlight on Carl Menger’s “On the Origins of Money.”
From Spontaneous Social Institution to Currency: Menger’s Insight Into Money’s Evolution
Rather than debating whether bitcoin (BTC) should function as a medium of exchange (MoE) or a store of value (SoV), this editorial aims to explore the primary consideration when something transitions into a monetary unit. In his book “On the Origins of Money,” Carl Menger, the father of Austrian economics, explains that money’s origin is a spontaneous social institution stemming from individuals pursuing their self-interest rather than something imposed by the state.

According to Menger, the process commences with certain commodities becoming more “saleable” than others due to their attributes, such as durability, transportability, and divisibility. These commodities find greater acceptance in trade because they facilitate exchanges for desired goods. Over time, the most saleable commodities become universally accepted as a medium of exchange. Their high saleability arises from the constant demand for them by parties seeking to trade them for other goods.
Menger states:
With the extension of traffic in space and with the expansion over ever longer intervals of time of prevision for satisfying material needs, each individual would learn, from his own economic interests, to take good heed that he bartered his less saleable goods for those special commodities which displayed, beside the attraction of being highly saleable in the particular locality, a wide range of saleableness both in time and place.
Renowned Austrian Economists Mises and Rothbard on Money’s Primary Functions
In the context of bitcoin, Menger’s theory implies that its capacity to serve as a medium of exchange should take precedence over its role in preserving value, particularly in the initial stages. Essentially, BTC must gain wide acceptance in transactions before fulfilling the store of value role. Austrian economists Ludwig von Mises and Murray Rothbard also succinctly explain that the MoE function precedes the SoV function in the transition to money.
In September 2022, authors Kristoffer Mousten Hansen and Karras Lambert, writing for Mises.org, elaborated on Mises’ perspective in a comprehensive essay. They highlight Mises’ belief that a commodity must first “transmit value” over time before becoming a medium of exchange and, subsequently, a store of value. The authors conclude that bitcoin enthusiasts who align with the Austrian school should prioritize the “medium of exchange” function over the “store of value” function, as it is the essential aspect of money according to Mises, Menger, and Rothbard.
Hansen and Lambert assert that “downplaying the importance of active usage of cryptocurrency,” and favoring the “HODL forever” perspective “goes against Mises’s recognition that ‘business usage alone can transform a commodity into a common medium of exchange.’” They also note that the SoV-centric mentality can be traced back to a missive written by the renowned computer scientist Nick Szabo. Despite the prevalence of the SoV-centric perspective in the crypto world, it certainly deviates from the Austrian school’s definition of the origins of money.
What do you think about Carl Menger’s definition of money and how the transition to money works? Share your thoughts and opinions about this subject in the comments section below.
Pro-XRP Legal Expert Takes The Spotlight With Daring Ripple Vs SEC Settlement Theory
There have been talks about the US Securities and Exchange Commission (SEC) and Ripple Labs reaching a settlement following the ruling that XRP isn’t a security. Following this, Pro-XRP lawyer John Deaton has stated a key factor that could lead to a settlement between both parties.
Coinbase’s Motion Key To Settlement
In a tweet released on the X (formerly Twitter) platform, Deaton stated that the “only way” the SEC and Ripple can settle this year is if Judge Failla grants Coinbase’s motion to dismiss the SEC’s lawsuit against it.
The lawyer believes that the key is for Judge Failla to find that token sales on an exchange as part of a programmatic sale do not fall under US securities laws. If that happens, the Commission and its chair, Gary Gensler, may have no choice but to “pivot,” according to Deaton.
He further noted that Judge Failla’s ruling may be final as he doubts the Solicitor General would allow an appeal as the case could end up reaching the Supreme Court, which could “strip away” the SEC’s powers and that of other federal agencies.
The SEC had filed a lawsuit against Coinbase, alleging that the biggest crypto exchange in the US was operating as an unregistered securities exchange by offering several cryptocurrencies on its platform without first registering with the SEC.
In response, Coinbase filed a motion to dismiss the case, stating that the regulator was stepping outside its jurisdiction with such an action. The exchange said the token sales weren’t investment contracts but more commodity sales, with “obligations on both sides discharged” once the transaction occurred.
Interestingly, Coinbase cited Judge Torres’ ruling in favor of Ripple that programmatic sales, such as ones on exchanges, didn’t constitute investment contracts.
How Deaton’s Ripple Settlement Theory Could Play Out
Going by Deaton’s theory, it is believed that the SEC would want to settle with Ripple if the court ruled that the Commission has no jurisdiction over token sales on exchanges. This is plausible because Judge Failla granting Coinbase’s request represents a setback for the Commission in its case against Ripple.
The SEC argues that Ripple’s programmatic sales constituted an investment contract, making XRP a security. However, a win for Coinbase ultimately makes the programmatic sales argument baseless, and it can no longer further the argument since token sales on exchanges are outside its purview.
Regarding the SEC and Gensler wanting to “pivot,” as mentioned by Deaton, this could mean the Commission solely focusing on Ripple’s sale to institutional investors, which the court ruled constituted an investment contract.
Considering that the regulator still has a long way to go to prove which institutional sales were made to domestic investors (the only ones the SEC has jurisdiction over), it may settle with Ripple rather than prolong a case it may eventually lose.
SEC Charges Impact Theory in First NFT-Related Lawsuit Over Unregistered Token Sales
The Securities and Exchange Commission (SEC) has charged Los Angeles-based media company Impact Theory with offering and selling unregistered securities in the form of crypto asset tokens. Notably, this marks the SEC’s first lawsuit targeting an NFT offering.
SEC Sues Impact Theory Over M in NFT Sales
From October 2021 to December 2021, Impact Theory raised nearly million by selling non-fungible tokens (NFTs) called Founder’s Keys without filing a registration statement or qualifying for an exemption, the SEC complaint details. The SEC found that the company violated Sections 5(a) and 5(c) of the Securities Act.
The SEC order states that Impact Theory offered and sold NFTs known as Founder’s Keys at three pricing tiers, describing them as an investment opportunity and promising “tremendous value” to purchasers. Impact Theory compared the investment potential to investing early in successful companies like Disney and Youtube, claiming the proceeds would fund business growth to enrich token holders. However, the company did not register the tokens as securities or qualify for an exemption.
“Absent a valid exemption, offerings of securities, in whatever form, must be registered,” Antonia Apps, director of the SEC’s New York Regional Office stated in the regulator’s press release. “Without registration, investors of all types are deprived of the protections afforded them by the robust disclosures and other safeguards long provided by our securities laws.”
Impact Theory sold nearly 14,000 Founder’s Keys to at least hundreds of investors across the U.S., raising almost million worth of ether cryptocurrency. The company pooled the proceeds in a crypto wallet and used some funds to pay vendors. After the unregistered offering began, Founder’s Keys also traded on secondary markets where Impact Theory programmed the tokens to earn royalties from sales.
As a result of failing to register the securities or qualify for an exemption, the SEC found Impact Theory violated federal securities laws. The company agreed to pay over million in disgorgement, interest, and penalties without admitting or denying the findings. Impact Theory also agreed to destroy tokens in its possession and revise the NFT smart contract code to remove royalties.
What do you think about the SEC suing Impact Theory over its NFT sales? Share your thoughts and opinions about this subject in the comments section below.
Bitcoin Price Prediction: What Elliott Wave Theory Suggests Is Next For BTC
Any Bitcoin price prediction is just a guess without a basis to make the forecast. The stock-to-flow model that was once the most cited reason for expectations of higher prices has failed, leaving technical analysis, on-chain signals, and statistics as the best chance of finding future price targets.
Elliott Wave Theory is a technical analysis forecasting methodology discovered in the 1930s, which is based on identifying extremes in investor psychology combined with distinctive price behavior. With Bitcoin and other cryptocurrencies being so susceptible to the ebb and flow of investor sentiment, here is what Elliott Wave Theory suggests about what is to come for Bitcoin price.
A Brief History Of BTC Price Action
The Bitcoin price index chart begins in late 2010, with the first-ever cryptocurrency trading at only pennies on the dollar. By the end of 2011, the price per BTC grew by more than 60,000%. Before the year came to a close, it has lost 94% of its value.
From the low of approximately , another bullish impulse added yet another 60,000% ROI by the 2013 peak. Yet another steep corrective phase followed, cutting the cryptocurrency down by 86%.
What followed was arguably the most talked about bull run since the dot com bubble, when in 2017 Bitcoin reached nearly ,000 per coin. By now, we can see that extreme price swings and pivots in investors sentiment lead to boom and bust cycles across crypto. Bitcoin once again found a bottom at ,000 in 2018, which will be the basis of the remainder of the analysis.

The first wave ever and the history of Bitcoin price | Source: BTCUSD on TradingView.com
An Introduction To Elliott Wave Theory
First discovered by Ralph Nelson Elliott in the 1930s, Elliott Wave Theory is a basis for explaining how markets grow over time. The motive wave in EWT is an example of markets moving three steps forward, and two steps back.
These steps alternate back and forth between growth and corrective phases. Motive waves consist of five waves in total – with odd numbered waves moving in the direction of the primary trend, and even numbered waves moving against it.
Although corrective phases do result in a drastic decline in value, incremental growth always remains in the primary trend direction. Waves, both impulsive and corrective both appear in varying degrees and timescales.
For example, a five-wave impulse on the daily timeframe could only be a tiny portion of a multi-century Grand Supercycle. Figuring out where Bitcoin is along in its various wave cycles and degrees can help to predict future price action.

Bitcoin price prediction scenarios based on possible wave counts | Source: BTCUSD on TradingView.com
Reviewing The Current Market Cycle, According To EWT
Each wave in an impulse has unique characteristics which can help an analysis decipher where an asset is in an overall motive wave. Following the 2018 bear market bottom, crypto had a clean slate to move up from. In 2019, Bitcoin rallied to ,800, showing the market there was still life in the speculative asset.
Nearly the entire rally retraced, which is a common characteristic of a wave 2 correction. Corrections tend to alternate between sharp and flat-style corrections. Sharp corrections are represented by zig-zags. Wave 2 behaved like a zig-zag and there is no denying that the March 2020 Black Thursday collapse was a sharp correction.
Wave 3 in Elliott Wave is typically the longest and strongest wave, marked by much wider participation than wave 1. The crowd begins piling at this point. Bitcoin gained national media attention as it reached new all-times during this wave. From there, things get more confusing.
Elliott Wave practitioners are divided among if BTCUSD completed its wave 4 and wave 5 phases already, or if wave 4 is still in progress and wave 5 is yet to come. Using these two scenarios, some targets can be considered.

Things could get extremely bearish for Bitcoin if the cycle has ended | Source: BTCUSD on TradingView.com
The Bearish And Bullish Scenarios And Targets
In the bearish scenario, a truncated wave 5 ended the Bitcoin bull run and sent the crypto market into its first true bear phase, with wave 5 of V finished and done, ending the primary cycle (pictured above).
Completed bull markets often retrace back into wave 3/4 territory when the motive wave is completed. Bearish price targets put the negative Bitcoin price prediction from anywhere between ,000 to as low as ,000 in a complete collapse of the market. A larger catastrophe in the stock market and housing could ultimately do the trick by pulling whatever capital that’s left out of crypto.
The bullish scenario is much more positive, and better fits with what Elliott Wave Theory calls “the right look” and proper counting. In the bullish scenario, Bitcoin is in the final stages of an expanded flat correction, and once the sentiment and price extremes are finished, the top cryptocurrency will be fast off to setting another bullish price extreme and sentiment switch, much faster than anyone is prepared for.

BTC appears to be in the final stages of an expanded flat wave 4 correction | Source: BTCUSD on TradingView.com
Using EWT To Make A Bitcoin Price Prediction
The magic behind Elliott Wave Theory and why it influences growth in financial markets is due to its relationships with Fibonacci numbers. Fibonacci numbers are based on the Fibonacci sequence, which is related to the golden ratio. The Fibonacci sequence reads 0, 1, 1, 2, 3, 5, 8, 13, 21 and so on.
In Elliott Wave Theory, there are 21 corrective patterns ranging from simple to complex. A motive wave is 5 waves up, while corrective waves are 3 waves down, creating a total of 8 when added them up. A full realized impulse wave with all sub-waves is 21 waves up, while corrective phases are up to 13 waves down. Every Fibonacci number from the sequence is included in some capacity.
Corrections also stop at Fibonacci retracement levels, and impulses reach Fibonacci extensions as price targets. Wave 5 is usually equal to wave 1 or wave 3 in terms of magnitude. If wave 5 is extended, and it often is in crypto, wave 5’s target could fall somewhere between 1.618 of wave 3, or 1.618 of the sum of wave 1 and wave 3.
Bitcoin price reached the 3.618 extension from the bear market bottom, making it possible that the top cryptocurrency overshoots once again. On the lowest end, a 1.618 price target would put the peak of BTC for this cycle somewhere close to ,000 per coin, while another 3.618 extension could take the top cryptocurrency all the way to 4,000 per BTC.
This makes the Bitcoin price prediction using EWT anywhere between 0K to 0K before the cycle is over. You can watch this Bitcoin price prediction unfold in real-time by bookmarking the idea on TradingView.

A possible Bitcoin price prediction based on Fibonacci extensions | Source: BTCUSD on TradingView.com
There are only a few days left to take advantage of @elliottwaveintl's “The 12 Days of Elliott”
Take a peek & sign-up here: https://t.co/IuPkJZ5IM7
Watch your inbox for a new resource each day. Everyone gets access to the free resources till Dec. 16.
Happy Holidays! pic.twitter.com/DCqrdtNfDp
— Tony "The Bull" Spilotro (@tonyspilotroBTC) December 8, 2022
Featured image from iStockPhoto, Charts from TradingView.com
WATCH: Bitcoin, Wyckoff Theory, And The Composite Man | BTCUSD September 8, 2022
In this episode of NewsBTC’s daily technical analysis videos, we compare Bitcoin price action with Wyckoff accumulation schematics, price cycles and more.
Take a look at the video below:
VIDEO: Bitcoin Price Analysis (BTCUSD): September 8, 2022
This video provides a detailed look at Bitcoin market cycles using Wyckoff theory and other cyclical tools.
Is The Composite Man Behind Bitcoin Mark Down?
Wyckoff theory is based on the idea that retail traders are regularly outsmarted by large operators he referred to as the Composite Man. It is also known for its phases of accumulation and distribution, and the mark up and mark down phases that occur in between as the market goes through bullish and bearish cycles.
The recent price action continues to follow what looks a lot like Wyckoff accumulation. After breaching preliminary support, price reached the selling climax at ,500. What we potentially just saw this week was a secondary test in phase B. that’s the good news. The bad news is that there could be a long time until we see high prices again.
A comparison with an Wyckoff accumulation schematic | Source: BTCUSD on TradingView.com
How A Spring Could Put An End To Crypto Winter
That was also just one of Wyckoff’s accumulation schematics. Another schematic example includes a final shakeout called a spring. Based on the schematic, the spring would occur some time around December and a breakout would occur in April.
This is especially notable, because that is exactly when Bitcoin bottomed in 2018 and when the accumulation phases ended in 2019. Even more interesting, is the fact that December has frequently been a timing factor for tops and bottoms in Bitcoin all throughout its history.
Will we get a spring or not? | Source: BTCUSD on TradingView.com
Related Reading: WATCH: Ethereum Gains Momentum Ahead Of The Merge | ETHUSD September 6, 2022
Wyckoff, Gann, And Other Technical Analysis Greats
Even the 2017 peak was in December, which we are currently retesting for the umpteenth time. The month of December mysteriously was one of WD Gann’s favorite months to look for tops and bottoms, and it was due to how the Sun conjuncts Mercury while in Sagittarius.
Gann, like Wykoff was one of the all-time greats. Both are known as two of the five titans of finance, which include with Charles Merrill from Merrill Lynch, Charles Dow from Dow Theory and the Dow Jones Industrial Average, and Ralph Nelson Elliott who created Elliott Wave Theory.
Gann’s methodology was the most mystical of them all. Check out how flawlessly one of his tools, the Gann fan, called the breakout from the bear market and an incredible 500% advance in the example below.
Gann’s tools are based on geometry, angles, and time | Source: BTCUSD on TradingView.com
What To Make Of The Current BTCUSD Market Cycle
Markets are indeed cyclical, as Wyckoff and the other greats believed. The cycle begins with accumulation after an asset becomes oversold. Demand begins to outweigh supply and mark up begins. Then the composite man begins to slowly distribute on retail, before mark down begins and supply outweighs demand.
It sounds simple, but this is just how it works. Bases on a visual inspection alone and how history has rhymed in the past, we could potentially be in or nearing accumulation and mark up will return soon enough.
Is it almost time for another bull run? | Source: BTCUSD on TradingView.com
Learn crypto technical analysis yourself with the NewsBTC Trading Course. Click here to access the free educational program.
Follow @TonySpilotroBTC on Twitter or join the TonyTradesBTC Telegram for exclusive daily market insights and technical analysis education. Please note: Content is educational and should not be considered investment advice.
Featured image from iStockPhoto, Charts from TradingView.com
NewsBTC