 PRESS RELEASE. Geneva, Switzerland, May 28, 2024 – The TRON DAO has officially announced LayerZero support for the TRON blockchain, making TRON the second non-EVM chain to be integrated into LayerZero’s cross-chain interoperability protocol. This significant development allows TRON ecosystem developers to seamlessly expand their applications to over 70 other networks supported by LayerZero. LayerZero […]
Bitcoin News
Bitcoin Price Crashes After New ATH, Are Dips Supported At $60K?
Bitcoin price traded to a new all-time high above ,000 before crashing. BTC is now consolidating near ,000 and might decline toward the ,000 support.
- Bitcoin price created history again and traded to a new all-time above ,000.
- The price is trading below ,000 and the 100 hourly Simple moving average.
- There was a break below a key bullish trend line with support at ,000 on the hourly chart of the BTC/USD pair (data feed from Kraken).
- The pair could extend losses and revisit the key ,000 support zone.
Bitcoin Price Takes Hit
Bitcoin price extended its increase above the ,000 resistance. BTC even broke the ,800 level and traded to a new all-time high at ,218. However, there was a strong bearish reaction from ,200.
The price crashed over 10% and dived toward the ,000 zone. There was a break below a key bullish trend line with support at ,000 on the hourly chart of the BTC/USD pair. A low was formed near ,150 and the price is now attempting a recovery wave.
There was a move above the ,000 resistance. It is now facing resistance near the ,000 zone and the 50% Fib retracement level of the downward move from the ,218 swing high to the ,150 low.
Bitcoin is now trading below ,000 and the 100 hourly Simple moving average. Immediate resistance is near the ,000 level. The next key resistance could be ,200, above which the price could rise toward the ,500 resistance zone.
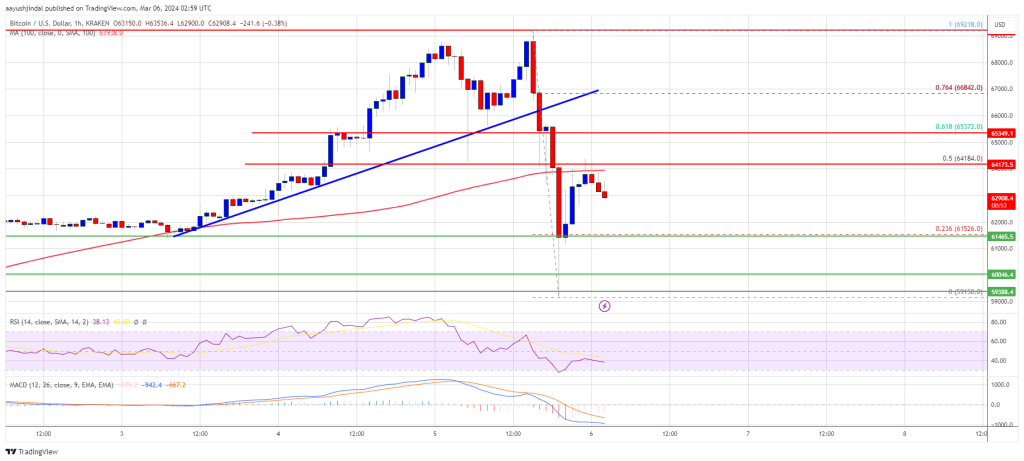
Source: BTCUSD on TradingView.com
If there is a clear move above the ,500 resistance zone or the 61.8% Fib retracement level of the downward move from the ,218 swing high to the ,150 low, the price could rise toward the ,000 level. Any more gains might send the price toward the ,000 level.
More Losses In BTC?
If Bitcoin fails to rise above the ,200 resistance zone, it could start another downside correction. Immediate support on the downside is near the ,000 level.
The first major support is ,500. If there is a close below ,500, the price could start a decent pullback toward the ,000 zone. Any more losses might send the price toward the ,500 support zone.
Technical indicators:
Hourly MACD – The MACD is now gaining pace in the bearish zone.
Hourly RSI (Relative Strength Index) – The RSI for BTC/USD is now below the 50 level.
Major Support Levels – ,000, followed by ,000.
Major Resistance Levels – ,200, ,500, and ,000.
Bitcoin Price Consolidates Below Resistance, Are Dips Still Supported?
Bitcoin price is correcting gains from the ,500 resistance. BTC must stay above the ,500 support to remain in a bullish zone this month.
- Bitcoin price is struggling to clear the ,800 resistance zone.
- The price is trading below ,200 and the 100 hourly Simple moving average.
- There was a break below a key bullish trend line with support at ,200 on the hourly chart of the BTC/USD pair (data feed from Kraken).
- The pair could start a fresh increase unless there is a clear move below the ,500 support.
Bitcoin Price Faces Hurdles
Bitcoin price made another attempt to gain strength above the ,000 resistance zone. BTC broke the ,200 level, but the bears were still active near the ,500 level.
A high was formed near ,475 and the price is now correcting gains. There was a move below the ,000 level. The pair traded below the 50% Fib retracement level of the upward move from the ,581 swing low to the ,475 high.
Besides, there was a break below a key bullish trend line with support at ,200 on the hourly chart of the BTC/USD pair. Bitcoin is now trading below ,000 and the 100 hourly Simple moving average.
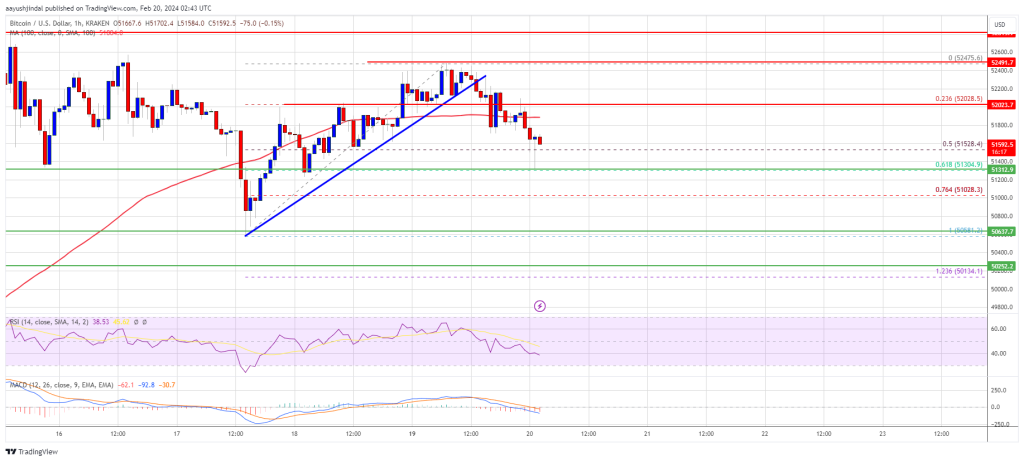
Source: BTCUSD on TradingView.com
Immediate resistance is near the ,000 level. The next key resistance could be ,200, above which the price could rise toward the ,500 resistance zone. The main resistance is still near the ,800 level. A clear move above the ,800 resistance could send the price toward the ,500 resistance. The next resistance could be near the ,000 level.
More Losses In BTC?
If Bitcoin fails to rise above the ,200 resistance zone, it could start another decline in the near term. Immediate support on the downside is near the ,300 level and the 61.8% Fib retracement level of the upward move from the ,581 swing low to the ,475 high.
The first major support is ,000. If there is a close below ,000, the price could gain bearish momentum. In the stated case, the price could decline toward the ,500 support zone, below which the price might turn bearish in the short term.
Technical indicators:
Hourly MACD – The MACD is now gaining pace in the bearish zone.
Hourly RSI (Relative Strength Index) – The RSI for BTC/USD is now below the 50 level.
Major Support Levels – ,300, followed by ,500.
Major Resistance Levels – ,200, ,500, and ,800.
Bitcoin Price Crashes 8% and Wipes Weekly Gains, Dips Supported?
Bitcoin price started a sharp decline after trading close to ,000. BTC is down over 8% but the bulls seem to be active above ,000.
- Bitcoin is showing a few bearish signs from the ,699 high.
- The price is trading below ,500 and the 100 hourly Simple moving average.
- There was a break below a key bullish trend line with support near ,500 on the hourly chart of the BTC/USD pair (data feed from Kraken).
- The pair could find strong buying interest near the ,000 zone.
Bitcoin Price Drops Heavily
Bitcoin price remained in a bullish zone after it broke the ,000 resistance. BTC climbed higher steadily above the ,000 and ,000 levels. The price even rallied above ,000.
However, it failed to test the ,000 resistance. A high was formed near ,699 and the price started a sharp downside correction. There was a move below the ,000 level. Besides, there was a break below a key bullish trend line with support near ,500 on the hourly chart of the BTC/USD pair.
The pair declined below the 50% Fib retracement level of the upward move from the ,398 swing low to the ,699 high. Bitcoin is now trading below ,500 and the 100 hourly Simple moving average.
However, the bulls are protecting the ,000 support and the 76.4% Fib retracement level of the upward move from the ,398 swing low to the ,699 high. The price is attempting a recovery wave and facing resistance near the ,400 level.
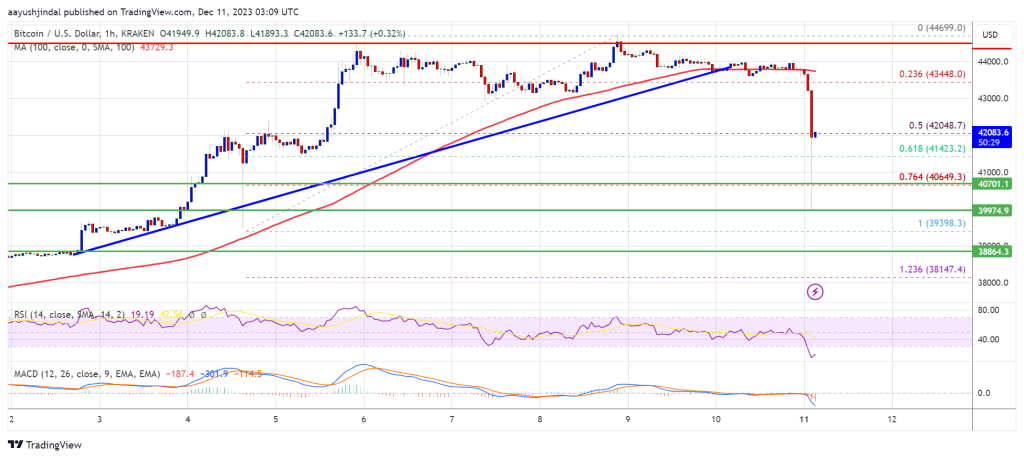
Source: BTCUSD on TradingView.com
The first major resistance is forming near ,2000, above which the price might gain bullish momentum and rise toward ,000. A close above the ,000 resistance might start a strong upward move. The next key resistance could be near ,200, above which BTC could rise toward the ,000 level.
K Is The Key For BTC
If Bitcoin fails to rise above the ,200 resistance zone, it could start another decline. Immediate support on the downside is near the ,200 level.
The next major support is near ,500, below which the price might test the ,000 zone. If there is a move below ,000, there is a risk of more downsides. In the stated case, the price could drop toward the ,500 support in the near term.
Technical indicators:
Hourly MACD – The MACD is now gaining pace in the bearish zone.
Hourly RSI (Relative Strength Index) – The RSI for BTC/USD is now below the 30 level.
Major Support Levels – ,200, followed by ,000.
Major Resistance Levels – ,400, ,200, and ,200.
Bitcoin Price Supported By Thin $40 Million Bid Pool, But For How Long?
In the ongoing market turbulence on higher timeframes, Bitcoin (BTC) is at a crucial juncture as a great consolidation phase persists.
Research and analysis firm Material Indicators closely monitored the recent weekly candle close/open, paying particular attention to two key factors: the trend line and the 21-day, 21-week, and 21-month moving averages (MA) – all of which are currently influential in shaping market dynamics.
Uncertainty And Potential Turning Point For Bitcoin
The opening of the weekly candle below the trend line triggered a “subsequent nosedive,” amplifying concerns. While the 21-week and 21-month moving averages continue to serve as robust support, the 21-day MA has faced a rigorous seven-day testing period, according to the firm’s analysis.
Notably, the tight correlation of the 21-MA across three distinct time frames is rare, indicating that the market is at a critical inflection point.
Despite the compressed volatility witnessed in recent days, the price action observed over the past 24 hours exemplifies the market’s attempt to shake out weak hands.
According to Material Indicators, given the complexity of the current price action, it is prudent to zoom out and gain a broader perspective. Both Trend Precognition algorithms identified these moves on the four-hour chart, emphasizing the significance of adopting a comprehensive outlook.
Moreover, according to Materials, the order book reveals a concerning trend in bid liquidity, with less than million holding the price up.
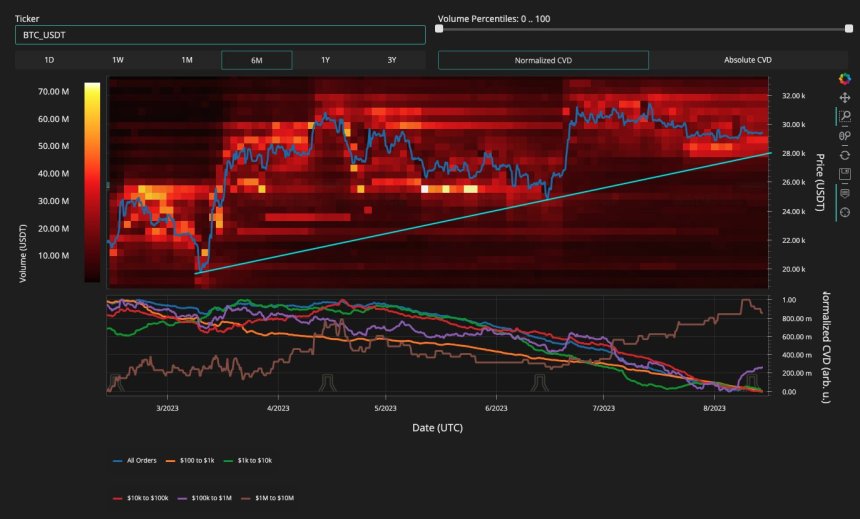
The absence of substantial liquidity below this level raises fundamental worries. However, it also suggests that there may not be sufficient sentiment to drive prices significantly lower – at least not yet.
In addition, Material Indicators highlights that the examination of liquidity movements within the order book over the past month paints a picture of continued price volatility with a potential upward bias.
However, the lack of volume raises concerns about the market’s overall health. Despite a million buy wall at ,900, the bottom of the channel at ,300 remains a critical threshold for BTC to extend its current trend. The firm claims:
… the bottom of the channel at .3k remains my line in the sand for BTC to extend the trend, and I maintain that we must see weekly candles printing above the 100-Week MA to even consider a bull breakout.
BCT Faces Renewed Pressure Amid Strengthening US Dollar
As Bitcoin enters a new week of trading, market participants closely monitor the potential impact of the strengthening US Dollar Index ($DXY) on the world’s leading cryptocurrency.
According to Yan Alleman, co-founder of blockchain analytics firm Glassnode, recent developments suggest that BTC may face renewed pressure due to the upward momentum of the $DXY.
Alleman highlights that the $DXY’s renewed strength could exert downward pressure on Bitcoin’s price. Historically, there has been an inverse correlation between the value of the US Dollar and the price of BTC, meaning that when the dollar strengthens, Bitcoin often faces headwinds.
However, options pricing indicates a bullish sentiment for Bitcoin in the coming month. Options are financial derivatives that allow traders to speculate on the future price of an underlying asset, in this case, Bitcoin.
The pricing of options contracts suggests an expectation of a bullish move shortly. This aligns with the technical analysis indicating potential upside for Bitcoin.
Analyzing the potential price movements, Alleman notes that it would require nearly twice as much selling pressure to push Bitcoin down to the low ,000 range compared to the buying pressure needed to surpass the ,000 level.
This observation suggests that there may be greater support and buying interest at higher price levels, making a sustained drop less likely.
As of the time of writing, Bitcoin (BTC) is trading at ,500, reflecting a marginal 0.4% increase over the past 24 hours.
Featured image from iStock, chart from TradingView.com
Japan Blockchain Week 2023 Supported by Ministry of Economy, Trade and Industry

PRESS RELEASE. The Japanese Ministry of Economy, Trade and Industry (METI) has confirmed its support for Japan Blockchain Week 2023, establishing it as a significant platform for both the global and Japanese blockchain communities to convene, building upon the success of the previous year’s event in 2022.
Official Website: https://japanblockchainweek.jp/
The Ministry of Economy, Trade and Industry (METI) has enthusiastically announced its decision to provide support for Japan Blockchain Week—an incredible, all-Japan global event that aims to showcase the Japanese blockchain industry to the world!
Last year’s Japan Blockchain Week garnered immense global attention with over 30 captivating community events. And now, in the wake of the Covid-19 pandemic settling down, this year’s Japan Blockchain Week promises to be even more remarkable. Enthusiastic participants from both Japan and abroad are expected to flock to this eagerly anticipated event. It’s an extraordinary opportunity for all attendees to connect Japanese web3 communities with the international web3 community—let’s make the most of it!
Community Events Applications Now Open
Excitingly, applications for community events are now open! Don’t miss out! Head over to the Community Events section of the Japan Blockchain Week website and follow the instructions to register.
Japan Blockchain Week 2023 Outline of Official Event
Date : June 18th 2023 – July 9th 2023
For details of each event, please refer to each event’s website.
Note : METI will support only the 9 events listed below.
Web3 Incubation Program by Sony Network Communications and Astar – Demo Day
Organizer : Sony Network Communications、Startale Labs Pte Ltd
開催日程:2023年6月18日
Start and end times : 13:00 – 18:00
URL:https://astar.network/incubation
WEB3 BIZDEV SUMMIT -BLUE- 3
Organizer : Ameyumi
Date : June 18, 2023
Start and end times : 16:30-20:00
Venue : Accenture Innovation Hub Tokyo
TOKYO BLOCKCHAIN TECH MEETUP
Organizer : double jump.tokyo Inc. , Amazon Web Services Japan G.K.
Date : June 21, 2023
Start and end times : 19:00 – 21:00 (provisional)
Non Fungible Tokyo 2023
Organizer : JapanBlockchainWeek
Date : June 22, 2023
Start and end times : 11:00 – 19:00
URL:https://nonfungible.tokyo/
CAF2023
Organizer : BeyondConcept
Date : From June 23, 2023 –
Start and end times : 11:00 – 19:00 (provisional)
BOOOST!! CONNECT: Web3 Entertainment Summit (JBW Official Events)
Organizer : Emoote Pte. Ltd.
Date : June 24, 2023
Start and end times :13:00 – 17:00
Free event
Venue to be officially notified to participants at a later date
URL : https://lu.ma/mcbvvx88
JapanBlockchainWeek official Tokyo wrap up Party
Organizer : JapanBlockchainWeek
Date : June 24, 2023
Start and end times : 18:00 – 21:30
Venue:to be determined
IVS Crypto 2023 KYOTO
Organizer : IVS KYOTO
Date : June 28, 2023- June 30, 2023
Venue : Kyoto International Exhibition Hall “Miyako Messe” / ROHM Theatre Kyoto
URL:https://www.ivs.events/crypto
web3BB Tokyo Summer
Organizer : Pivot Tokyo
Date : July 5, 2023 – July 6, 2023
Start and end times : 10:00-19:00
Venue : THE NATIONAL ART CENTER, TOKYO
URL : https://www.web3bb.pivot-tokyo.com/
Japan Blockchain Week Sponsors
Aki Network
URL : https://akiprotocol.io/
Astra: OmniRise
URL : https://aor.games/
double jump.tokyo Inc.
URL : https://www.doublejump.tokyo/
GensoKishi Online -Meta World-
URL : https://genso.game/
HashPalette Inc.
URL : https://hashpalette.com/
Kyuzan Inc.
Minto Inc.
URL : https://minto-inc.jp/
MZ Web3 Fund
URL : https://web3.mzfund.co.jp/
Oasys Pte. Ltd.
URL : https://www.oasys.games/
Slash Fintech Limited
URL : https://slash.fi/
For more information:
Japan Blockchain Week Site
HP: https://japanblockchainweek.jp/
Twitter : https://twitter.com/JBCWeek
This is a press release. Readers should do their own due diligence before taking any actions related to the promoted company or any of its affiliates or services. Bitcoin.com is not responsible, directly or indirectly, for any damage or loss caused or alleged to be caused by or in connection with the use of or reliance on any content, goods or services mentioned in the press release.
Ethereum Price Remains Supported For A Fresh Increase Above $1,600
Ethereum is consolidating gains above ,500 against the US Dollar. ETH could start another increase and clear the ,600 resistance zone in the near term.
- Ethereum is showing positive signs above the ,500 and ,520 resistance levels.
- The price is now trading above ,550 and the 100 hourly simple moving average.
- There is a connecting bullish trend line forming with support near ,570 on the hourly chart of ETH/USD (data feed via Kraken).
- The pair could rise further unless there is a downside break below the ,515 support.
Ethereum Price Eyes Another Increase
Ethereum price remained stable above the ,500 resistance. ETH made another attempt to clear the ,600 resistance zone, similar to bitcoin at ,500.
However, the bears were active near the ,600 resistance zone. A high is formed near ,607 and the price is now consolidating gains. There was a minor decline below the 50% Fib retracement level of the upward move from the ,541 swing low to ,607 high.
The price is now showing positive signs above the ,540 support. It even remained stable above the 61.8% Fib retracement level of the upward move from the ,541 swing low to ,607 high.
Ether price is now trading above ,550 and the 100 hourly simple moving average. There is also a connecting bullish trend line forming with support near ,570 on the hourly chart of ETH/USD. An immediate resistance is near the ,600 level. The next major resistance is near the ,620 level. An upside break above the ,620 resistance zone could start a fresh increase.
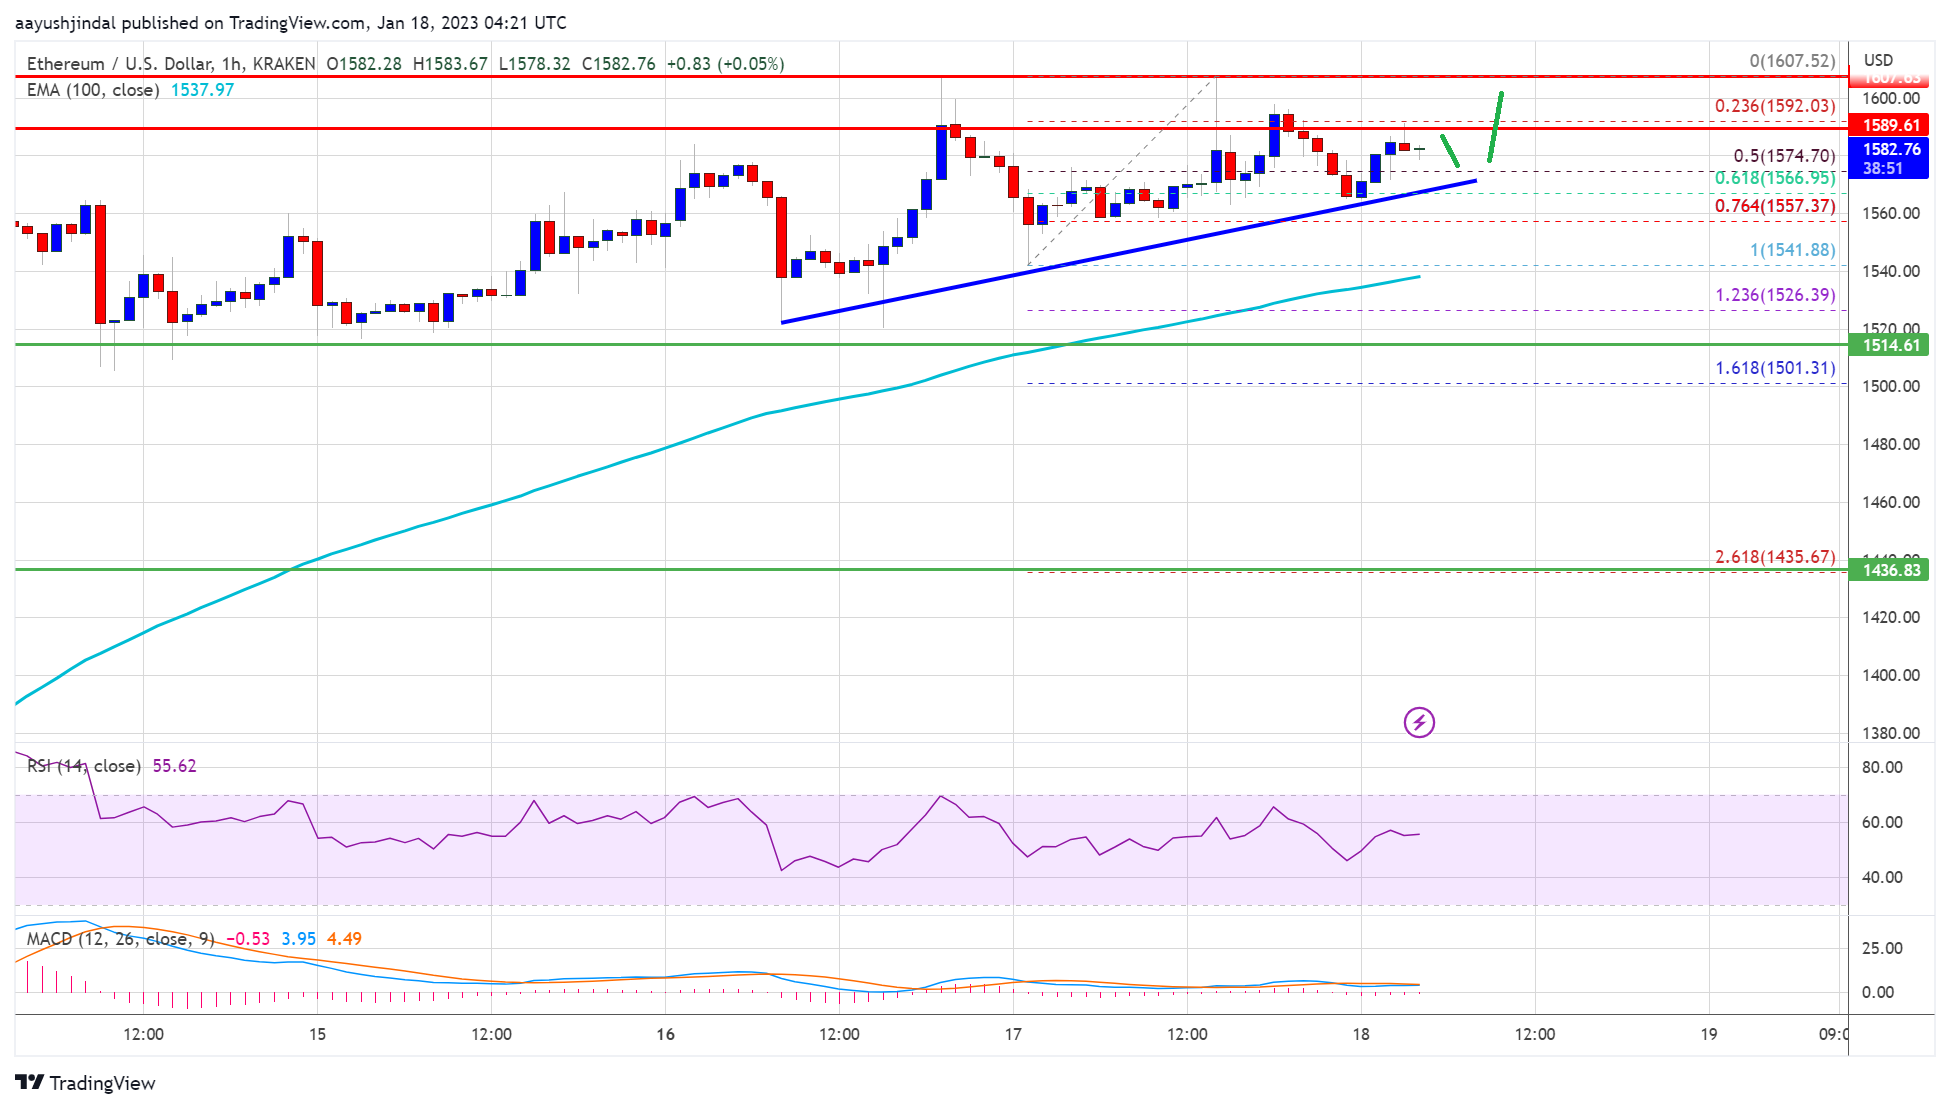
Source: ETHUSD on TradingView.com
In the stated case, the price may perhaps rise towards the ,700 resistance. Any more gains might send the price towards ,720 or even ,750 in the near term.
Dips Limited in ETH?
If ethereum fails to clear the ,600 resistance, it could start a downside correction. An initial support on the downside is near the ,575 level and the trend line.
The next major support is near the ,550 level. If there is a move below ,550, the price might test the ,515 support. Any more losses might call for a test of the ,450 zone.
Technical Indicators
Hourly MACD – The MACD for ETH/USD is now gaining momentum in the bullish zone.
Hourly RSI – The RSI for ETH/USD is now above the 50 level.
Major Support Level – ,540
Major Resistance Level – ,600
TA: Bitcoin Price Eyes Fresh Increase To $22K, Why Dips Remain Supported
Bitcoin started a steady increase above the ,000 resistance against the US Dollar. BTC could rise further towards ,000 if it stays above the ,500 support.
- Bitcoin is slowly moving higher above the ,000 resistance zone.
- The price is now trading above the ,800 level and testing the 100 hourly simple moving average.
- There was a break above a short-term bearish trend line with resistance near ,000 on the hourly chart of the BTC/USD pair (data feed from Kraken).
- The pair might gain bullish momentum if it clears the ,500 and ,600 levels.
Bitcoin Price Shows Positive Signs
Bitcoin price formed a base above the ,200 level and started a decent increase. The price traded above the ,500 resistance zone to move into a positive zone.
The price even gained pace above the ,000 level and settled above the 100 hourly simple moving average. A high was formed near ,664 before there was a downside correction. The price traded below the ,000 level, but the bulls were active near the ,750 zone and the 100 hourly simple moving average.
A low was formed near ,748 and the price is now rising. It broke the 23.6% Fib retracement level of the downward move from the ,664 swing high to ,748 low.
There was also a break above a short-term bearish trend line with resistance near ,000 on the hourly chart of the BTC/USD pair. On the upside, bitcoin price could resistance near the ,200 level. It is near the 50% Fib retracement level of the downward move from the ,664 swing high to ,748 low.
Source: BTCUSD on TradingView.com
The next key resistance is near the ,500 zone. A close above the ,500 resistance zone could set the pace for a decent increase. In the stated case, the price may perhaps rise towards the ,000 level. The next major resistance sits near the ,800 level.
Dips Supported in BTC?
If bitcoin fails to clear the ,500 resistance zone, it could start a downside correction. An immediate support on the downside is near the ,000 level.
The next major support now sits near the ,750 level and the 100 hourly SMA. A clear move below the ,750 support might send the price towards ,500.
Technical indicators:
Hourly MACD – The MACD is now gaining pace in the bullish zone.
Hourly RSI (Relative Strength Index) – The RSI for BTC/USD is now above the 50 level.
Major Support Levels – ,000, followed by ,750.
Major Resistance Levels – ,200, ,500 and ,000.
TA: Bitcoin Price Could Surge To $22K, Why BTC Remains Supported
Bitcoin started a decent increase above the ,000 resistance against the US Dollar. BTC is trading above ,500 and eying more gains towards the ,000 level.
- Bitcoin is slowly moving higher above the ,000 resistance zone.
- The price is now trading above the ,200 level and testing the 100 hourly simple moving average.
- There is a key bullish trend line forming with support near ,400 on the hourly chart of the BTC/USD pair (data feed from Kraken).
- The pair might gain bullish momentum if it clears the ,750 and ,000 levels.
Bitcoin Price Gains Momentum
Bitcoin price formed a base above the ,000 level and started a decent increase. The price traded above the ,000 resistance zone to move into a positive zone.
There was a clear move above the 23.6% Fib retracement level of the downward move from the ,500 swing high to ,916 low. At first, the price saw a rejection near the ,500 level. However, the bulls were active near the ,600 level.
Bitcoin started another increase above the ,500 resistance zone. It is now trading above the ,200 level and testing the 100 hourly simple moving average. There is also a key bullish trend line forming with support near ,400 on the hourly chart of the BTC/USD pair.
On the upside, the price could resistance near the ,750 level. It is near the 50% Fib retracement level of the downward move from the ,500 swing high to ,916 low. The next key resistance is near the ,000 zone.
Source: BTCUSD on TradingView.com
A close above the ,000 resistance zone could set the pace for a decent increase. In the stated case, the price may perhaps rise towards the ,650 level. The next major resistance sits near the ,000 level.
Fresh Decline in BTC?
If bitcoin fails to clear the ,750 resistance zone, it could start a fresh decline. An immediate support on the downside is near the ,500 level.
The next major support now sits near the ,400 level and the trend line. A close below the trend line support zone could accelerate losses. In the stated case, there is a risk of a move towards the ,000 level.
Technical indicators:
Hourly MACD – The MACD is now gaining pace in the bullish zone.
Hourly RSI (Relative Strength Index) – The RSI for BTC/USD is now above the 50 level.
Major Support Levels – ,400, followed by ,000.
Major Resistance Levels – ,750, ,000 and ,650.
TA: Bitcoin Price Remains Supported, $30.8K Holds The Key
Bitcoin remained in a positive zone above ,200 against the US Dollar. BTC could correct lower, but the bulls might remain active near ,800.
- Bitcoin is showing positive signs above the ,500 and ,000 resistance levels.
- The price is now trading above the ,200 level and the 100 hourly simple moving average.
- There is a key bullish trend line forming with support near ,800 on the hourly chart of the BTC/USD pair (data feed from Kraken).
- The pair could correct lower and test the ,000 and ,800 support levels.
Bitcoin Price Faces Key Resistance
Bitcoin price extended increase above the ,000 zone. It even broke the ,000 resistance on a couple of occasions, but the bears protected more gains above ,200.
The recent swing high was formed near ,400 before the price started a downside correction. There was a move below the ,000 level. The price corrected and tested the 23.6% Fib retracement level of the upward move from the ,085 swing low to ,400 high.
It is now testing the ,800 zone. There is also a key bullish trend line forming with support near ,800 on the hourly chart of the BTC/USD pair. Bitcoin is also well above the ,200 level and the 100 hourly simple moving average.
Source: BTCUSD on TradingView.com
An immediate resistance on the upside is near the ,000 level. The next major resistance is near the ,200 and ,400 levels. A clear move above the ,400 resistance level could start another increase. In the stated case, the price could rise towards the ,500 resistance. The next major resistance sits near the ,400 level.
Dips Supported in BTC?
If bitcoin fails to clear the ,400 resistance zone, it could start a downside correction. An immediate support on the downside is near the ,800 level and the trend line. A downside break below the trend line could send the price towards the ,800 support.
The 50% Fib retracement level of the upward move from the ,085 swing low to ,400 high is also near the ,800 level. Any more gains might open the doors for a move towards the ,000 support.
Technical indicators:
Hourly MACD – The MACD is now losing pace in the bullish zone.
Hourly RSI (Relative Strength Index) – The RSI for BTC/USD is moving lower towards the 50 level.
Major Support Levels – ,800, followed by ,800.
Major Resistance Levels – ,000, ,200 and ,400.