 The American Bankers Association, Bank Policy Institute, Financial Services Forum, and Securities Industry and Financial Markets Association sent a letter to President Joe Biden on May 31, urging him to sign the resolution passed by Congress to overturn the SEC’s Staff Accounting Bulletin 121 (SAB 121). The letter outlines that SAB 121, issued without regulatory […]
Bitcoin News
XRP Price Grinds Lower: Searching for Support Amid Downtrend
XRP price extended losses below the .5220 support zone. It tested the .5120 support and now attempting another recovery wave toward .550.
- XRP is struggling to start a fresh increase above the .5320 resistance zone.
- The price is now trading below .530 and the 100-hourly Simple Moving Average.
- There is a major bearish trend line forming with resistance near .5230 on the hourly chart of the XRP/USD pair (data source from Kraken).
- The pair could continue to move down if the price stays below .5320.
XRP Price Dips Further
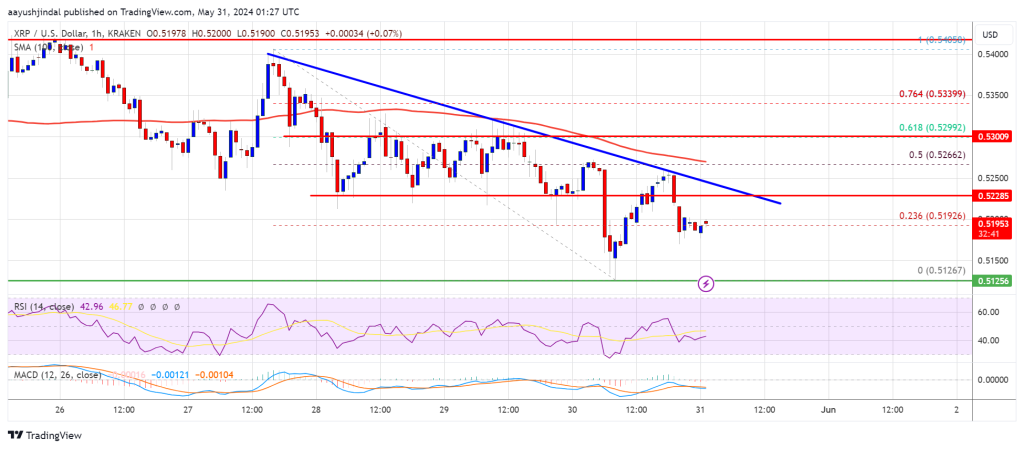
XRP price remained in a short-term bearish zone like Bitcoin and Ethereum. The bears were able to push the price below the key support at .5220. Finally, the price tested the .5120 support zone.
A low was formed at .5126 and the price is now attempting a fresh recovery wave. There was a move above the .5165 level. The price climbed above the 23.6% Fib retracement level of the downward wave from the .5406 swing high to the .5126 low.
However, the price is still trading below .530 and the 100-hourly Simple Moving Average. On the upside, the price is facing resistance near the .5220 level. There is also a major bearish trend line forming with resistance near .5230 on the hourly chart of the XRP/USD pair.
The first key resistance is near .5265 or the 50% Fib retracement level of the downward wave from the .5406 swing high to the .5126 low. A close above the .5265 resistance zone could send the price higher. The next key resistance is near .5320.
If there is a close above the .5320 resistance level, there could be a steady increase toward the .5450 resistance. Any more gains might send the price toward the .5650 resistance.
More Downsides?
If XRP fails to clear the .5220 resistance zone, it could continue to move down. Initial support on the downside is near the .5150 level.
The next major support is at .5120. If there is a downside break and a close below the .5120 level, the price might accelerate lower. In the stated case, the price could decline and retest the .50 support in the near term.
Technical Indicators
Hourly MACD – The MACD for XRP/USD is now losing pace in the bearish zone.
Hourly RSI (Relative Strength Index) – The RSI for XRP/USD is now below the 50 level.
Major Support Levels – .5120 and .500.
Major Resistance Levels – .5220 and .5320.
XRP Price Steadies Above Support: Gearing Up for a Breakout?
XRP price is holding the key support at .5220. The bulls could aim for a fresh increase unless there is a close below the .5220 support.
- XRP is struggling to start a fresh increase above the .5350 resistance zone.
- The price is now trading below .5320 and the 100-hourly Simple Moving Average.
- There is a key bearish trend line forming with resistance near .5280 on the hourly chart of the XRP/USD pair (data source from Kraken).
- The pair could start a fresh increase unless the bears push the price below .5220.
XRP Price Holds Support
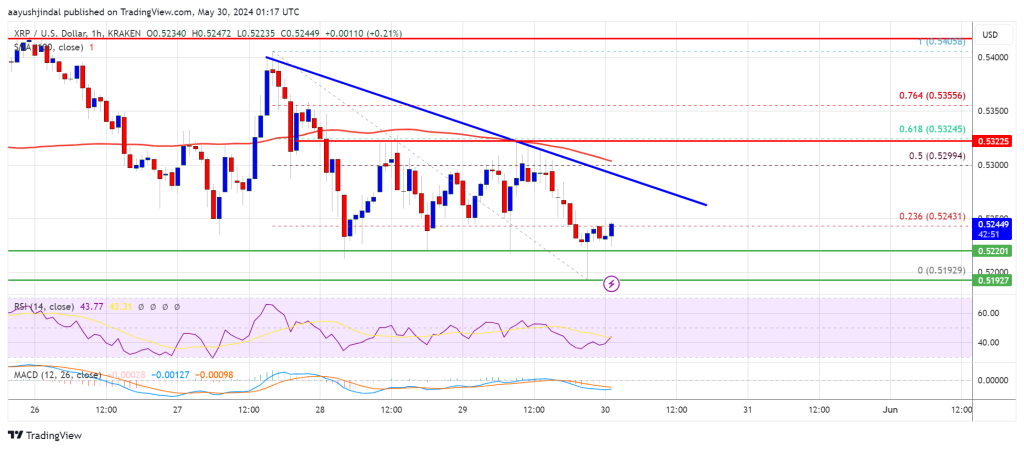
XRP price again saw a bearish move and retested the .5220 support zone like Bitcoin and Ethereum. There was also a spike below the .5220 support zone, but the bulls were active.
A low was formed at .5192 and the price is back above .5220. The price is now trading near the 23.6% Fib retracement level of the downward wave from the .5405 swing high to the .5192 low. It is now trading below .5320 and the 100-hourly Simple Moving Average.
On the upside, the price is facing resistance near the .5280 level. There is also a key bearish trend line forming with resistance near .5280 on the hourly chart of the XRP/USD pair.
The first key resistance is near .5300 or the 61.8% Fib retracement level of the downward wave from the .5405 swing high to the .5192 low. A close above the .5300 resistance zone could send the price higher. The next key resistance is near .540.
If there is a close above the .540 resistance level, there could be a steady increase toward the .5450 resistance. Any more gains might send the price toward the .5650 resistance.
More Downsides?
If XRP fails to clear the .5280 resistance zone, it could continue to move down. Initial support on the downside is near the .5220 level.
The next major support is at .5120. If there is a downside break and a close below the .5120 level, the price might accelerate lower. In the stated case, the price could decline and retest the .50 support in the near term.
Technical Indicators
Hourly MACD – The MACD for XRP/USD is now losing pace in the bearish zone.
Hourly RSI (Relative Strength Index) – The RSI for XRP/USD is now below the 50 level.
Major Support Levels – .5220 and .5120.
Major Resistance Levels – .5280 and .5300.
XRP Price at Risk: Will It Sink or Swim at Key Support Levels?
XRP price is moving lower below .5350 support zone. It is now testing key support at .5220 and remains at risk of more downsides.
- XRP is struggling to gain bullish momentum above the .5350 resistance zone.
- The price is now trading below .530 and the 100-hourly Simple Moving Average.
- There is a connecting bearish trend line forming with resistance near .5265 on the hourly chart of the XRP/USD pair (data source from Kraken).
- The pair could start a fresh increase unless the bears push the price below .5220.
XRP Price Revisits Support
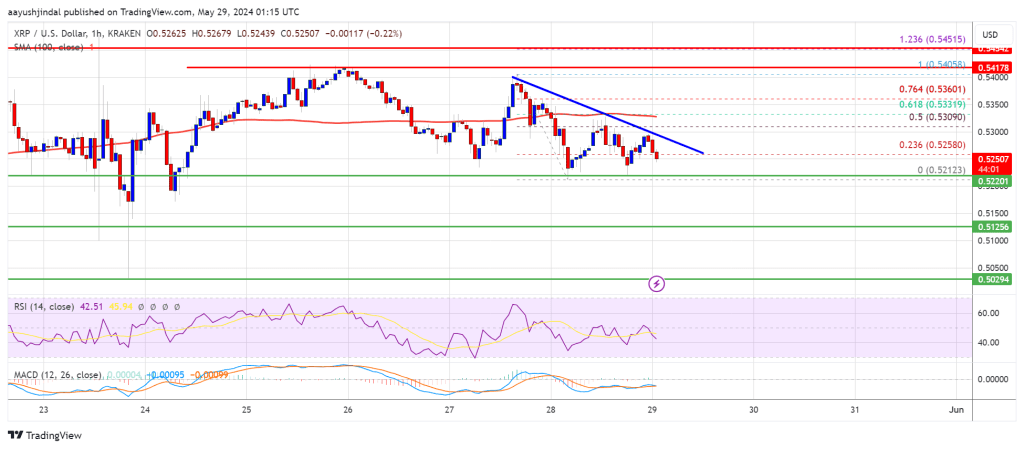
In the past two sessions, XRP price saw a bearish move below the .5320 zone like Bitcoin and Ethereum. The price declined below the .5250 support zone before the bulls emerged.
A low was formed at .5212 and the price is now consolidating losses. It made a recovery attempt above the 23.6% Fib retracement level of the downward move from the .5405 swing high to the .5212 low. However, the bears are active near the .5300 zone.
There is also a connecting bearish trend line forming with resistance near .5265 on the hourly chart of the XRP/USD pair. The price is now trading below .530 and the 100-hourly Simple Moving Average.
Immediate resistance is near the .5265 level. The first key resistance is near .5320 or the 61.8% Fib retracement level of the downward move from the .5405 swing high to the .5212 low. A close above the .5320 resistance zone could send the price higher. The next key resistance is near .540.
If there is a close above the .540 resistance level, there could be a steady increase toward the .5450 resistance. Any more gains might send the price toward the .5650 resistance.
More Downsides?
If XRP fails to clear the .5320 resistance zone, it could continue to move down. Initial support on the downside is near the .5220 level.
The next major support is at .5120. If there is a downside break and a close below the .5120 level, the price might gain bearish momentum. In the stated case, the price could decline and retest the .50 support in the near term.
Technical Indicators
Hourly MACD – The MACD for XRP/USD is now gaining pace in the bearish zone.
Hourly RSI (Relative Strength Index) – The RSI for XRP/USD is now below the 50 level.
Major Support Levels – .5220 and .5120.
Major Resistance Levels – .530 and .5320.
Can Ethereum Price Maintain This Support and Spark a New Increase?
Ethereum price started a downside correction below the ,880 support. ETH is now testing the ,760 support and might aim for a fresh increase.
- Ethereum started another downside correction below the ,880 zone.
- The price is trading above ,750 and the 100-hourly Simple Moving Average.
- There is a connecting bearish trend line forming with resistance at ,880 on the hourly chart of ETH/USD (data feed via Kraken).
- The pair could restart its increase unless there is a move below the ,760 support.
Ethereum Price Dips To Support
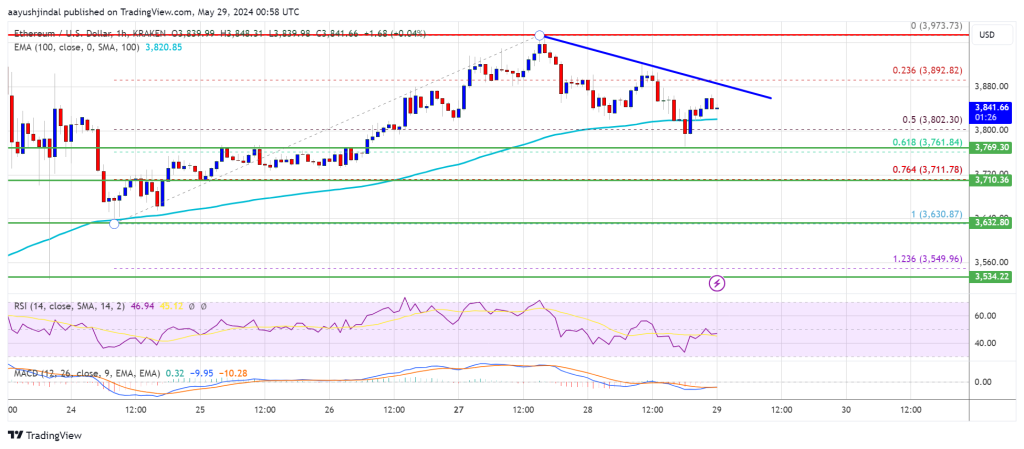
Ethereum price failed to test the ,000 resistance zone and started a downside correction, like Bitcoin. ETH dipped below the ,920 and ,880 support levels.
There was also a spike below the 50% Fib retracement level of the upward move from the ,631 swing low to the ,972 high. Finally, the price dipped below the ,800 level. However, the bulls were active near the ,760 support zone.
The price stayed above the 61.8% Fib retracement level of the upward move from the ,631 swing low to the ,972 high. Ethereum price is now trading above ,750 and the 100-hourly Simple Moving Average.
Immediate resistance is near the ,880 level. There is also a connecting bearish trend line forming with resistance at ,880 on the hourly chart of ETH/USD. The first major resistance is near the ,920 level. An upside break above the ,920 resistance might send the price higher.
The next key resistance sits at ,950, above which the price might gain traction and rise toward the ,000 level. If there is a clear move above the ,000 level, the price might rise and test the ,080 resistance. Any more gains could send Ether toward the ,150 resistance zone.
More Losses In ETH?
If Ethereum fails to clear the ,880 resistance, it could continue to move down. Initial support on the downside is near the ,800 level.
The next major support is near the ,760 zone. A clear move below the ,760 support might push the price toward ,720. Any more losses might send the price toward the ,630 level in the near term.
Technical Indicators
Hourly MACD – The MACD for ETH/USD is losing momentum in the bearish zone.
Hourly RSI – The RSI for ETH/USD is now below the 50 zone.
Major Support Level – ,760
Major Resistance Level – ,880
ETH/BTC Bounces From A 7-Year Support Trend Line: Ethereum To $4,900?
After a crucial week for Ethereum, a technical candlestick arrangement shows that ETH prices could prepare for a sharp upturn in the coming weeks and months.
Pointing out events in the monthly chart, one analyst notes that the ETH/BTC ratio reverses from a multi-year support trend line. Usually, the analyst continued, when prices bounce from this line, altcoin prices tend to react, trending higher.
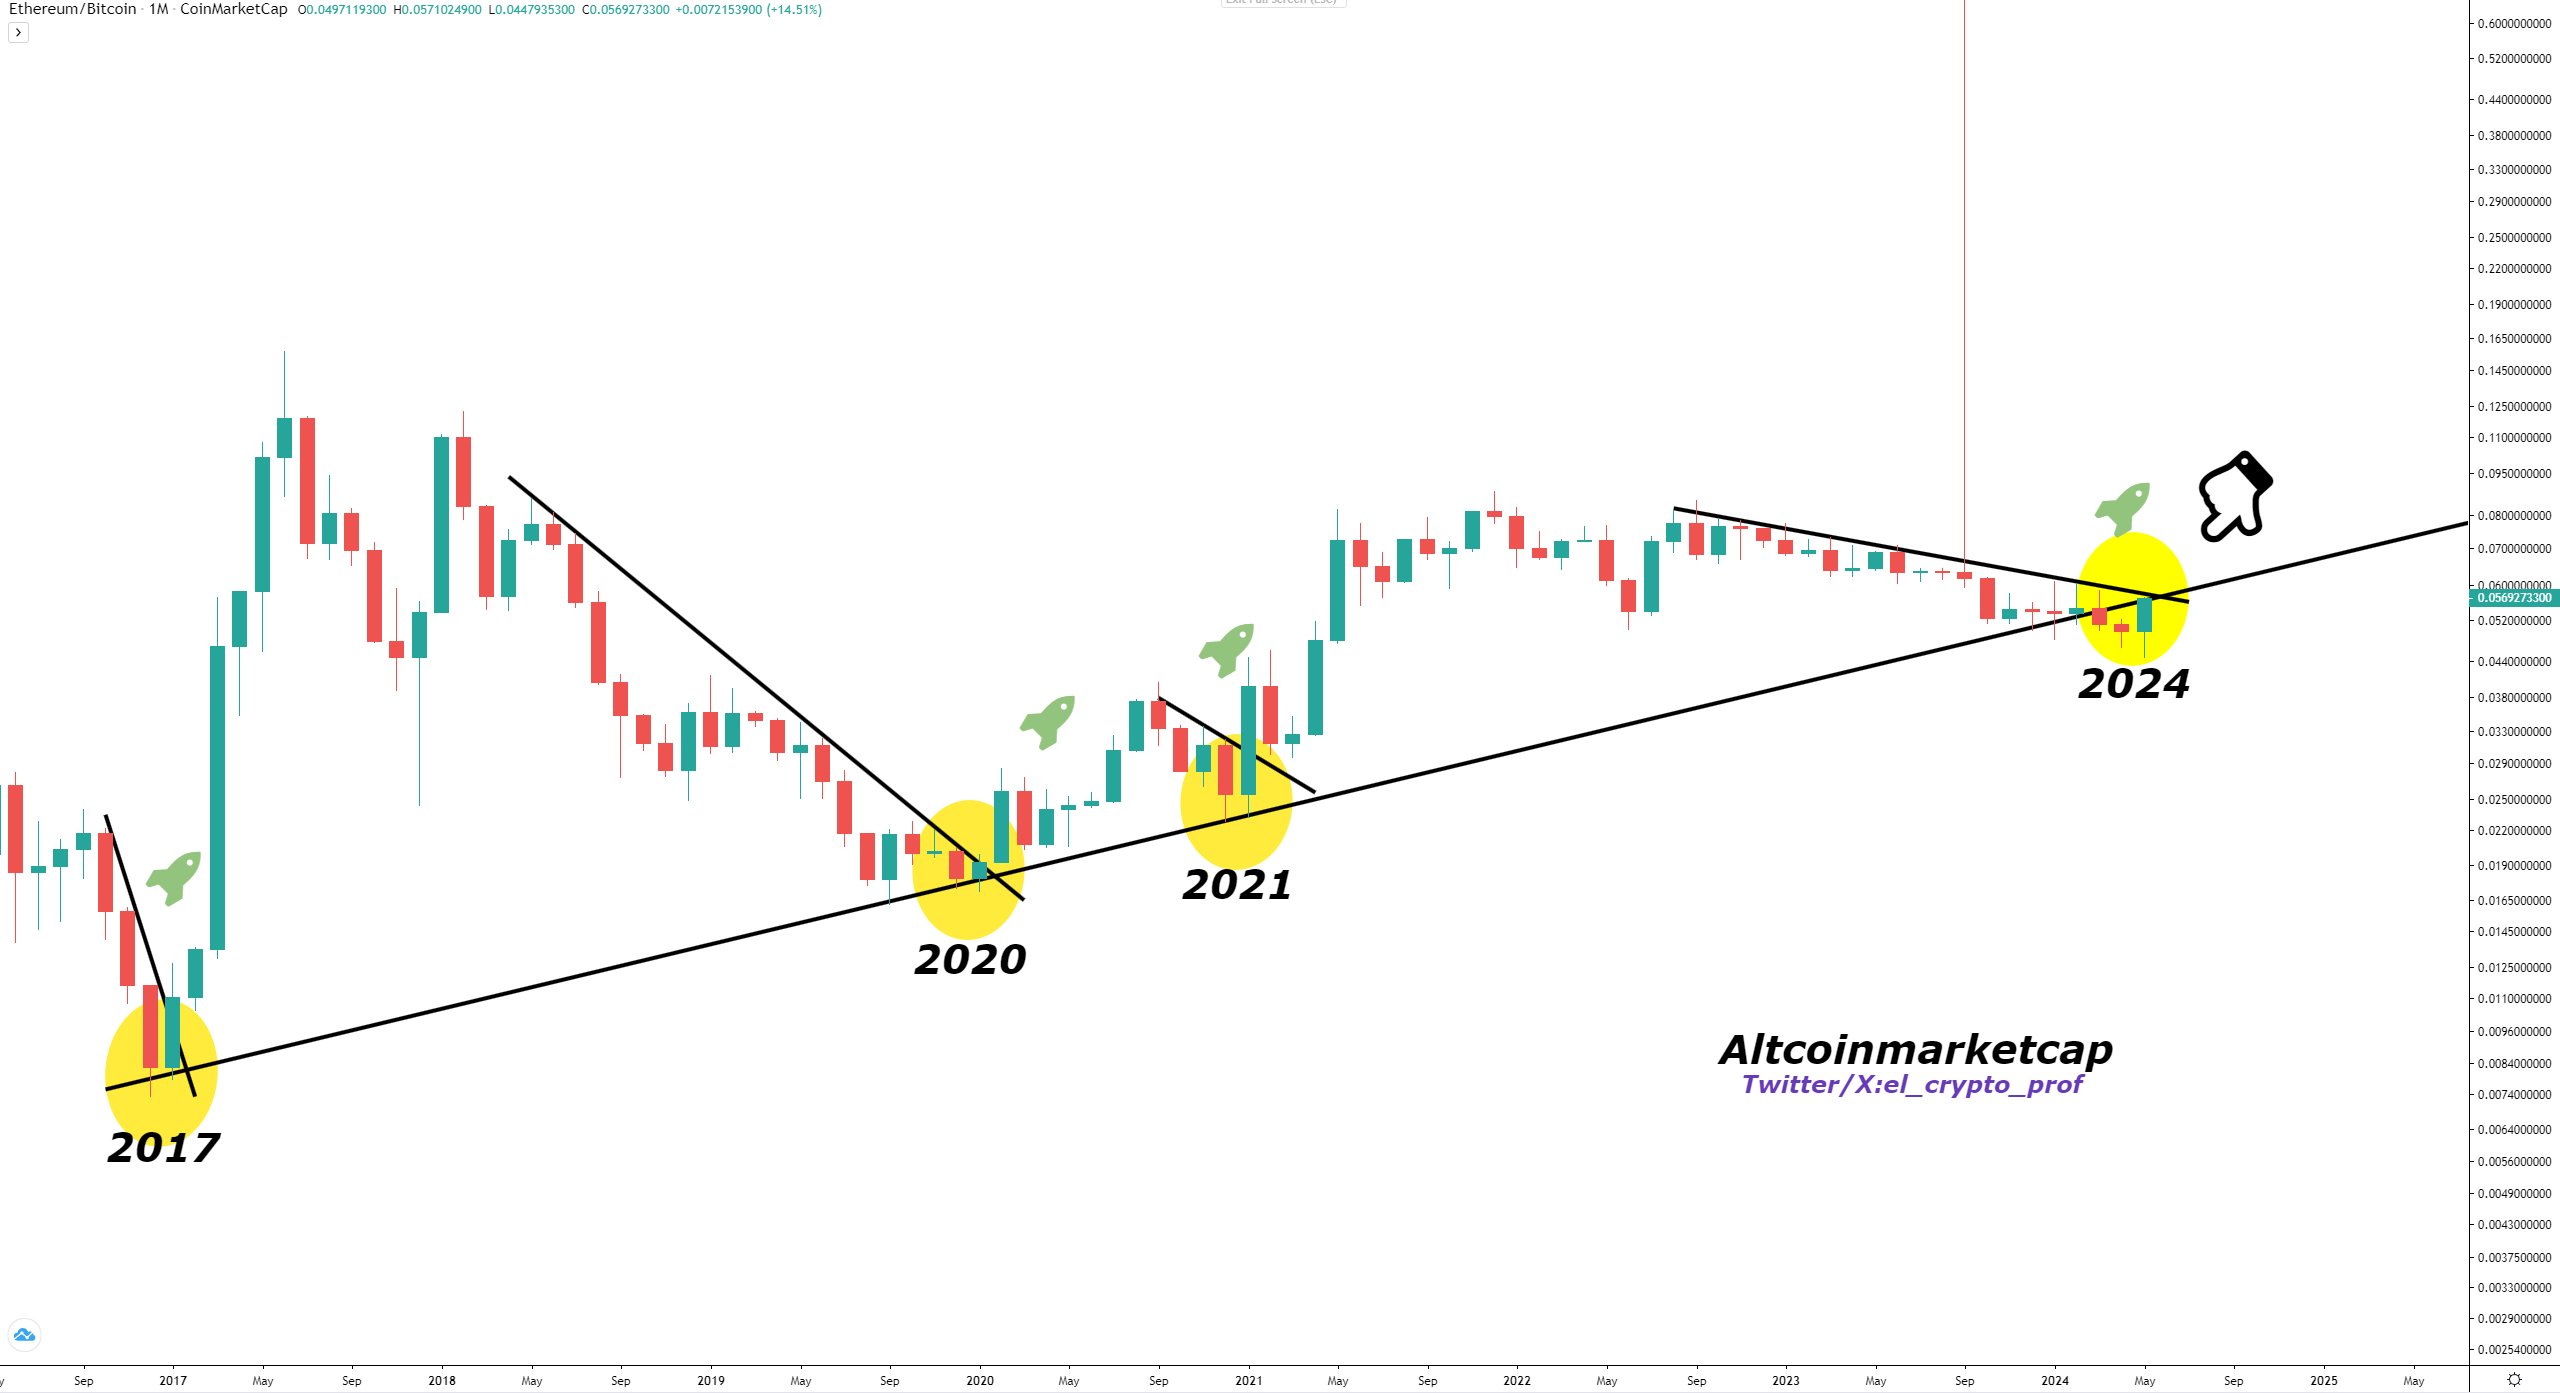
ETH/BTC Rising From Crucial Support Trend Line
The ETH/BTC is a ratio closely monitored by technical analysts. It compares the performance of the world’s first and second most valuable coins.
Although Bitcoin has been firm for the better part of the last two years, the monthly chart clearly shows a descending channel, indicating an upward trend.
So far, there have been a series of higher lows. This suggests that bulls have been soaking in selling pressure over the years, keeping prices higher.
Looking at the monthly chart, this month’s bar will close firmly as bullish. This will result in a double-bar bullish reversal pattern that may ignite demand.
This will subsequently help pump ETH prices even higher. Even so, the relatively lower trading volume, lower than those seen in July 2022, suggests that participation is not at historically high levels.
A bullish bar in June confirming this month’s gain could be the base of another leg up. If this happens, it will mirror those of January 2021. Another 40% gain versus Bitcoin could see ETH close above 0.08 BTC, propelling the coin closely toward 2017 highs.
Overall, Bitcoin has been firm. From September 2022, BTC has been outperforming ETH, erasing gains from 2020 and 2021. The result was a descending channel, though this phase of lower lows also had relatively low participation levels.
Technically, based on a volume analysis, this is bullish for ETH. Even so, a close above 0.08 BTC would be a strong testament from the bulls. It could potentially set a foundation to cement ETH, further narrowing BTC’s dominance.
Spot Ethereum ETFs To Drive Demand: Path To ,900?
Over the years since launching and the final approval of spot Bitcoin exchange-traded funds (ETFs) in January, the digital asset was the only one recognized by the United States Securities and Exchange Commission (SEC).
Because of this advantage, the approval of the derivative product has seen BTC become an institution’s go-to asset. Wall Street players like Fidelity and BlackRock have been enabling exposure to BTC via spot ETFs over the past four months, resulting in billions being poured into the asset.
However, this changed last week when the United States SEC approved listing all spot Ethereum ETFs. ETH staking was removed from amended 19b-4 files.
Still, the fact that Ethereum is almost being clarified represents a massive boost for the network and the platform. ETH prices shot by as much as 30% in response, outperforming Bitcoin.
It is highly likely that ETH prices will continue rising in the coming weeks. Though it remains to be seen how the reception will be, especially among investors, the coin, like BTC prices post mid-January 2024, will rally, perhaps breaking ,100 and even all-time highs of 2021.
Apu Memecoin Soars, Reaching 11,600 Token Holders with Strong Community Support
 PRESS RELEASE. Apu Apustaja, a new memecoin making waves in the industry, has announced impressive support from its rapidly growing community, including over 11,650 coin holders and more than 13,000 Telegram channel members. Leading a revolution in the sector, which sees frog memecoins replacing dog-themed coins. Behind its sudden surge in popularity are a highly […]
Bitcoin News
FTM’s Key Support At Risk As Fantom Launches Sonic Foundation And Wraps $10M Funding
The Fantom Foundation has recently disclosed its plans to establish the Sonic Foundation and Sonic Labs in preparation for the launch of its Sonic blockchain.
In an announcement on Thursday, the foundation expressed its commitment to leveraging its technology and revealed additional details about the upcoming developments.
Fantom Introduces Sonic Chain
According to the foundation’s blog post, with the completion of the upgrade for their Opera chain on the horizon, Fantom is directing its focus towards creating a new “high-throughput” chain called Sonic (S).
The introduction of the Sonic network will coincide with the establishment of the Sonic Foundation, which will assume responsibility for governance and treasury management functions. Additionally, Sonic Labs will spearhead the growth of decentralized applications (dApps), partnerships, and user engagement.
Developed under the guidance of Professor Bernhard Scholz, a virtual machine developer, and led by decentralized finance (DeFi) expert Andre Cronje, the Sonic chain represents a new type of Layer-1 platform with a native Layer-2 bridge connected to the Ethereum (ETH) network.
The Sonic chain is reportedly designed to serve as a Layer 1 solution connected to Ethereum via a Layer 2 bridge. This integration is intended to allow Sonic to leverage Ethereum’s liquidity, user base, and protocols.
As a result, the network will combine the benefits of a Layer-1 platform, such as affordability, scalability, and speed, with the security of a Layer-2 bridge, providing access to native ETH and other assets on Ethereum.
Million Raised In Strategic Funding Round
Regarding the “S” token, a recent governance vote has secured compatibility and migration between the decentralized platform’s native token FTM and S on a 1:1 basis.
Fantom also announced the successful completion of a million strategic funding round led by Hashed, one of Korea’s cryptocurrency funds. This funding initiative for the foundation is expected to expand further in the coming months.
In addition to Hashed, UOB Ventures, Signum Capital, and Aave (AVE) Foundation, along with angel investors Stani Kulechov, Robert Leshner, Michael Egorov, Fernando Martinelli, Tarun Chitra, and Sam Kazemian, and individual partners from UOB, have all provided support during the funding round.
The capital raised in the latest round of funding will be used exclusively to support strategic growth initiatives and ecosystem development within the Fantom network, according to the foundation’s statement, which concluded by saying:
Our team is steadfast in exploring how the Sonic chain can impact and elevate several different DeFi and real-world use cases. Industries and applications such as real-world assets, perpetual DEXs, payments, trading, and high-transaction-based games, can be transformed by the speed and high throughput of Sonic.
FTM Faces Potential Downtrend Continuation
Despite these developments, the FTM token has exhibited a lackluster response to the successful funding round and the potential benefits of the Sonic chain.
As a result, the token has declined by over 4% within a 24-hour period, putting a significant level of support for the native token at risk.
Currently trading at .8033, the FTM token’s immediate prospects hinge on the crucial .7994 support level. A breach of this support could lead to further price declines, with the next major support at .755.
On the other hand, if renewed bullish momentum and increased buying pressure emerge, the token may encounter resistance at the .844 and .8750 levels before potentially retesting the key .9 zone. Reclaiming the milestone remains pivotal for the token’s overall outlook.
Featured image from Shutterstock, chart from TradingView.com
Metamask Aims to Add Bitcoin Support: A New Chapter for the Popular Ethereum Wallet
 Metamask, the popular ethereum wallet, is reportedly planning to add support for bitcoin (BTC) in the next month or so, according to sources cited by Coindesk. While details are scarce, the integration could initially begin with basic features and expand over time. This move would significantly expand Metamask’s reach beyond the Ethereum ecosystem, which it […]
Bitcoin News
Bitcoin Price Hits Crucial Support: Will Bulls Ignite a Fresh Increase?
Bitcoin price started a downside correction below the ,000 level. BTC is now testing the ,800 support and might attempt a fresh increase.
- Bitcoin extended its decline below the ,000 support zone.
- The price is trading above ,000 and the 100 hourly Simple moving average.
- There is a connecting bearish trend line forming with resistance at ,000 on the hourly chart of the BTC/USD pair (data feed from Kraken).
- The pair could start another increase unless there is a close below ,800.
Bitcoin Price Revisits Support
Bitcoin price started a downside correction after it struggled above the ,500 level. A new weekly high was formed at ,896 and the price recently started a downside correction.
The price declined below the ,000 level and tested the 50% Fib retracement level of the upward wave from the ,046 swing low to the ,896 high. There was also a spike below the ,800 support zone. The bulls are currently active near the ,800 zone.
Bitcoin price is now trading above ,000 and the 100 hourly Simple moving average. The price is now facing resistance near the ,650 level. The first major resistance could be ,000. There is also a connecting bearish trend line forming with resistance at ,000 on the hourly chart of the BTC/USD pair.
The next key resistance could be ,500. A clear move above the ,500 resistance might send the price higher. In the stated case, the price could rise and test the ,200 resistance.
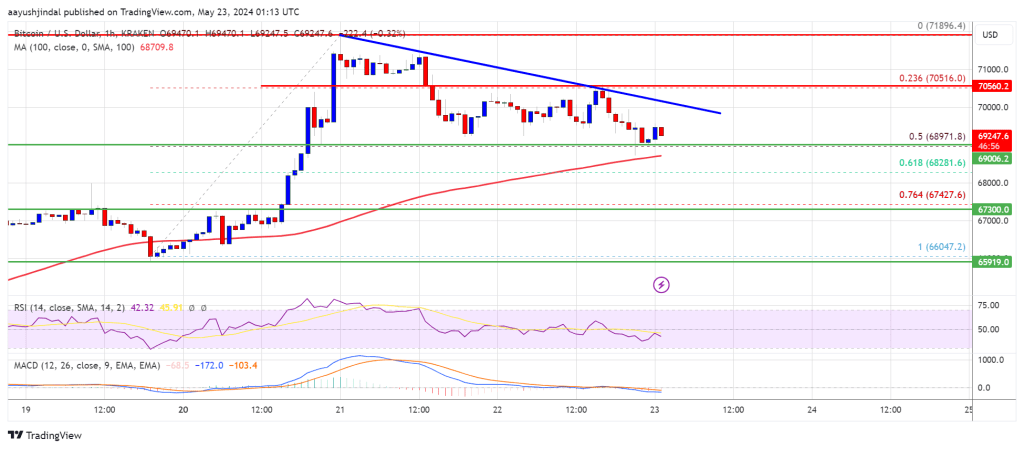
If the bulls push the price further higher, there could be a move toward the ,800 resistance zone. Any more gains might send BTC toward the ,500 resistance.
Downside Break In BTC?
If Bitcoin fails to climb above the ,000 resistance zone, it could continue to move down. Immediate support on the downside is near the ,000 level.
The first major support is ,800. The next support is now forming near ,420 or the 76.4% Fib retracement level of the upward wave from the ,046 swing low to the ,896 high. Any more losses might send the price toward the ,000 support zone in the near term.
Technical indicators:
Hourly MACD – The MACD is now losing pace in the bearish zone.
Hourly RSI (Relative Strength Index) – The RSI for BTC/USD is now below the 50 level.
Major Support Levels – ,000, followed by ,800.
Major Resistance Levels – ,000, ,500, and ,200.