 On Wednesday, the U.S. Department of Justice from the Southern District of New York brought charges against the creators of Samourai Wallet for running an unlicensed money transmission service and for engaging in money laundering activities. This development has left the cryptocurrency community in dismay, with many expressing their displeasure over the aggressive measures employed […]
Bitcoin News
Ethereum On-Chain Health Holds Strong Amidst Open Interest Plunge – Impact On Price
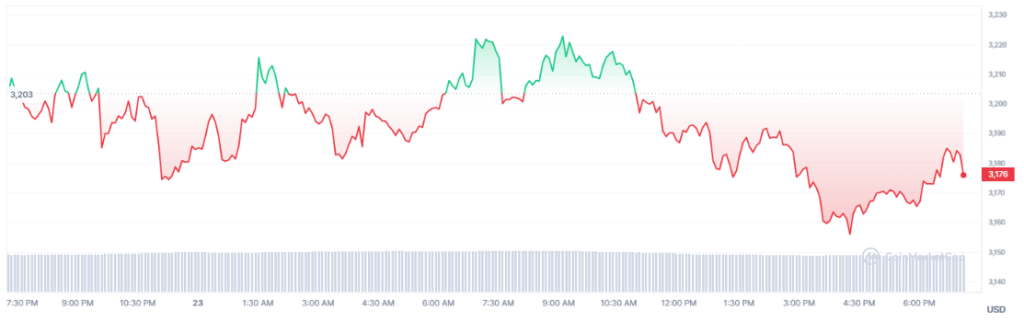
Ethereum (ETH) stands as a bellwether for the industry’s ebbs and flows. As of press time, Ethereum was trading at ,174, its price trying to reach the crucial ,000 mark. However, beneath the surface of these seemingly stable waters lies a complex interplay of market forces and investor sentiment.
Ether’s Challenging Trajectory
Since last week, the lower timeframes have seen repeated breaches of the ,000 psychological threshold, and the enthusiasm surrounding the altcoin king has significantly waned.
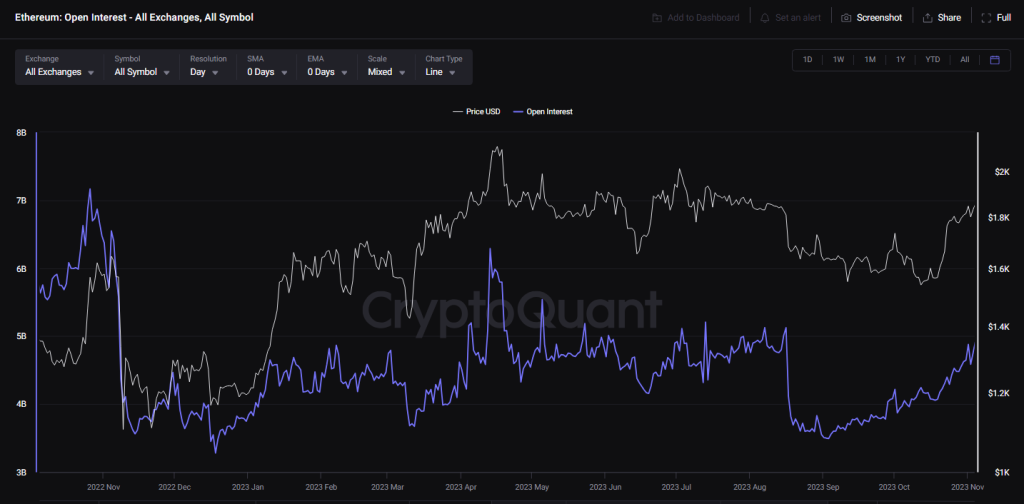
This downward pressure is further underscored by the notable drop in Open Interest (OI) behind ETH futures contracts, which plummeted from billion to billion in April alone.
Such a decline suggests a recalibration in the futures market, potentially signaling a cooling-off period for speculative trading activity.
Navigating Choppy Waters
However, amidst the uncertainty, there exists a glimmer of hope for ETH bulls. Historical precedents, such as the mid-February 2021 correction, offer insight into the resilience of Ethereum’s price.
Following a similar dip from an all-time high of ,900 to ,400, Ethereum experienced a V-shaped reversal, demonstrating the market’s propensity for swift recoveries. This historical context serves as a guiding light for investors navigating the choppy waters of cryptocurrency volatility.
On the social sentiment front, Ethereum’s trajectory has been a tale of two halves. While sentiment was strongly positive in February and briefly in mid-March, a negative sentiment has dominated as prices entered a correction phase. Factors such as high gas fees on the Ethereum network have likely contributed to this shift, highlighting the impact of practical considerations on market sentiment.
Ethereum: Fundamental Metrics
Examining Ethereum’s fundamental metrics provides further insights into its current state. Network growth has slowed in recent months, signaling a potential decline in demand. However, a closer look reveals a silver lining: the 90-day mean coin age has trended steadily higher since late March, indicating a network-wide accumulation of ETH.
As Ethereum continues to navigate these turbulent waters, all eyes are on key resistance levels. Breaking above the ,300 barrier could instill confidence among traders and investors, potentially heralding a new wave of bullish momentum. However, uncertainties loom large, particularly in light of the broader market dynamics and the selling pressure on Bitcoin, Ethereum’s perennial counterpart.
While challenges abound and uncertainties persist, Ethereum’s historical performance and fundamental strengths offer hope for a brighter future. As investors brace for potential headwinds and opportunities alike, Ethereum stands poised to weather the storm and emerge stronger on the other side.
Featured image from Pexels, chart from TradingView
Ethereum Price Holds Strong At $3K But Can Bulls Clear This Hurdle?
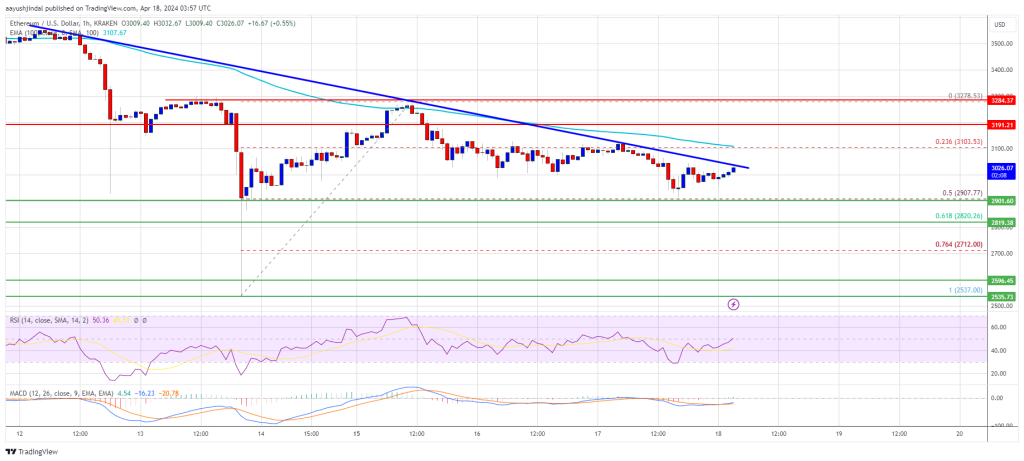
Ethereum price is consolidating near the ,000 zone. ETH could start a decent recovery wave if it clears the ,100 and ,200 resistance levels.
- Ethereum is struggling to recover above the ,100 resistance zone.
- The price is trading below ,120 and the 100-hourly Simple Moving Average.
- There is a major bearish trend line forming with resistance at ,035 on the hourly chart of ETH/USD (data feed via Kraken).
- The pair could start another decline if it stays below the ,100 resistance zone.
Ethereum Price Holds Ground
Ethereum price slowly moved lower after it failed to clear the ,200 resistance zone. ETH remained in a bearish zone below ,100 and showed bearish signs, like Bitcoin.
Recently, the bears were able to push the price below the ,000 support zone. However, the bulls were active near the 50% Fib retracement level of the upward wave from the ,535 swing low to the ,279 high. Ethereum is now trading below ,120 and the 100-hourly Simple Moving Average.
Immediate resistance is near the ,030 level. There is also a major bearish trend line forming with resistance at ,035 on the hourly chart of ETH/USD. The first major resistance is near the ,100 level and the 100-hourly Simple Moving Average.
Source: ETHUSD on TradingView.com
The next key resistance sits at ,200, above which the price might rise toward the ,280 level. A close above the ,280 resistance could send the price toward the ,500 pivot level. If there is a move above the ,500 resistance, Ethereum could even climb toward the ,650 resistance in the coming sessions.
More Losses In ETH?
If Ethereum fails to clear the ,100 resistance, it could start another decline. Initial support on the downside is near the ,000 level. The first major support is near the ,900 zone.
The next key support could be the ,820 zone or the 61.8% Fib retracement level of the upward wave from the ,535 swing low to the ,279 high. A clear move below the ,820 support might send the price toward ,600. Any more losses might send the price toward the ,550 level in the near term.
Technical Indicators
Hourly MACD – The MACD for ETH/USD is gaining momentum in the bearish zone.
Hourly RSI – The RSI for ETH/USD is now below the 50 level.
Major Support Level – ,900
Major Resistance Level – ,100
B2Prime’s Q1 Fiscal 2024 Results Highlight Strong Growth and Regulatory Compliance
 PRESS RELEASE. B2Prime, a renowned multi-asset Prime of Prime liquidity provider, disclosed financial results of its Parent Company B2B Prime Services EU for January and February 2024. The report aims to highlight the company’s dedication to transparency, regulatory compliance, and market leadership. Regulated by the Cyprus Securities and Exchange Commission (CySEC) and the Financial Services […]
Bitcoin News
Bitcoin Technical Analysis: Upper Resistance Holds Strong Amidst Consolidation Phase
 As bitcoin flirts with the ,556 mark, its oscillation between ,900 and ,391 within the last 24 hours suggests a battleground for bulls and bears alike. Amidst a trading volume of .37 billion, the cryptocurrency giant showcases a current market capitalization of .36 trillion. Bitcoin Bitcoin’s current trading landscape, through the lens of oscillators and […]
Bitcoin News
Chainlink Facing Strong Rejection From Profit-Taking, Will CCIP Recharge Demand?
One analyst on X notes that Chainlink is facing a tug-of-war between bullish momentum and strong upside resistance from profit-taking traders. For bulls to add to their longs and extend the uptrend, the existing oversupply must be moped, paving the way for more gains above immediate liquidation levels.
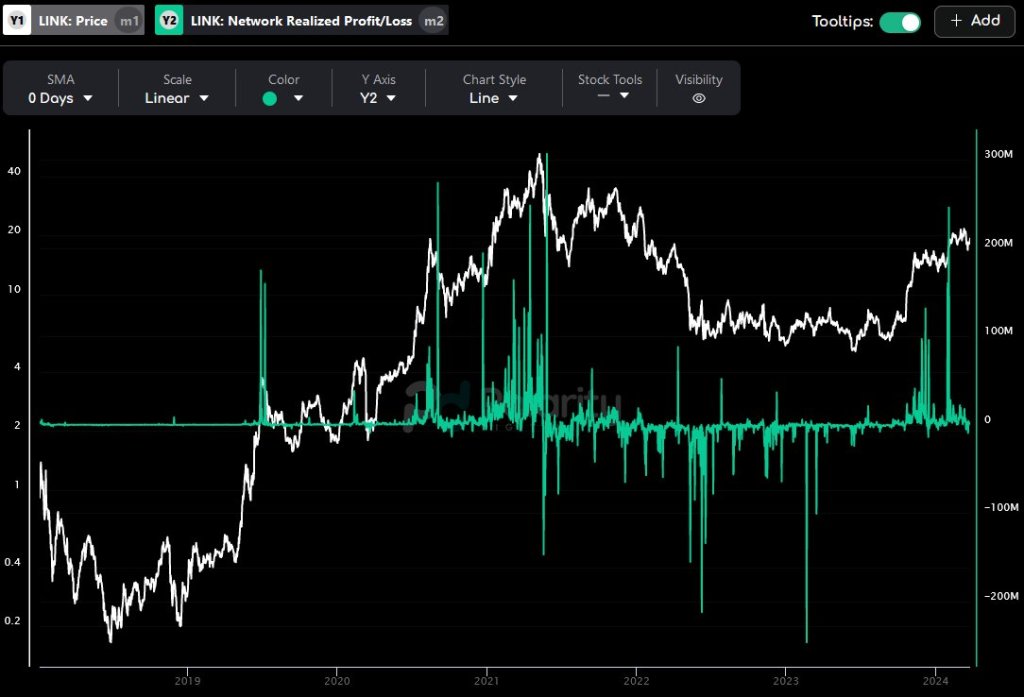
Profit Taking Slowing Down LINK Bulls
Looking at the LINK price action in the daily chart, it is clear that buyers have the upper hand. Bulls have been relentless since the token bottomed out in September 2023.
Since then, LINK has doubled, even breaking above the psychological round number at . At press time, buyers are still in control, snapping back to trend despite the market-wide cool-off after Bitcoin crashed last week.
LINK is within a broader range, with clear caps at around .9 on the lower end and .7 on the upper end. After protracted expansion from September, the emergence of a ranging market could suggest that traders are exiting their positions, slowing down the uptrend.
This has been confirmed by on-chain data that the analyst tagged, explaining the recent slowdown. Indeed, on-chain data suggests investors have been cashing in on the recent expansion.
As a result, the excess supply needs to be absorbed by the market before LINK Bulls builds enough momentum to drive the coin to new 2024 highs above .8.
Chainlink CCIP Adoption To Recharge Demand?
Despite the short-term headwinds, Chainlink bulls are banking on the widespread adoption of the Chainlink Cross-Chain Interoperability Protocol (CCIP) as a demand catalyst. CCIP is critical for blockchain interoperability. The solution allows secure communication between smart contracts of linked blockchains and external data sources.
CCIP has been adopted by, among others, Metis, a layer-2 scaling solution for Ethereum. Circle, the issuer of USDC, a stablecoin, is also leveraging the platform to enhance interoperability.
Recent data shows a surge in CCIP revenue, pointing towards increased adoption of this multichain bridging platform. As of March 26, Dune Analytics data shows that the CCIP has generated over 4,000 in revenue. This figure will likely increase as CCIP finds adoption and Chainlink integrates with even more protocols, businesses, and blockchains.

Still, the pace at which LINK breaks above March highs and registers fresh 2024 highs will also demand the performance of other coins, including Bitcoin and Ethereum. A resurgent BTC could draw more capital, lifting altcoins, including LINK, in the process.
Weekly Crypto Gainers: ONDO Tops the Chart, With ICP and XEC Making Strong Showings
 Bitcoin and ethereum have recaptured some of their losses from the previous week, but a group of crypto assets have seen their values climb by double digits in the last seven days. About nine cryptocurrencies experienced increases of 20% or more, with ondo (ONDO) leading the charge with a 94% leap this week. The Week’s […]
Bitcoin News
Analysts See Gold Reaching $2,600 per Ounce Amid Strong Market Demand
 While bitcoin experienced a 12% decrease following its all-time high last week, gold has shown relative stability over the past five days, with only a slight 1% decline in the same period. In a similar vein to crypto enthusiasts, advocates for gold predict that the metal will continue its upward trajectory, potentially reaching the ,600 […]
Bitcoin News
Bitcoin Technical Analysis: Oscillators and Averages Signal Strong Upward Momentum
 Bitcoin’s price on Monday, March 11, 2024, shows a bullish trend is undeniably in the air. The day unfurled with bitcoin dancing between ,785 and ,837, revealing a bullish sentiment amidst traders. This swing is underpinned by a robust market capitalization of .4 trillion, with a notable 24-hour trading volume of .50 billion. Bitcoin Our […]
Bitcoin News
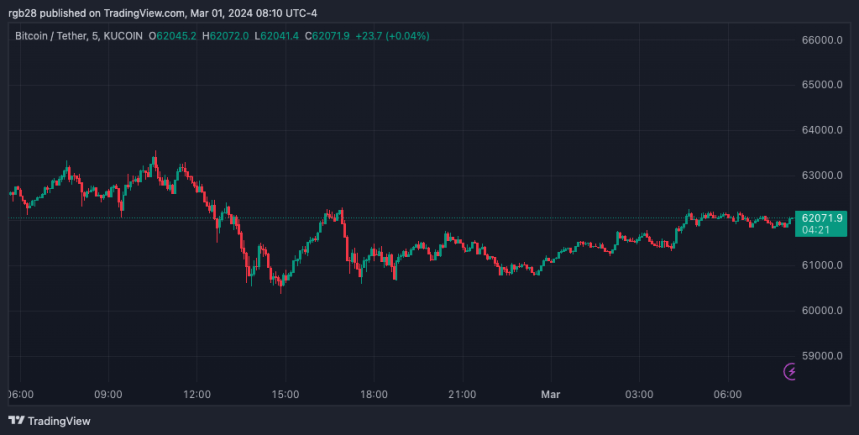
Crypto Market Slowdown Amid Rally? Prices Remain Strong With Bitcoin Above $62K
The crypto market has shown an incredible performance over the past week. Bitcoin has sustained momentum and risen above the ,000 level, reaching ,000.
The levels reached at the end of February have suggested to many investors that March could be an even more impressive month for the current bullish rally.
However, no prediction is set in stone, as many factors could swing investors’ sentiments and move the trends in the opposite direction. At the moment, the crypto market seems to have taken a small pause to catch its breath.
Crypto Market Momentarily Slows Down
The global crypto market reached a significant milestone for this bullish run a few days ago. As reported, the total crypto market cap hit T on February 27, an accomplishment not seen since April 2022.
As March begins, the market cap for the crypto market sits at .3 trillion, representing a 17.97% surge in the 7-day timeframe. This growth has surpassed the level established in early 2022 and potentially clears the path to the .4 trillion mark seen in December 2021.
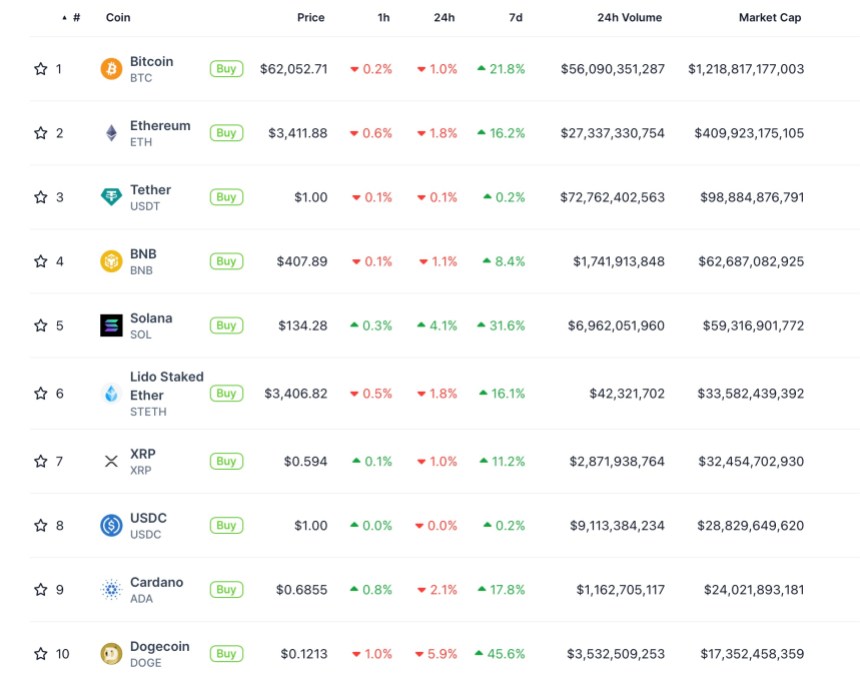
Nonetheless, the market rise seemingly slowed down momentarily. The current market cap of .31 trillion represents a modest 1.32% decrease over the last day, according to CoinMarketCap data.
Similarly, the total crypto market trading volume was around 7.9 billion at writing time, registering a significant 35.77% drop from yesterday.
The data shows that Bitcoin and Ether have faced over 40% market activity decrease compared to the trading volume registered 24 hours ago. Similarly, some of the largest memecoins showed a slowdown in performance.
As the list below shows, Dogecoin (DOGE) registered a 5.9% price drop on the last day. Likewise, Shiba Inu’s (SHIB) price decreased by 5.8% in the same timeframe.
On the contrary, Solana (SOL) performed better on the last day than the top ten cryptocurrencies, registering a 4.1% price surge. SOL’s 4 price places it alongside DOGE as the best-performing cryptocurrencies among the top ten in the last seven.
Among the largest gainers on the last day, PEPE reversed yesterday’s 12% price drop after registering a 10.9% growth during the past 24 hours. Similarly, the dog-themed memecoins dogwifhat (WIF) and (BONK) registered a price increase of 20,66% and 6.65%, respectively.
Bitcoin And Ether Remain Strong Amid The Market Volatility
Some analysts expect a significant halving-related drop in Bitcoin’s price. Meanwhile, the King of crypto has shown strong resistance above a massive support wall, as crypto analyst Ali Martinez suggests.
Over 1 million addresses are buying over 671,000 BTC within the ,000 and ,000 price range. Which, according to the analyst, highlights a strong investor confidence. This confidence could be a crucial support level and a cushion against a future price drop.
#Bitcoin holds above a massive support wall, with 1 million addresses buying over 671,000 $BTC within the price range of ,334 to ,155.
This accumulation zone highlights strong investor confidence and could serve as a crucial level of support for #BTC, potentially… pic.twitter.com/lmghohWR1U
— Ali (@ali_charts) March 1, 2024
At writing time, the flagship cryptocurrency trades at around ,052.71, which only accounts for a 1% decrease from the day before. BTC has increased over 21.8% in the last week, and it’s only 10.34% lower than its all-time high (ATH) of ,000 registered in November 2021.
Likewise, it’s worth noting that Ether (ETH) has been showing a robust performance in the past few days amid the volatile crypto market. Maintaining its price range in the past 24 hours, the ‘king of altcoins’ registered only a 1.8% price decrease from yesterday. ETH currently trades at ,411.88, representing a notable 16.2% rise in the past week.