 U.S. spot bitcoin exchange-traded funds (ETFs) saw another day of inflows on Tuesday, marking the 11th consecutive day of gains. Despite reports suggesting Blackrock’s IBIT holds more bitcoin than Grayscale’s GBTC, IBIT’s official website shows the fund still needs 322.28 BTC to surpass GBTC. While the web portal was updated on May 28, there may […]
Bitcoin News
XRP Price Still at Risk: Will It Face Another Downside Break?
XRP price started another decline after it failed to surpass the .530 resistance. The price is back below .5150 and showing a few bearish signs.
- XRP struggled near .5300 and started a fresh decline.
- The price is now trading below .5150 and the 100-hourly Simple Moving Average.
- There was a break below a key contracting triangle with support at .520 on the hourly chart of the XRP/USD pair (data source from Kraken).
- The pair could gain bearish momentum if there is a close below .500.
XRP Price Turns Red
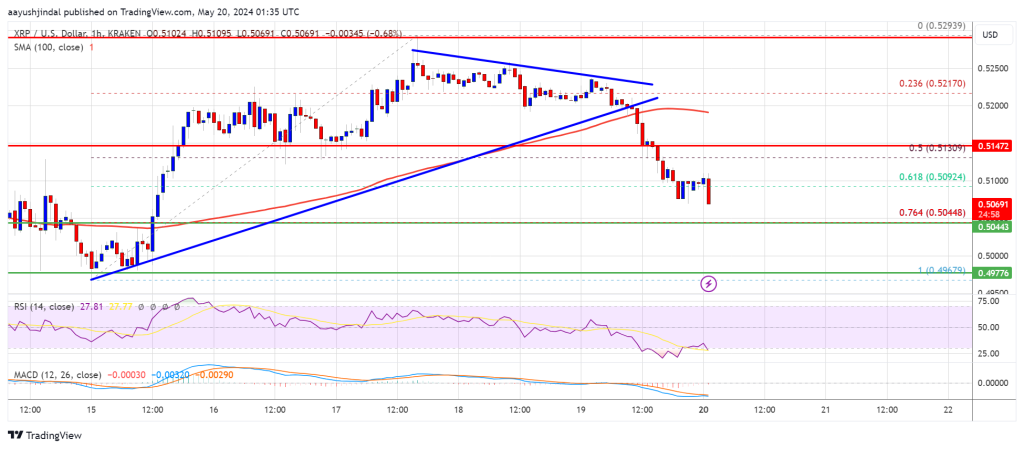
After a steady increase, XRP price faced resistance near the .530 zone. A high was formed at .5293 and the price started a downside correction like Bitcoin and Ethereum. The price declined below the .5220 level.
There was a move below the 50% Fib retracement level of the upward wave from the .4967 swing low to the .5293 high. Besides, there was a break below a key contracting triangle with support at .520 on the hourly chart of the XRP/USD pair.
The price is now trading below .5150 and the 100-hourly Simple Moving Average. Immediate resistance is near the .5150 level. The first key resistance is near .520.
A close above the .520 resistance zone could send the price higher. The next key resistance is near .5220. If the bulls push the price above the .5280 resistance level, there could be a fresh move toward the .5350 resistance. Any more gains might send the price toward the .550 resistance.
More Losses?
If XRP fails to clear the .5150 resistance zone, it could continue to move down. Initial support on the downside is near the .5045 level or the 76.4% Fib retracement level of the upward wave from the .4967 swing low to the .5293 high. The next major support is at .500.
The main support is now near .4965. If there is a downside break and a close below the .4965 level, the price might accelerate lower. In the stated case, the price could drop and test the .4840 support in the near term.
Technical Indicators
Hourly MACD – The MACD for XRP/USD is now gaining pace in the bearish zone.
Hourly RSI (Relative Strength Index) – The RSI for XRP/USD is now below the 50 level.
Major Support Levels – .5040 and .5000.
Major Resistance Levels – .5150 and .5200.
Bitcoin Still Has “A Lot Of Room To Run Before Reversal,” Says Top Analyst
An analyst has explained how the data of an oscillator for Bitcoin could suggest the cryptocurrency still has plenty of room to run in this rally.
Bitcoin VWAP Oscillator Could Imply Potential For Further Upside
In a new post on X, analyst Willy Woo discussed what the latest trend in the Volume-Weighted Average Price (VWAP) Oscillator for BTC might suggest regarding what could be next for the cryptocurrency.
The VWAP is an indicator that calculates the average price for any asset by taking into account the price fluctuations themselves and weighing the values against the trading volume.
This means that the prices of the assets where there was a higher volume of trading have a higher weightage in the average than those with only a low amount of volume.
Traditionally, the VWAP is a technical analysis indicator that considers the information available through spot exchanges. In the context of the current topic, the VWAP uses the on-chain volume of Bitcoin instead, which is readily viewable by anyone thanks to the blockchain’s transparency.
The indicator of interest here isn’t the VWAP but rather the VWAP Oscillator, as mentioned earlier. This metric keeps track of the ratio between the BTC spot price and the VWAP and presents it as an oscillator of around zero.
The chart below shows the trend of this Bitcoin indicator over the past couple of years.
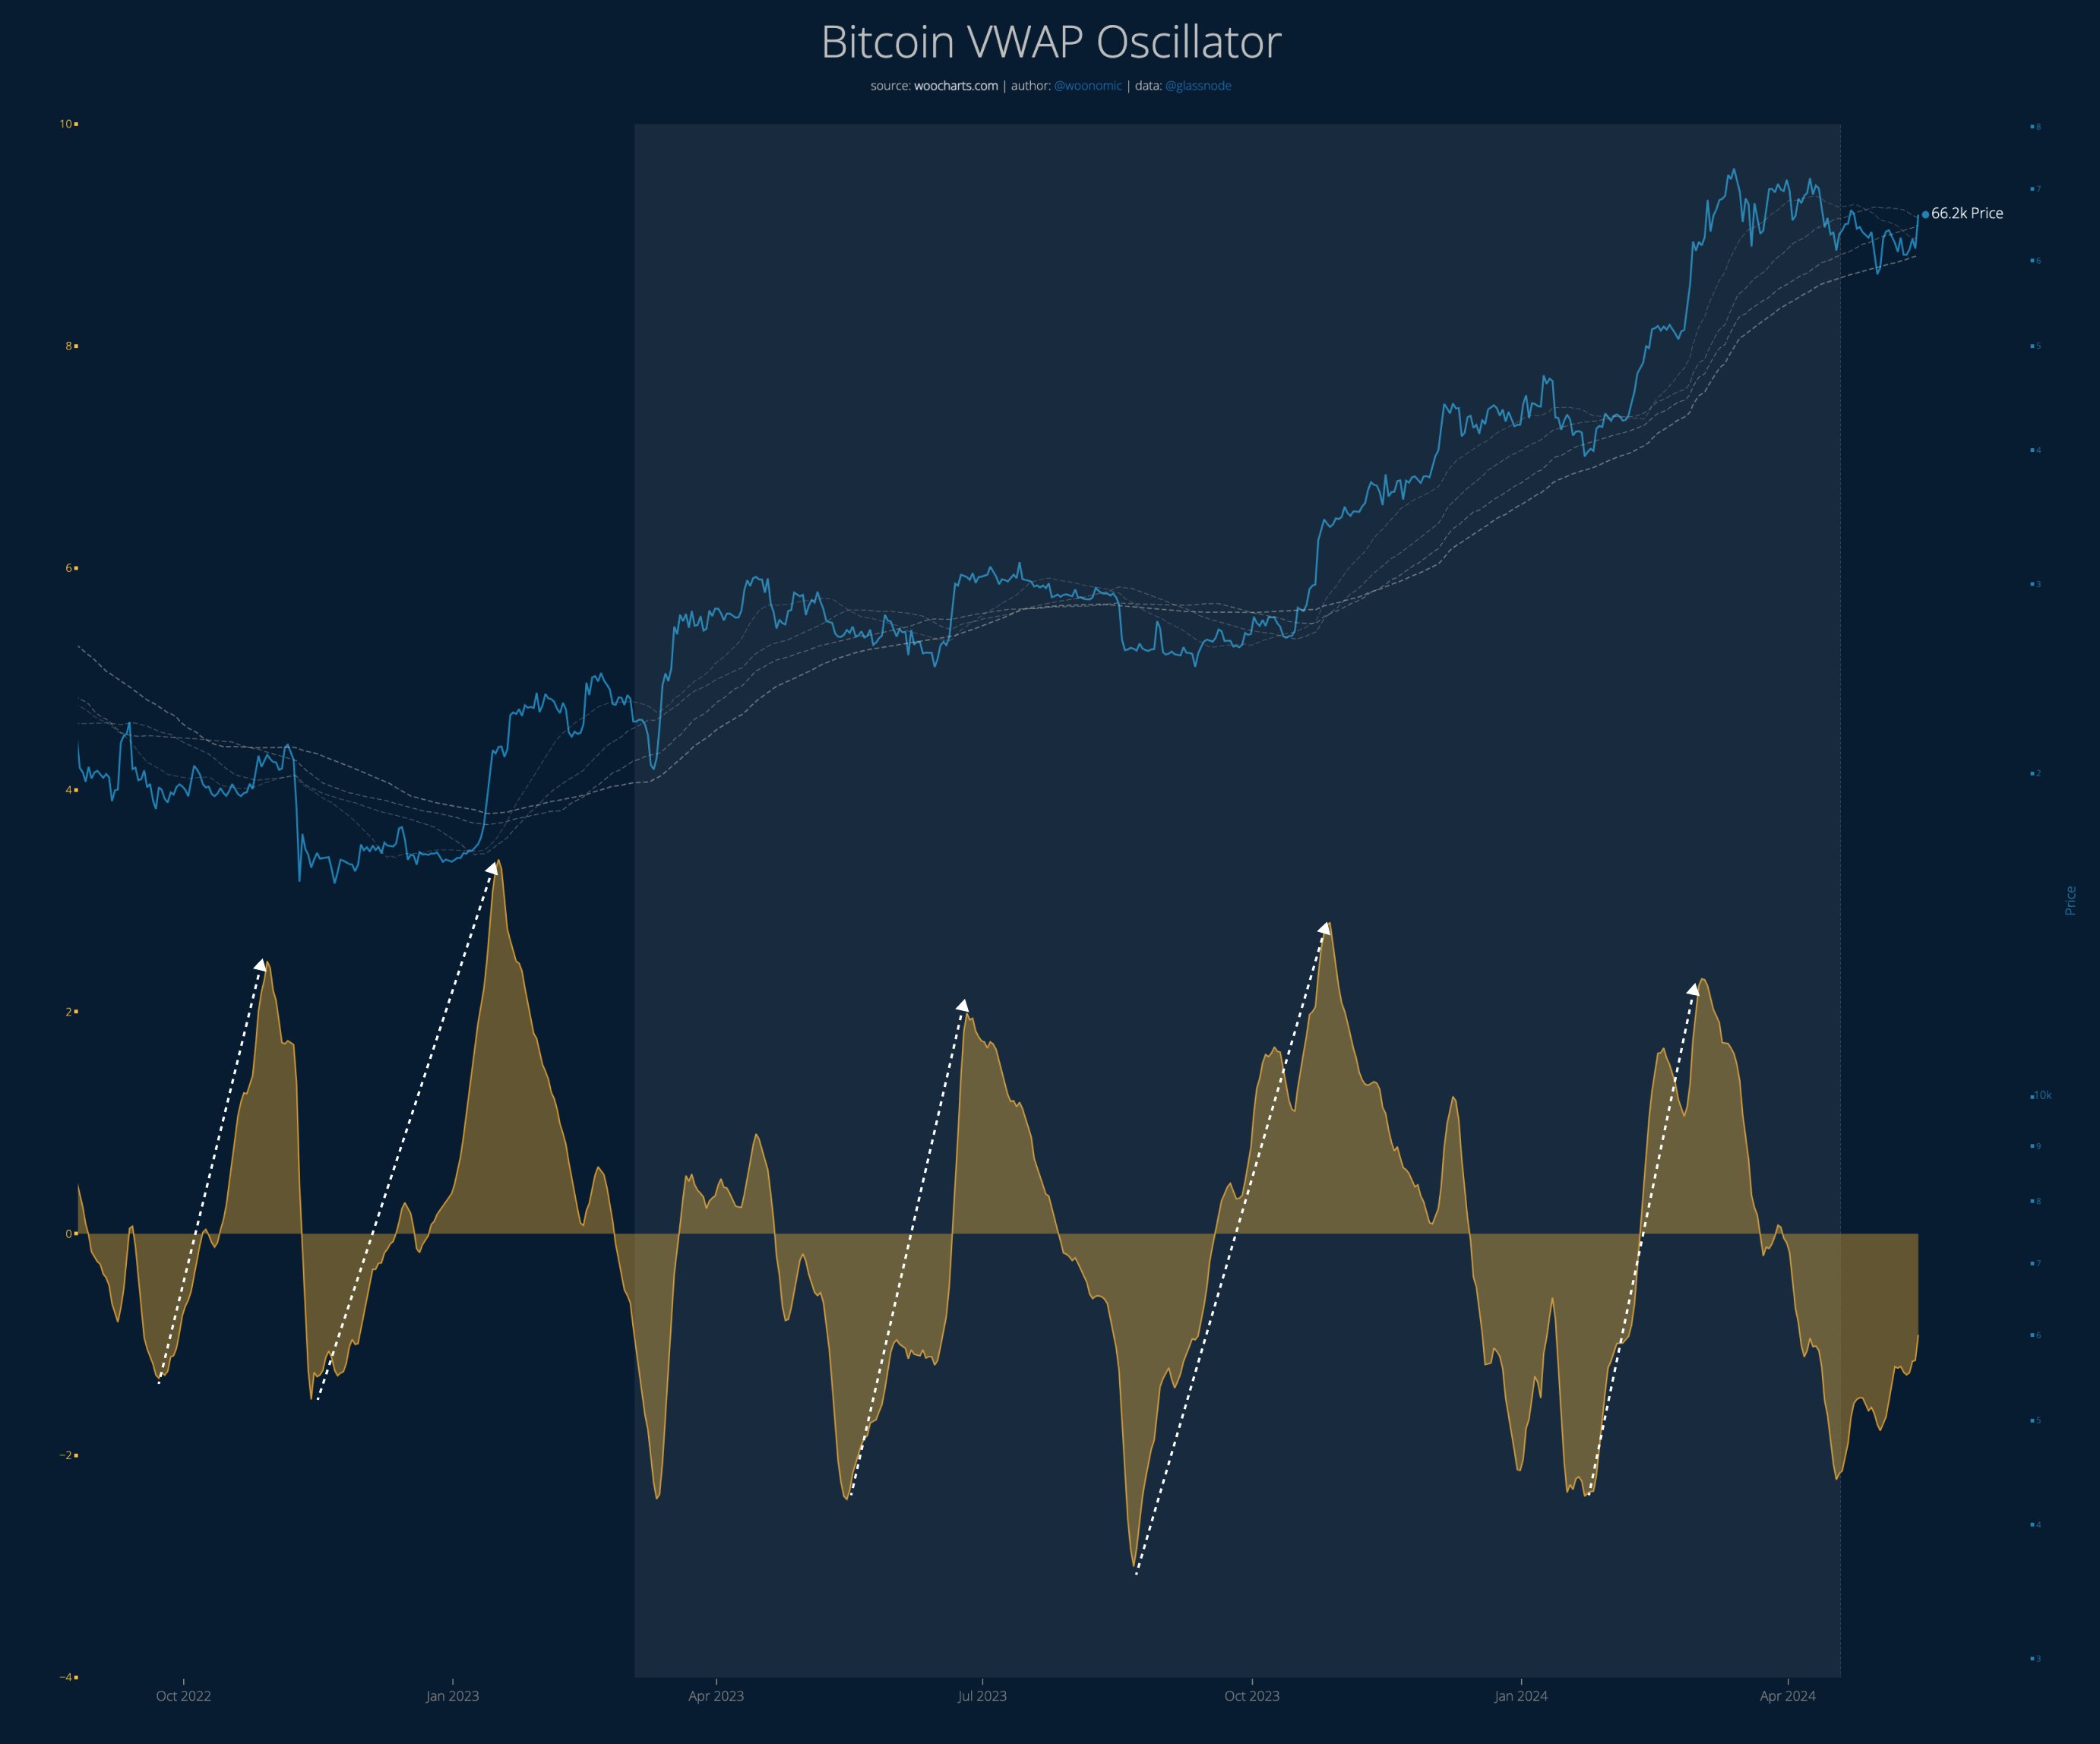
The above graph shows that the Bitcoin VWAP Oscillator has been in negative territory for the past couple of months. However, the metric’s value has been rising recently, so if it continues on this trajectory, it might approach the neutral mark shortly.
In the chart, Woo has highlighted a trend that the indicator and the cryptocurrency’s price have historically shown. It seems that whenever the metric has formed a bottom in negative territory and rebounded back to the upside, the asset has enjoyed some bullish momentum.
The resulting price surge may last until the indicator reverses into the positive territory and forms a top. That hasn’t happened for the VWAP Oscillator this time yet. “Still a lot of room to run before reversal or consolidation,” says the analyst. “Hate to be a trapped Bitcoin bear right now.”
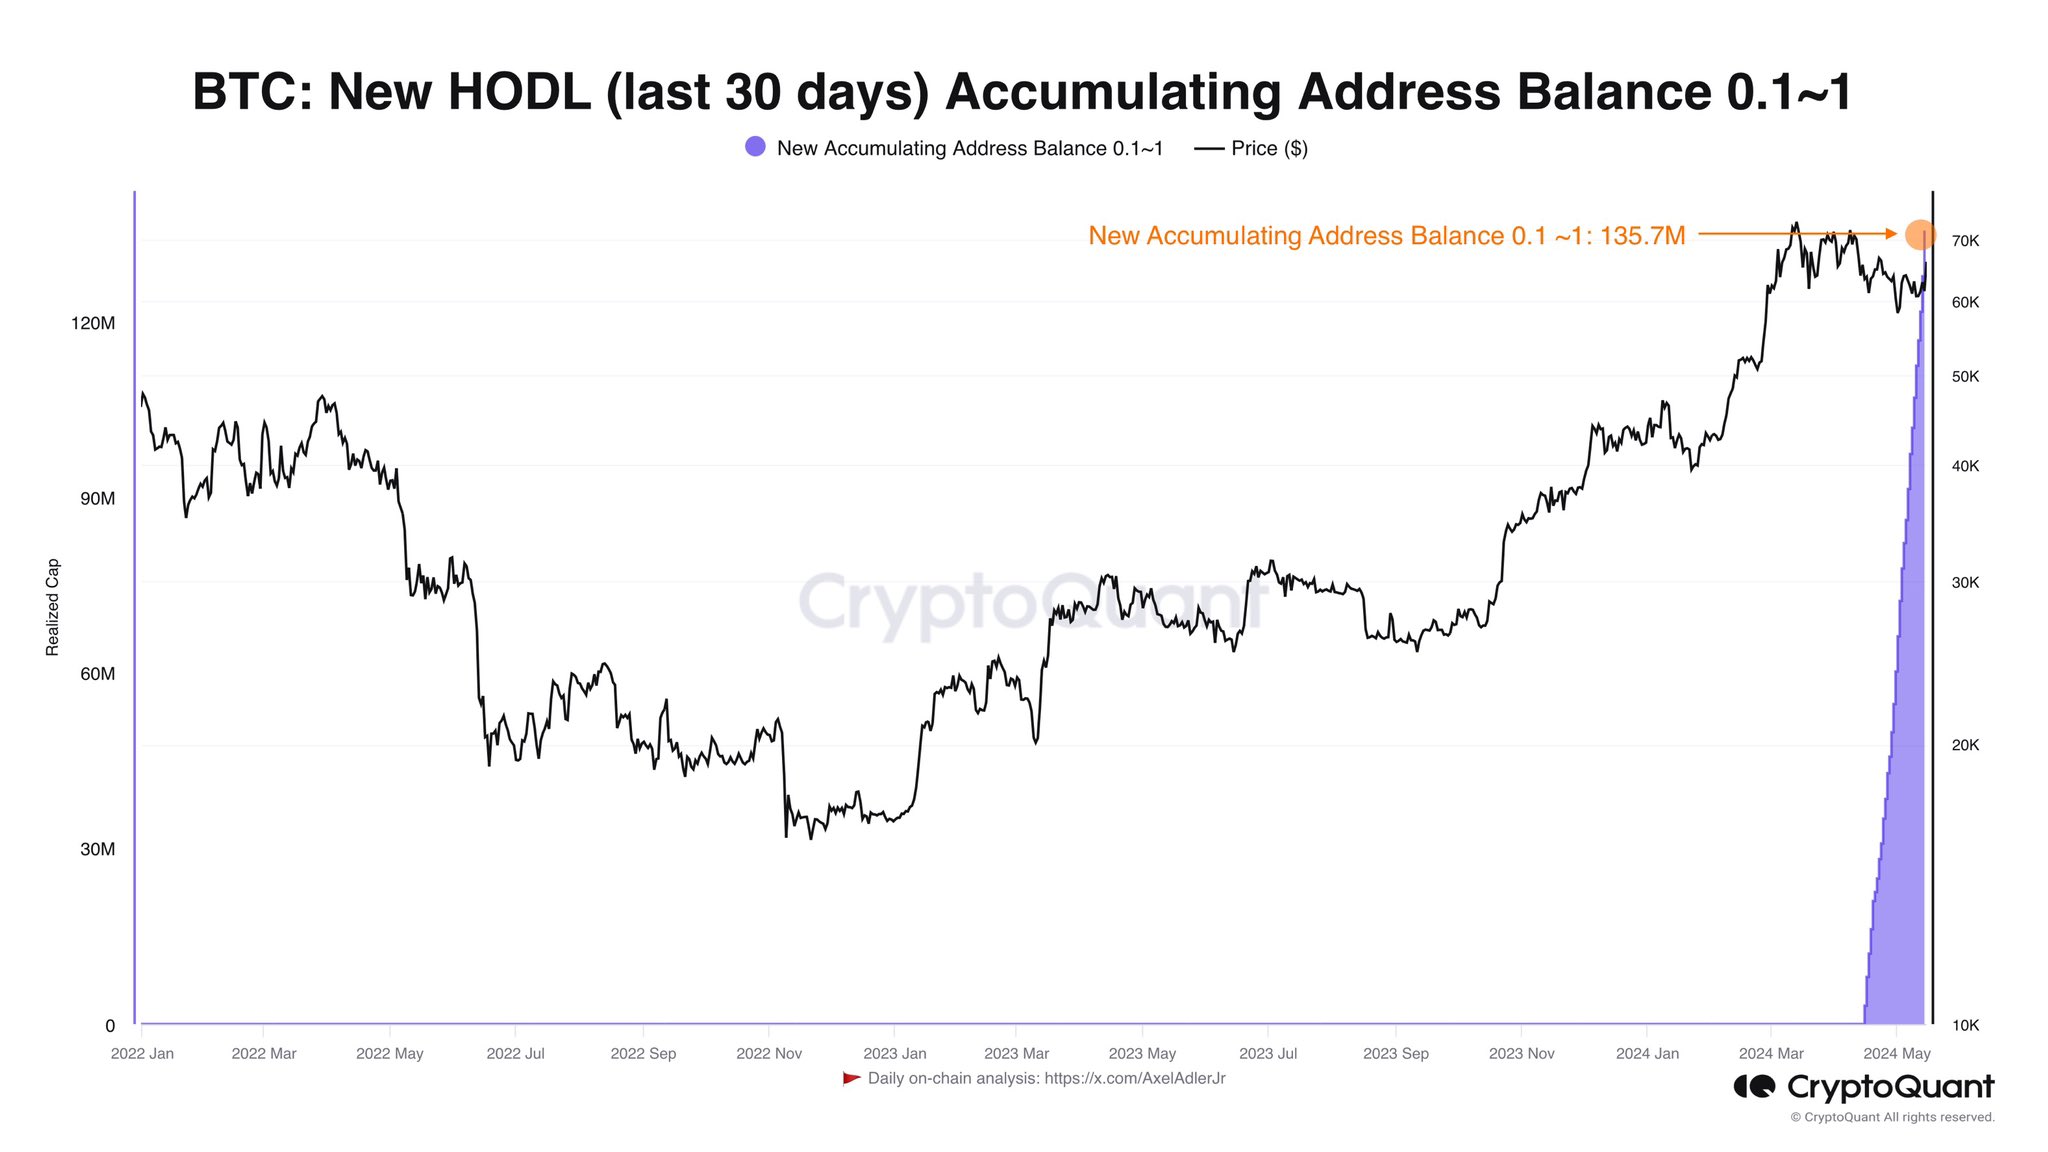
In other news, as CryptoQuant author Axel Adler Jr. pointed out in an X post, retail investors have bought 5.7 million worth of the asset over the past month.
BTC Price
At the time of writing, Bitcoin is floating around ,000, up 5% over the last week.
Ethereum Price Reclaims 100 SMA But Bulls Still Lack Strength To Clear Hurdles
Ethereum price started a recovery wave above the ,000 zone. ETH is now above the 100-hourly simple moving average and facing hurdles.
- Ethereum found support at ,820 and started a recovery wave.
- The price is trading above ,100 and the 100-hourly Simple Moving Average.
- There is a key bullish trend line forming with support at ,110 on the hourly chart of ETH/USD (data feed via Kraken).
- The pair could gain bullish momentum if it clears the ,165 resistance zone.
Ethereum Price Holds Ground
Ethereum price remained stable and started a recovery wave above the ,000 level, like Bitcoin. ETH was able to clear the ,050 and ,120 resistance levels.
However, the bears were active near the ,165 resistance zone. A high was formed at ,168 and the price started a downside correction. There was a minor move below the ,150 level. The price is now stable above the 23.6% Fib retracement level of the upward move from the ,813 swing low to the ,168 high.
Ethereum is also above ,100 and the 100-hourly Simple Moving Average. Besides, there is a key bullish trend line forming with support at ,110 on the hourly chart of ETH/USD.
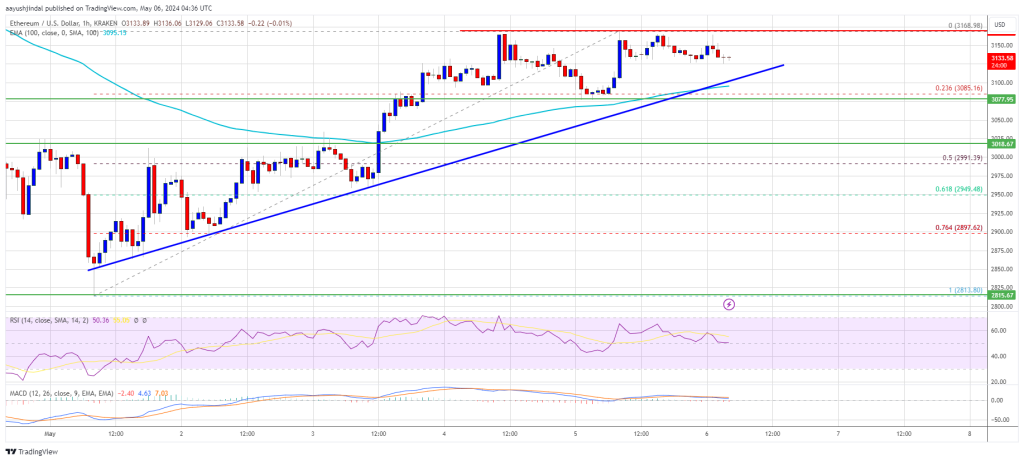
Source: ETHUSD on TradingView.com
Immediate resistance is near the ,165 level. The first major resistance is near the ,200 level. The next key resistance sits at ,250, above which the price might gain traction and rise toward the ,350 level. If the bulls remain in action and push the price above ,350, there could be a drift toward the ,500 resistance. Any more gains could send Ether toward the ,620 resistance zone.
Another Decline In ETH?
If Ethereum fails to clear the ,165 resistance, it could start another decline. Initial support on the downside is near the ,100 level and the trend line. The first major support is near the ,000 zone or the 50% Fib retracement level of the upward move from the ,813 swing low to the ,168 high.
The main support is near the ,940 level. A clear move below the ,940 support might push the price toward ,820. Any more losses might send the price toward the ,650 level in the near term.
Technical Indicators
Hourly MACD – The MACD for ETH/USD is losing momentum in the bullish zone.
Hourly RSI – The RSI for ETH/USD is now above the 50 level.
Major Support Level – ,000
Major Resistance Level – ,165
Shiba Inu Stands Strong: Over 650K Wallet Addresses Still Profitable Amid Recent Price Drop
Shiba Inu (SHIB) has demonstrated resilience despite recent market downturns. Data reveals that roughly over 700 trillion SHIB tokens held by more than 650,000 wallet addresses remain profitable, reflecting steadfast confidence among holders in the token’s long-term value.
Shiba Inu Market Resilience Amid Volatility
Recent on-chain analytics have uncovered an interesting trend among Shiba Inu investors. Despite a general dip in SHIB’s market price, investors continue to hold a substantial volume of tokens—totaling 733 trillion—showing unrealized gains.
These holdings, maintained by approximately 653,530 individual wallets, were acquired at prices ranging from .000002 to .000022, averaging out at .000011.
This indicates not only a significant level of acquisition but also a broad base of investors who entered the market at lower valuations, positioning themselves in profit despite the coin’s fluctuating fortunes.
The “Break Even Price” indicator, a crucial tool derived from on-chain data, suggests that many SHIB holders are still in the green financially. This could point to a collective strategy among holders to weather short-term price movements, with an eye on potential long-term returns.

Such data reinforces the notion of SHIB as more than just a speculative asset, hinting at a deeper conviction among its community regarding the token’s future potential.
Long-Term Outlook And Ecosystem Developments
Despite a decline of 5.2% over the past week and 11.9% over the past month, Shiba Inu has seen a recent uptick of 3.3% in its price in the last 24 hours, trading at .00002389.
Notably, this upward trajectory in value mirrors the asset’s trading volume, which has also surged from below 0 million last week to above 0 million as of today.
This recovery aligns with significant developmental strides within the Shiba Inu ecosystem, particularly the completion of a hard fork in its Layer-2 blockchain solution, Shibarium.
The Shibarium hard fork, executed at block height 4504576, introduced enhancements aimed at improving usability and transaction efficiency. This was a response to community feedback advocating better performance and lower costs.
This upgrade is expected to boost transaction speeds and stabilize transaction fees on Shibarium, making costs more predictable for users.
Moreover, the recent hard fork’s dual focus—enhancing the Bor and Heimdall components of Shibarium—aims to refine the platform’s technical infrastructure.
1/ #Shibarium has successfully completed its hard fork at block height 4504576!
Get ready for:
•Blazing-fast transactions!
•Predictable gas fees!pic.twitter.com/oQrtF3OMTe
— Shibarium Network (@ShibariumNet) May 2, 2024

By improving the calculation of state sync confirmation and ensuring deterministic finality, the Shiba Inu team appears keen on improving the network’s reliability and scalability.
Featured image from Unsplash, Chart from TradingView
Standard Chartered Bank Analysts Sound Warning Alarm: Bitcoin Price Can Still Drop To $50,000
Leading international cross border bank, Standard Chartered has predicted steep price declines for Bitcoin, foreseeing a pessimistic future outlook for the pioneer cryptocurrency amidst broader market downturn.
Bitcoin Could Plummet To ,000
As of writing the price of Bitcoin is trading above ,000, according to CoinMarketCap. The cryptocurrency has been experiencing massive price drops after the Bitcoin halving on April 20, 2024, further exacerbated by the Federal Reserve’s (FED) decision to keep interest rates unchanged during the Federal Open Market Committee (FOMC) meeting On Wednesday, May 1.
Standard Chartered bank has cautioned investors of more price drops in the future, predicting that Bitcoin’s price could settle between ,000 and ,000, recording more than ,000 loss from it’s all time high of over ,000 in March, 2024. This new forecast follows the bank’s previous projection which anticipated Bitcoin rise to 0,000 by the end of 2024.
The head of Standard Chatered’s forex and digital assets research, Geoffery Kendrick revealed a combination of factors that could drive Bitcoin’s decline in a statement to The Block on Wednesday. Kendrick highlighted broader macroeconomic influences and crypto-specific factors impacting the price of Bitcoin, particularly challenges like the reduction of liquidity measures within the United States since mid-April.
“Liquidity matters when it matters, but with a backdrop of strong US inflation data and less likelihood of Fed rate cuts, it matters at the moment,” Kendrick stated.
Standard Chartered also cited the series of massive outflows witnessed by Spot Bitcoin ETfs in the US, as well as the lackluster performance of Ethereum Spot ETFs in Hong Kong, China.
On May 1, approximately 10 US Spot Bitcoin ETFs recorded staggering outflows, collectively totaling 3.7 million. Kendrick also disclosed that “more than half of the Spot ETF positions are underwater.” He suggests that the risk of liquidity should be considered, especially as investor sentiment may be shifting away from these digital assets.
BTC Price Jumps Over ,000 Amidst Market Downturn
At some point on May 2, Bitcoin had witnessed significant price decreases that pushed its value below ,000. However, currently the cryptocurrency has recorded more than 1.56% increase, spiking by more than ,000 in just a day.
Various analysts have predicted more plunges for the cryptocurrency, expecting Bitcoin to reach its bottom during this bearish period. Analysts like Ali Martinez and Michael van de Poppe anticipate a few more price corrections before the broader market settles, paving the way for Bitcoin to prepare for a potential bullish rebound.
CryptoQuant Analyst Reveals Signal That Shows Bitcoin Is Still Very Bullish
The Bitcoin price movement in the past few days after the halving event has left many investors wanting. Particularly, price data shows the crypto failed to settle above ,000 las week. At the time of writing, Bitcoin is trading at ,105, down by 2.96% and 6.14% in the past 24 hours and seven days, respectively.
According to a CryptoQuant analyst, Bitcoin’s Adjusted Spent Output Profit Ratio (aSOPR) is still looking bullish, which could be a faint signal of the crypto’s price reversing into bullish momentum.
Current State Of Bitcoin
As it stands, the price of Bitcoin might be on the way to registering a new monthly low with the risks of more downside below ,000. A recent analysis during the weekend by Phi Deltalytics, an analyst at CryptoQuant, noted that Bitcoin’s price trajectory is showing indecisiveness in the short term. His analysis is based upon the SOPR ratio, one of the lesser-known but highly useful metrics for analyzing Bitcoin.
SOPR measures the profit ratio of spent outputs, which are groups of transactions representing the movement of coins. Phi’s analysis revealed an interesting indecisiveness with this metric. According to this metric, Bitcoin’s short-term Spent Output Profit Ratio (SOPR) has entered into a zone of indecisiveness, correlating with the current market sentiment. However, the analyst also noted that the adjusted SOPR continues to move in a bullish direction, a confluence that warrants careful planning when entering the market.
What Does This Mean for Bitcoin?
This discrepancy with the SOPR and its adjusted ratio means many short-term holders are now trading Bitcoin at a loss. Interestingly, another CryptoQuant analysis seems to support this idea. Specifically, the long-term SOPR to short-term SOPR ratio is moving in favor of long-term holders, suggesting that long-term holders are realizing greater profits in contrast to short-term holders. Hence, there is persistence of bullish momentum with the adjusted SOPR.
A better interpretation of this SOPR ratio is that the price of Bitcoin has not been favorable for short-term holders at the current market conditions. Furthermore, it suggests that the stalling of the upward momentum can be attributed to some long-term holders cashing out their holdings.
According to Phi Deltalytics, a reversal of the adjusted SOPR into a bearish signal would finally imply the possibility of a rapid downward shift in the price of Bitcoin.
“The persistence of a bullish aSOPR amidst wavering short-term SOPR trends gives rise to the possibility of a rapid downward shift once the aSOPR trajectory reverses,” the analyst mentioned.
When Will The Correction End?
Bitcoin’s price has been ranging between ,000 to ,000 since it reached a new all-time high. The much-anticipated break above ,000 now seems to be taking forever, and this lackluster action has prompted some analysts to believe that Bitcoin might have reached its peak in the current market cycle.
However, time can only reveal the crypto’s price trajectory in the coming months, particularly with the recent conclusion of another halving event. If halving history repeats itself, Bitcoin could continue its price surge within the next nine months.
Bitcoin Market Dynamics Still Positive Post-Halving – Bitfinex Analysis
In the midst of the dramatic changes that have occurred in the cryptocurrency space after the Bitcoin halving event, Bitfinex provides a perceptive analysis that reassures investors that the market dynamics of BTC have remained positive in the post-halving period. Bitfinex examines the on-chain data and finds encouraging signs for Bitcoin in spite of the United States economy’s current state of uncertainty in its most recent Alpha report, which was released on April 22.
Bitcoin Market Dynamics Remains Bullish
According to the Hong Kong-based crypto platform, exchange withdrawals of Bitcoin are currently at levels not seen since January 2023. This simply indicates that a lot of investors are putting their assets in cold storage in expectation of price rises.
Also, the exchange noted that long-term investors’ aggressive selling has not yet caused the usual pre-halving price decline, which suggests that new market participants are absorbing the selling pressure quite well, highlighting the tenacity of the present market structure of Bitcoin.
The Bitfinex Alpha report revealed that the average daily net inflow from spot Bitcoin Exchange-Traded Funds (ETFs) is 0 million. Given the ETFs’ inflows far exceeding the and million daily issuance rate of BTC following the halving, this significant supply and demand imbalance could encourage further price appreciation.
Bitfinex further claims the massive purchases of spot Bitcoin ETFs, which have dominated the entire year’s market narrative, may decline. However, recent ETF outflows have shown that ETF demand may be starting to stabilize.
It is important to note that the recently concluded Halving cut down miners’ reward from 6.25 BTC to 3.125 BTC. As a result, miners are now modifying their operating tactics in order to sustain their activities against the decline in reward following the Halving.
Thus, the amount of Bitcoin that miners are sending to exchanges has significantly decreased, which may indicate that they are selling ahead of time or collateralizing their holdings to upgrade infrastructure. Consequently, this could possibly lead to a gradual increase in selling pressure rather than a sudden drop in value at the Halving.
New BTC Whales Surpassed Old Whales
Since the conclusion of the fourth Halving, on-chain data shows a significant rise in new Bitcoin whales. CryptoQuant Chief Executive Officer (CEO) Ki Young Ju, reported the development, noting that the initial investment made by the new whales in Bitcoin is nearly twice that of the old whales combined.
According to the data, the total holding by these new whales, which are short-term holders, is valued at 0.6 billion. Meanwhile, the old whales, which are long-term holders, own a whopping billion worth of BTC. This change in whale demographics may impact Bitcoin’s future course and the dynamics of the cryptocurrency landscape as a whole.
Bitcoin Price Still At Risk of Major Downside Break Below $60K
Bitcoin price is showing bearish signs below the ,000 resistance zone. BTC must stay above the ,000 support zone to avoid a major decline.
- Bitcoin is still struggling to start a recovery wave above the ,000 resistance zone.
- The price is trading below ,800 and the 100 hourly Simple moving average.
- There was a break below a connecting bullish trend line with support at ,400 on the hourly chart of the BTC/USD pair (data feed from Kraken).
- The pair could gain bearish momentum if it settles below the ,000 support zone.
Bitcoin Price Struggle Continues
Bitcoin price started another increase above the ,500 resistance zone. BTC cleared the ,500 and ,000 resistance levels. It even spiked above ,000 but failed to surpass the key level at ,000.
A high was formed at ,142 before there was a sharp decline. There was a break below a connecting bullish trend line with support at ,400 on the hourly chart of the BTC/USD pair. It dived below the ,800 level and retested ,650.
A low was formed near ,666 and the price is now attempting a fresh recovery wave. The price climbed above the 23.6% Fib retracement level of the recent decline from the ,142 swing high to the ,666 low.
Bitcoin price is trading below ,800 and the 100 hourly Simple moving average. Immediate resistance is near the ,000 level. It is close to the 50% Fib retracement level of the recent decline from the ,142 swing high to the ,666 low.
The first major resistance could be ,000. The next resistance now sits at ,200. If there is a clear move above the ,200 resistance zone, the price could continue to move up. In the stated case, the price could rise toward ,000.
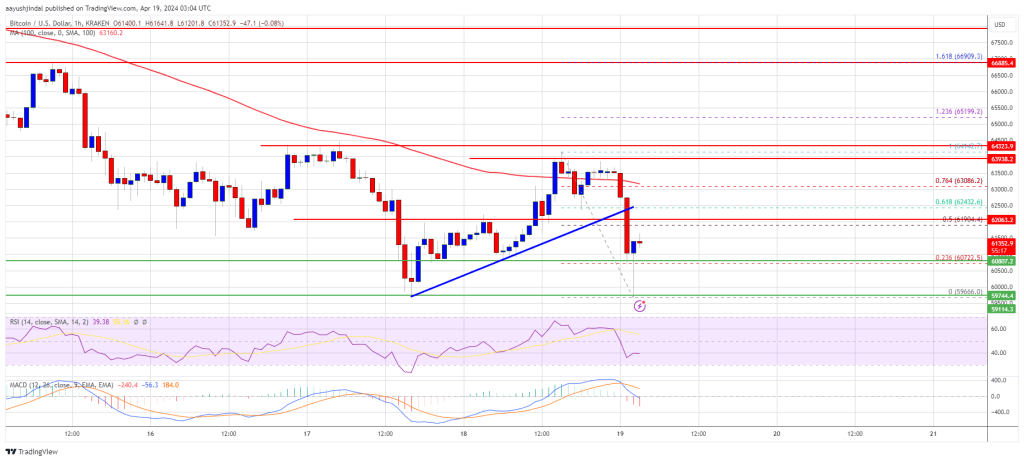
Source: BTCUSD on TradingView.com
The next major resistance is near the ,500 zone. Any more gains might send Bitcoin toward the ,500 resistance zone in the near term.
More Losses In BTC?
If Bitcoin fails to rise above the ,000 resistance zone, it could start another decline. Immediate support on the downside is near the ,800 level.
The first major support is ,000. If there is a close below ,000, the price could start to drop toward the ,550 level. Any more losses might send the price toward the ,500 support zone in the near term.
Technical indicators:
Hourly MACD – The MACD is now gaining pace in the bearish zone.
Hourly RSI (Relative Strength Index) – The RSI for BTC/USD is now below the 50 level.
Major Support Levels – ,800, followed by ,000.
Major Resistance Levels – ,000, ,000, and ,200.
Bitcoin Below $70,000: Is $80K Still Possible, Or Is The Rally Over?
Bitcoin, the undisputed king of cryptocurrencies, is once again on a wild ride. After a surge over the weekend that brought it close to shattering its all-time high, the digital asset has dipped back below the crucial ,000 mark in the last 24 hours. This sudden correction has left investors wondering if the predicted surge to ,000 is still on the table.
Bitcoin Erases Weekend Gains
Just days ago, Bitcoin bulls were celebrating as the price climbed to near record highs exceeding ,000. This bullish momentum fueled optimism, with analysts like Markus Thielen predicting a swift climb towards ,000.
However, that optimism has been tempered by the recent price drop. Bitcoin has plummeted roughly 6% from its peak, effectively erasing the gains made earlier this week. While the price has recovered slightly to hover around ,200, it remains below the psychological barrier of ,000.
Is The ,000 Dream Dead?
The recent correction has undoubtedly dampened spirits, but some analysts are still confident that Bitcoin’s journey to ,000 is far from over. Proponents of this view point to a few key factors that continue to fuel their bullish sentiment.
Stablecoin Inflows: A Beacon Of Hope?
One factor cited by Thielen is the continued strength of stablecoin inflows. Stablecoins, cryptocurrencies pegged to traditional assets like the US dollar, are often used as an entry point for investors into the crypto market.
According to Thielen, these robust inflows suggest sustained investor interest despite the short-term price fluctuations. Additionally, he highlights a recent technical chart pattern breakout, specifically a symmetrical triangle, as another bullish indicator.
Technical analysts believe such breakouts often signal a continuation of the prior trend, which in this case would be positive for Bitcoin.
On-Chain Data Bolsters Bullish Case
Some analysts point to on-chain data from IntoTheBlock, which reveals significant buying support at current price levels.
This data suggests that a large number of addresses (essentially unique identifiers for cryptocurrency wallets) purchased Bitcoin within the range of ,200 and ,325.
This buying activity indicates potential resistance against further price dips, as these addresses would likely be hesitant to sell at a loss.
Bullish And Bearish Forces
The current situation presents a classic tug-of-war between Bitcoin bulls and bears. While the recent price correction has shaken some confidence, strong stablecoin inflows and on-chain buying activity suggest underlying bullish pressure.
However, they remain cautious, pointing to the slowdown in investments specifically targeted at spot Bitcoin ETFs (Exchange Traded Funds) as a potential concern. These ETFs allow investors to gain exposure to Bitcoin’s price movements without directly owning the cryptocurrency.
Meanwhile, a report by CoinShares, a digital asset manager, highlights a significant decrease in inflows to such ETFs in recent weeks, suggesting that some institutional investors might be adopting a wait-and-see approach.
The future trajectory of Bitcoin remains uncertain. The coming days and weeks will be crucial in determining whether the bulls can overcome the current resistance and propel the price towards ,000.
Featured image from Pexels, chart from TradingView