 While June was a lackluster period for crypto assets as many experienced double-digit losses against the U.S. dollar, the stablecoin market also saw minimal growth over the past 30 days. Ethena’s USDE led the growth, with its supply increasing by 21.4% since May. Stablecoin Economy Shows Little Change in June The stablecoin market remained relatively […]
Bitcoin News
Steady Above $60K: Bitcoin Weathers Government Sell-Offs, Says QCP Capital
 Despite a brief dip below ,000 on June 23, bitcoin has demonstrated formidable resilience by closing above this pivotal level for 118 days in 2024. According to QCP Capital, the cryptocurrency continues to hold strong against various market pressures, including substantial governmental sell-offs. QCP Capital Foresees Bitcoin Holding K Line, Despite Recent Market Pressures In […]
Bitcoin News
Bitcoin Technical Analysis: BTC Holds Steady Amidst Consolidation Phase
 Bitcoin’s price stands at ,352, within a 24-hour intraday range of ,213 to ,840. The leading crypto asset’s market capitalization is .36 trillion, with a 24-hour trade volume of .83 billion. Bitcoin The hourly chart for bitcoin (BTC) indicates a phase of consolidation with minor fluctuations. The price hit a high of ,840 before retracting […]
Bitcoin News
Bitcoin Price Gradually Climbs: Steady Ascent Points to Bullish Momentum
Bitcoin price started a decent increase above the ,500 resistance. BTC is showing positive signs and might gain bullish momentum above the ,000 resistance in the near term.
- Bitcoin extended its increase above the ,000 and ,500 resistance levels.
- The price is trading above ,000 and the 100 hourly Simple moving average.
- There is a key bullish trend line forming with support at ,600 on the hourly chart of the BTC/USD pair (data feed from Kraken).
- The pair could gain bullish momentum if it settles above the ,000 level.
Bitcoin Price Regains Strength
Bitcoin price remained stable above the ,500 zone its extended its increase. BTC was able to clear the ,000 and ,200 levels to move further into a positive zone.
The bulls even pushed the price above ,500. A high was formed at ,682 and the price is now consolidating gains. The price is holding gains above the 23.6% Fib retracement level of the upward move from the ,285 swing low to the ,682 high.
Bitcoin is now trading above ,500 and the 100 hourly Simple moving average. There is also a key bullish trend line forming with support at ,600 on the hourly chart of the BTC/USD pair.
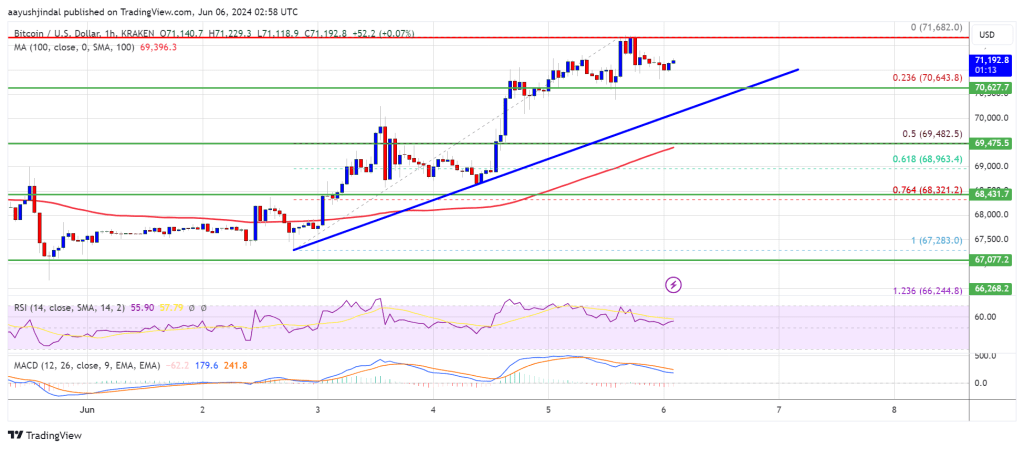
On the upside, the price is facing resistance near the ,400 level. The first major resistance could be ,650. The next key resistance could be ,000. A clear move above the ,000 resistance might send the price higher. In the stated case, the price could rise and test the ,200 resistance. Any more gains might send BTC toward the ,000 resistance.
Are Dips Limited In BTC?
If Bitcoin fails to climb above the ,400 resistance zone, it could start another decline. Immediate support on the downside is near the ,600 level and the trend line.
The first major support is ,000. The next support is now forming near ,500 or the 50% Fib retracement level of the upward move from the ,285 swing low to the ,682 high. Any more losses might send the price toward the ,500 support zone in the near term.
Technical indicators:
Hourly MACD – The MACD is now losing pace in the bullish zone.
Hourly RSI (Relative Strength Index) – The RSI for BTC/USD is now above the 50 level.
Major Support Levels – ,600, followed by ,000.
Major Resistance Levels – ,600, and ,000.
Grayscale Maintains Steady Revenue Despite Massive GBTC Outflows in Q1
 Grayscale Investments maintained stable revenue in the first quarter despite substantial outflows from the Grayscale Bitcoin Trust (GBTC), its converted spot bitcoin exchange-traded fund (ETF). The firm reported 6 million in revenue, little change from the previous quarter, as stated in a shareholder letter from Digital Currency Group (DCG), its parent company. The conversion of […]
Bitcoin News
XRP Price Prediction – Can 100 SMA Trigger Another Steady Increase
XRP price is correcting gains from the .570 resistance. The price is stable above the .5240 support and might aim for a fresh increase in the near term.
- XRP started a decent increase and climbed above the .550 resistance.
- The price is now trading above .5250 and the 100 simple moving average (4 hours).
- There is a key bullish trend line forming with support at .5320 on the 4-hour chart of the XRP/USD pair (data source from Kraken).
- The pair could start another increase if the bulls defend the .5240 support.
XRP Price Holds Support
Recently, XRP price started a decent increase above the .5250 resistance zone. The bulls even pushed the price above the .550 resistance zone before the bears appeared.
A high was formed at .5699 before there was a pullback like Bitcoin and Ethereum. The price dipped below the .550 support zone. The price declined below the 23.6% Fib retracement level of the upward move from the .4787 swing low to the .5699 high.
However, the price is now stable above .5250 and the 100 simple moving average (4 hours). There is also a key bullish trend line forming with support at .5320 on the 4-hour chart of the XRP/USD pair.
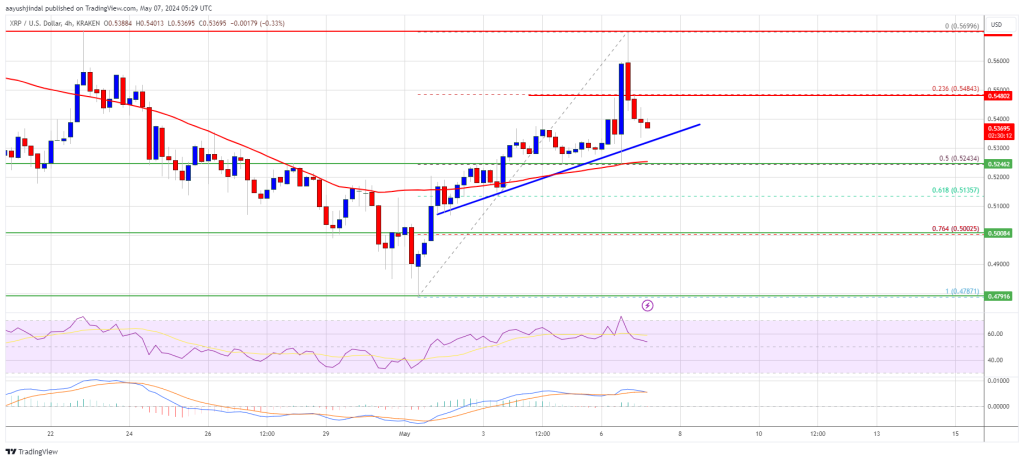
Source: XRPUSD on TradingView.com
Immediate resistance is near the .5480 level. The first key resistance is near .570. A close above the .570 resistance zone could spark a strong increase. The next key resistance is near .5850. If the bulls remain in action above the .5850 resistance level, there could be a rally toward the .620 resistance. Any more gains might send the price toward the .680 resistance.
More Losses?
If XRP fails to clear the .5480 resistance zone, it could start another decline. Initial support on the downside is near the .5320 level and the trend line.
The next major support is at .5240 and the 100 simple moving average (4 hours). If there is a downside break and a close below the .5240 level, the price might accelerate lower. In the stated case, the price could retest the .50 support zone.
Technical Indicators
4-Hours MACD – The MACD for XRP/USD is now losing pace in the bullish zone.
4-Hours RSI (Relative Strength Index) – The RSI for XRP/USD is now above the 50 level.
Major Support Levels – .5320, .5240, and .500.
Major Resistance Levels – .5480, .570, and .600.
Federal Reserve Holds Rates Steady Amid Inflation Concerns; Outlook Remains ‘Uncertain’
 On Wednesday, May 1, 2024, the U.S. Federal Reserve chose to maintain the benchmark interest rates at their highest in 23 years. The Federal Open Market Committee (FOMC) members noted that although inflation has subsided, it still “remains elevated.” No Change in Federal Funds Rate; Fed Continues Watchful Eye on Inflation Risks On Wednesday, the […]
Bitcoin News
‘Dencun’ Upgrade Officially Deployed On Ethereum Mainnet, ETH Price Holds Steady Below $4,000
Ethereum (ETH) has completed a major software upgrade, Dencun, that promises to make utilizing the network ecosystem more cost-effective. This update specifically targets Layer 2 (L2) networks, such as Arbitrum (ARB), Polygon (MATIC), and Coinbase’s Base, which are interconnected with Ethereum.
With Dencun, transaction costs on these networks have significantly decreased, with fees dropping from dollars to cents or even fractions of a cent.
Ethereum Dencun Upgrade And Cost Savings
Considered the most significant change in Ethereum’s end-user experience, the Dencun upgrade is expected to foster the development of new applications and services by significantly reducing expenses.
As NewsBTC reported on Tuesday, the update introduces a new data storage system, departing from the traditional approach of storing Layer 2 data on Ethereum itself. Adopting a new “blobs” repository reduces data storage costs since information is warehoused for only about 18 days instead of indefinitely.
One of the notable benefits of the Dencun upgrade lies in its impact on decentralized exchanges (DEXs) and gas costs. For instance, projected gas costs for popular Layer 2 networks, such as Arbitrum, Optimism, and Coinbase’s Base, are set to be significantly reduced.
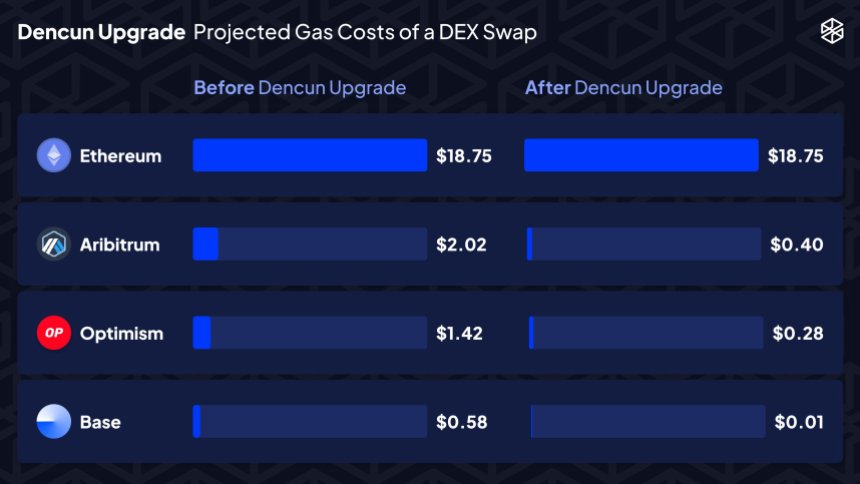
The projected savings translate into a reduction of Arbitrum’s swaps from .02 to .40, Optimism’s swaps from .42 to .28, and Coinbase’s Base swaps from .58 to .01, emphasizing the pivotal role of this upgrade.
As the upgrade was successfully launched on the mainnet, Tim Beiko, Ethereum Foundation core developer, expressed his satisfaction with the work accomplished and claimed:
Dencun is both the most complex fork we’ve shipped since the Merge, and tied for “most total EIPs in a fork” with Byzantium. There were more teams than ever involved in the process, and it somehow all worked out smoothly…! Grateful to work with all of them, onto the next one.
Blob Transactions And Pricing Changes
Layer 2 network Arbitrum has provided insights into the upgrade process. It will take around one to two hours for blob transactions to commence posting and for the new pricing changes specified by EIP-4844 to come into effect.
ArbOS Atlas, an upgrade that supports Arbitrum Chains, will introduce further fee reductions for Arbitrum One, set to be activated on March 18th. The updated configurations include a reduction in the Layer 1 (L1) surplus fee from 32 gwei to 0 per compressed byte and a reduction in the L2 base fee from 0.1 gwei to 0.01 gwei.
The Dencun upgrade unlocks cost-saving opportunities for Layer 2 networks and addresses congestion concerns by freeing up more space on the Ethereum network for additional transactions. While the upgrade offers enhanced efficiency, it does come at the cost of no longer retaining a complete record of all data indefinitely.
However, as Layer 2 networks embrace this new update to the Ethereum ecosystem, the stage is set for accelerated adoption, usage, and broader accessibility within the Ethereum community and its underlying protocols.
Dencun Upgrade Fails To Propel ETH Above ,000
Despite the successful upgrade, ETH’s price remains unaffected, continuing to consolidate below the ,000 threshold. The token attempted to surpass this crucial resistance level on Monday and Tuesday but failed to sustain its position above it.
For over 24 hours now, ETH has been trading between ,930 and ,970. Nevertheless, it’s worth noting that ETH has maintained its upward momentum, with gains exceeding 18% over the past fourteen days and nearly 60% over the past thirty days.
Additionally, introducing the Dencun upgrade is expected to drive increased demand for ETH, potentially sparking a renewed uptrend that could bridge the gap between current trading prices and its previous all-time high (ATH) of ,878, achieved in November 2021.
Featured image from Shutterstock, chart from TradingView.com
Financial Markets Tense as Inflation Rise Suggests US Central Bank May Keep Rates Steady
 The U.S. Consumer Price Index (CPI), experienced a 3.2% increase over the 12 months ending in February, marginally higher by 0.1% compared to January’s CPI. This development is not being well-received by the financial markets, as the U.S. Federal Reserve might postpone any reductions in the benchmark federal funds rate. Persistent Inflation Pressures Fed, Leaving […]
Bitcoin News
Bitcoin Technical Analysis: BTC Holds Steady Above $43K as Bulls Defend Support

Bitcoin’s price is holding above the ,000 range after bulls defended key support levels over the weekend. The leading crypto asset is up 2% week-to-date and 5.6% over the past two weeks.
Bitcoin
On the 1-hour chart, bitcoin’s price action shows a short-term uptrend, with higher lows indicating continued buying interest. The bulls have managed to defend support around ,243, which could now act as a potential entry point on pullbacks. Resistance builds around the ,210 range as bulls have yet to cross it.
Zooming out to the 4-hour chart, the picture is somewhat choppier but an uptrend is emerging, with a series of higher highs and higher lows. The critical support to watch is around ,859, where the bulls could look to enter long positions. On this chart, resistance stands at ,738, where selling pressure may emerge.
On the daily timeframe, bitcoin is consolidating after a previous downtrend. While still rangebound, the market bias appears tilted to the upside here. The key support at ,505 was held firmly during the recent pullback, keeping the bulls in control. The resistance line is at ,048, the year’s all-time price high.
Overall, the oscillators and moving averages (MAs) corroborate the uptrend across the short, medium, and long-term timeframes. The relative strength index (RSI), Stochastic, commodity channel index (CCI), and moving average convergence/divergence (MACD) all signal bullish momentum at press time.
The multiple timeframe analysis suggests bitcoin’s uptrend remains intact. Traders can look to buy dips with tight stop losses placed below critical support levels. Initial upside targets exist around resistance zones, but traders should also consider trailing stop losses to capitalize on extended moves to the upside. The bulls remain in control so long as support continues holding.
Bull Verdict:
The confluence of bullish signals across the short, medium, and long-term timeframes paints a decisively bullish picture. Bitcoin appears poised to continue its uptrend as long as critical support levels hold. Traders can look to buy the dips, targeting the overhead resistance zones. The path of least resistance remains to the upside.
Bear Verdict:
While bitcoin has shown some bullish signals, the risk of a trend reversal remains if critical support levels fail to hold. Traders should exercise caution when looking for long entries, maintaining tight stop losses below support. The choppy price action suggests potential exhaustion among bulls. Until bitcoin can gain upside momentum above resistance, the bears may look to trap bullish traders.
Register your email here to get weekly price analysis updates sent to your inbox:
What do you think about bitcoin’s market action on Monday? Share your thoughts and opinions about this subject in the comments section below.