 On Monday, June 24, 2024, the Mt Gox bankruptcy trustee declared that reimbursements are slated to commence at the start of July. The trustee explained that disbursements will be made in bitcoin and bitcoin cash and sent to designated exchanges. After Ten Years, Mt Gox Trustee Announces July Start for Repayments Approximately billion worth […]
Bitcoin News
Uniswap Price (UNI) Pumps 20%: Is This the Start of a Major Rally?
UNI price started a major increase above the .50 resistance. Uniswap is showing positive signs and might eye more upsides above the .00 resistance.
- UNI started a fresh increase above the .50 resistance zone.
- The price is trading above .20 and the 100-hourly simple moving average.
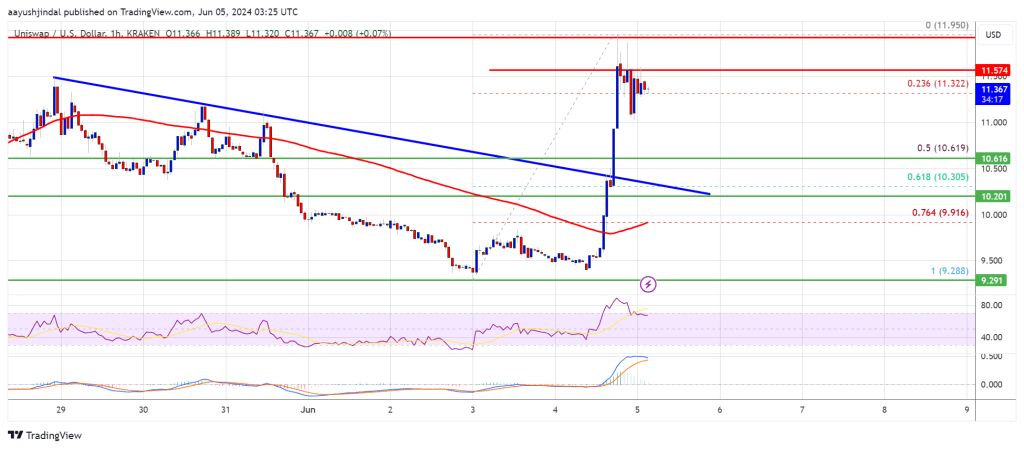
- There was a break above a key bearish trend line with resistance near .35 on the hourly chart of the UNI/USD pair (data source from Kraken).
- The pair might correct gains, but the bulls might eye more upsides above .00 in the near term.
UNI Price Regains Traction
After forming a base above the .20 level, Uniswap started a fresh increase like Bitcoin and Ethereum. UNI price gained pace for a move above the .80 and .00 resistance levels.
There was a break above a key bearish trend line with resistance near .35 on the hourly chart of the UNI/USD pair. The bulls even pushed the price above the .50 and .50 resistance levels. Finally, the bears appeared near the .00 zone.
A high was formed near .795 and the price is now consolidating gains near the 23.6% Fib retracement level of the upward move from the .28 swing low to the .95 high.
UNI is now trading above .20 and the 100-hourly simple moving average. Immediate resistance is near the .55 level. The next key resistance is near the .00 level. A close above the .00 level could open the doors for more gains in the near term.
The next key resistance could be near .20, above which the bulls are likely to aim a test of the .50 level. Any more gains might send UNI toward .50.
Are Dips Supported In Uniswap?
If UNI price fails to climb above .95 or .00, it could start a downside correction. The first major support is near the .00 level.
The next major support is near the .60 level or the 50% Fib retracement level of the upward move from the .28 swing low to the .95 high. A downside break below the .60 support might open the doors for a push toward .20.
Technical Indicators
Hourly MACD – The MACD for UNI/USD is gaining momentum in the bullish zone.
Hourly RSI (Relative Strength Index) – The RSI for UNI/USD is above the 50 level.
Major Support Levels – .00, .60, and .20.
Major Resistance Levels – .55, .00, and .20.
Buckle Up: Bitcoin’s Ride to $74K Could Start Any Minute – Here’s Why
Although Bitcoin has yet to reclaim its peak of over ,000 from March, it achieved a 24-hour high of ,188. This performance is part of a gradual increase, with Bitcoin rising 1.2% over the past week and 2% in the last 24 hours, bringing its current price to ,211.
Amid this price performance, the crypto has shown promising fluctuations that suggest a possible upswing in its market value, with developments in trading patterns and analyst forecasts painting a bullish future.
Breaking Resistance: BTC Eyes Major Breakout
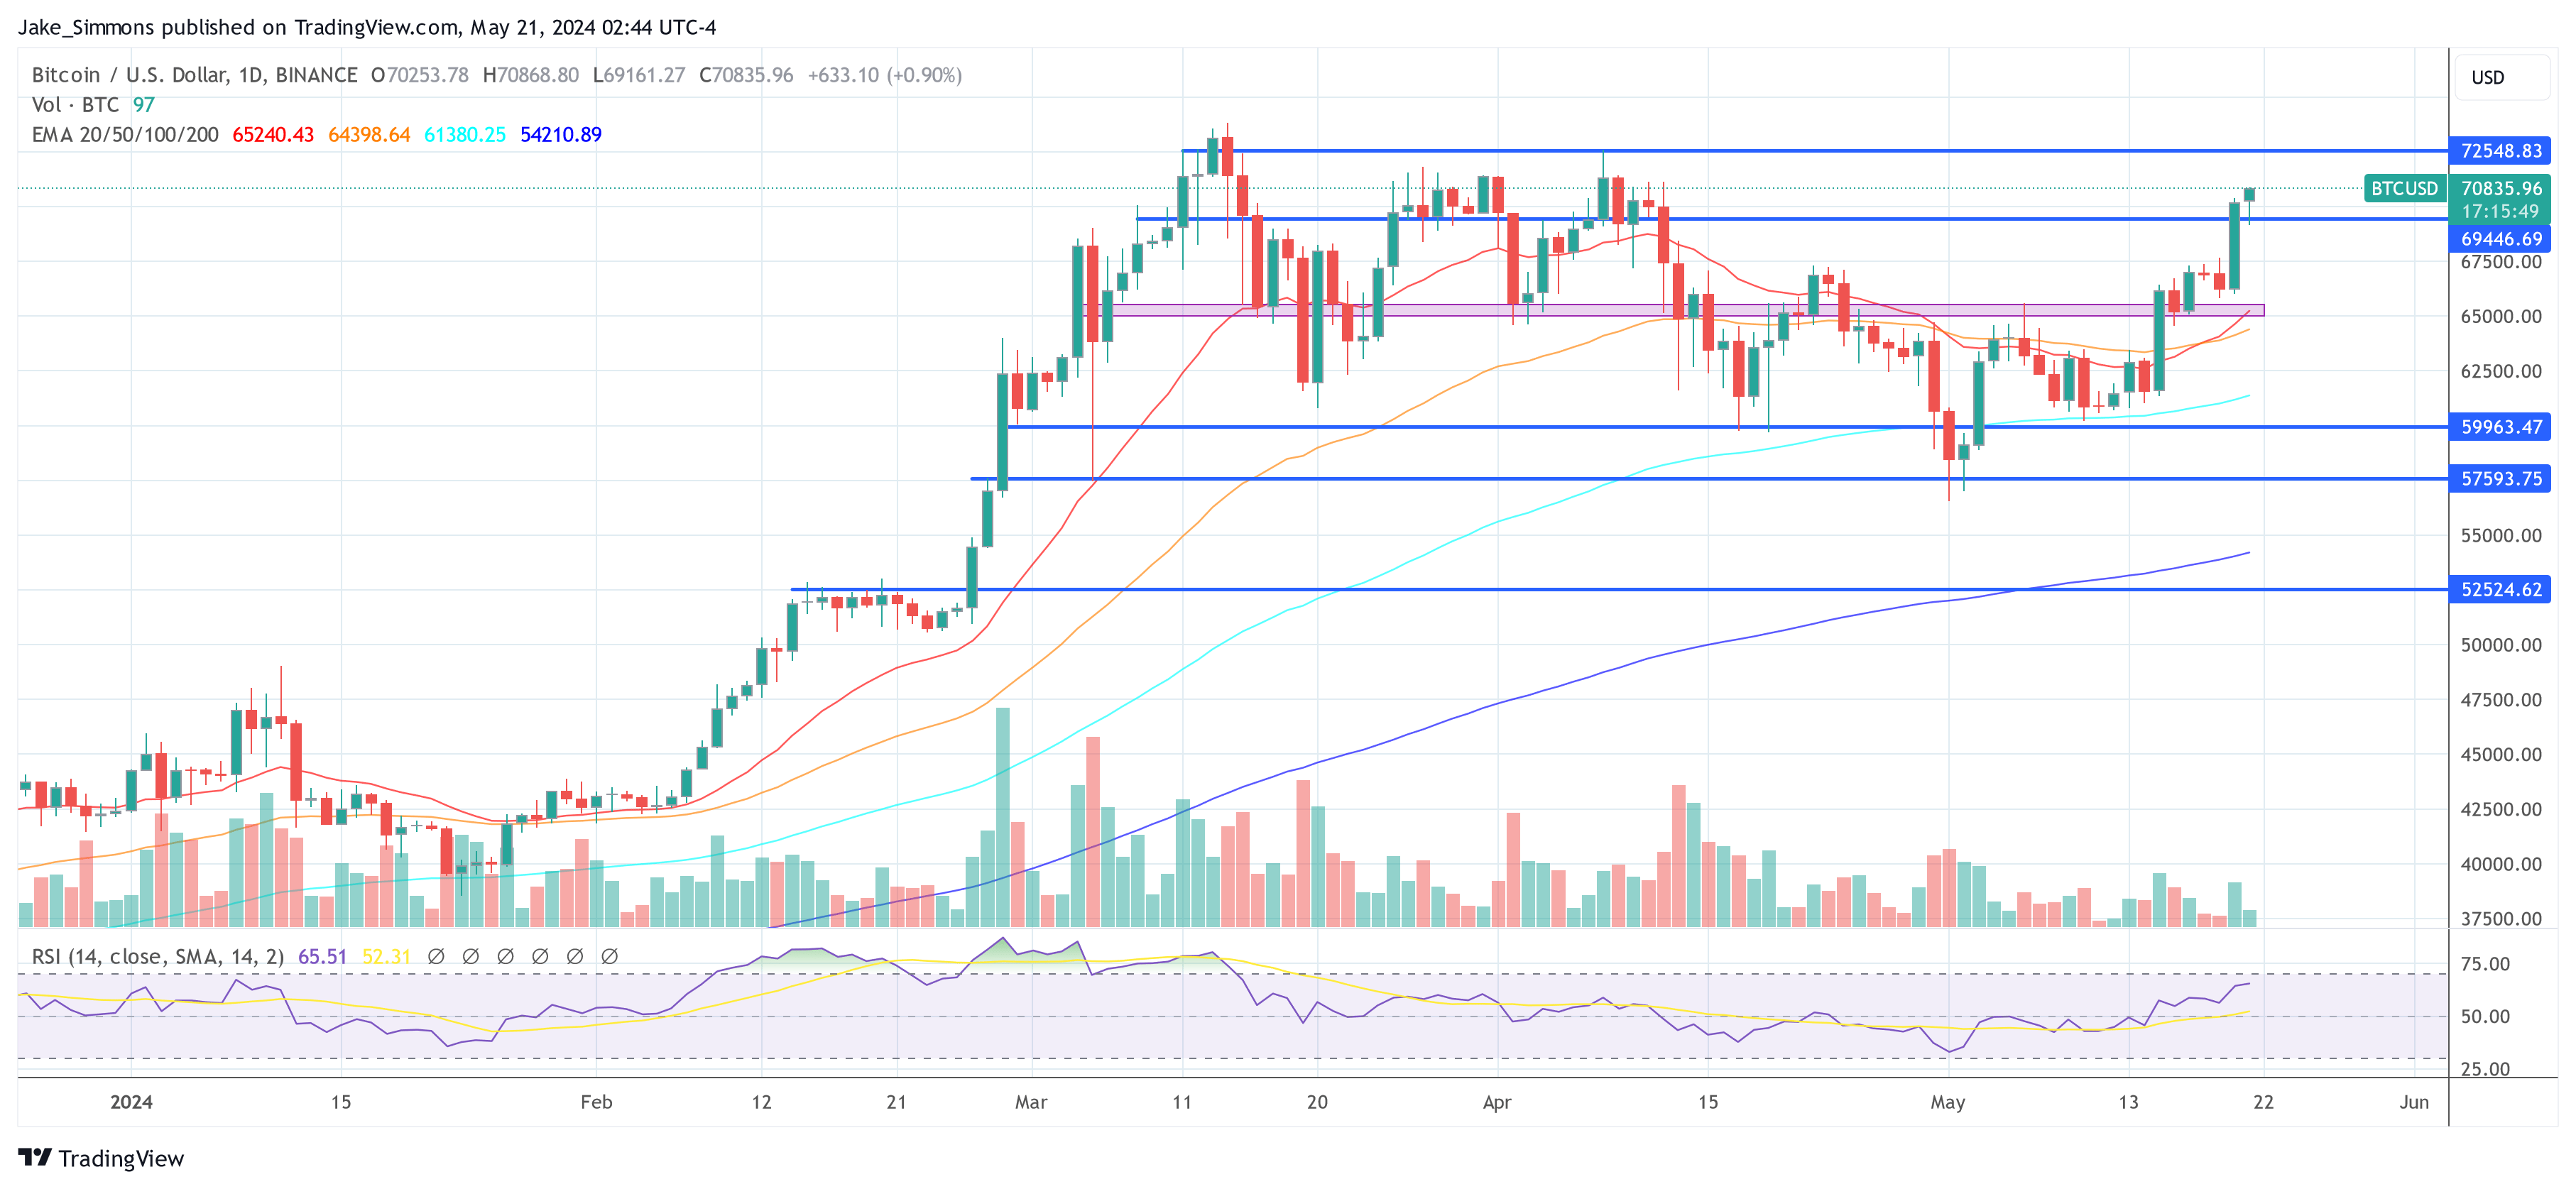
In the current market environment, Bitcoin is nearing a critical resistance level that could set the stage for its next big price movement. Crypto analyst Ali has pointed out that BTC is on the verge of breaking out from a “symmetrical triangle” pattern on the charts.
This pattern, characterized by two converging trend lines, represents a period of consolidation before the price potentially moves in a more decisive direction. Ali suggests that if Bitcoin can sustain a close above the ,330 resistance level, it may quickly ascend to around ,400.
This move would break the recent static trend and signal the beginning of a more substantial rally.
#Bitcoin appears to be breaking out from a symmetrical triangle! A sustained close above the ,330 resistance level could send $BTC to ,400. pic.twitter.com/UrZrJqZdrr
— Ali (@ali_charts) June 3, 2024
Adding to the optimistic outlook, analyst TechDev has provided a comprehensive analysis that supports the potential for an unprecedented breakout. His observations are backed by historical data and technical indicators that align with Bitcoin’s current market activity.
According to TechDev, Bitcoin is exhibiting a pattern that could indicate a major bullish phase. He notes that historically, Bitcoin has experienced significant price increases, known as “blowoff tops,” which have typically been followed by notable corrections.
However, the current scenario is different. Bitcoin did not experience a blowoff top in 2021, which diverges from its historical behavior and suggests a potential buildup to a more sustained price increase.
Impending Bitcoin Supply Squeeze
In support of these technical analyses, the market is also witnessing significant movements in terms of ownership and storage.
Data from BTC-ECHO’s Leon Waidmann reveals that the percentages of Bitcoin and Ethereum held on exchanges are at their lowest levels in years, indicating strong holding behavior among investors.
This decrease in exchange balances and continued accumulation by whales suggest that a supply squeeze could be imminent, potentially driving prices up as availability decreases.
Exchange balances for both #Bitcoin and #Ethereum are at their lowest levels in years!
Whales continue to accumulate. #BTC on exchanges is down to 11.6% and #ETH is at 10.6%!
Supply squeeze incoming.
Get ready for the next big move.
pic.twitter.com/u4j13DZBJk
— Leon Waidmann | On-Chain Insights
(@LeonWaidmann) June 2, 2024


Featured image created with DALL-E, Chart from TradingView
Bitcoin Price Struggles: Can the Leading Cryptocurrency Start Fresh Increase?
Bitcoin price extended its decline below the ,000 level. BTC is now slowly moving lower toward the ,250 support zone in the near term.
- Bitcoin extended its downside correction below the ,000 zone.
- The price is trading below ,500 and the 100 hourly Simple moving average.
- There is a key bearish trend line forming with resistance at ,900 on the hourly chart of the BTC/USD pair (data feed from Kraken).
- The pair could continue to move down unless there is a close above the ,500 level.
Bitcoin Price Dips Further
Bitcoin price extended its downside correction below the ,000 level. BTC bears were able to push the price below the ,000 support. Finally, the price tested the ,000 zone.
A low has formed at ,100 and the price is now consolidating losses. It recovered above the ,5000 level and the 23.6% Fib retracement level of the downward wave from the ,600 swing high to the ,100 low, with a bearish angle.
Bitcoin is now trading below ,500 and the 100 hourly Simple moving average. On the upside, the price is facing resistance near the ,000 level. There is also a key bearish trend line forming with resistance at ,900 on the hourly chart of the BTC/USD pair.
The first major resistance could be ,800 or the 50% Fib retracement level of the downward wave from the ,600 swing high to the ,100 low.
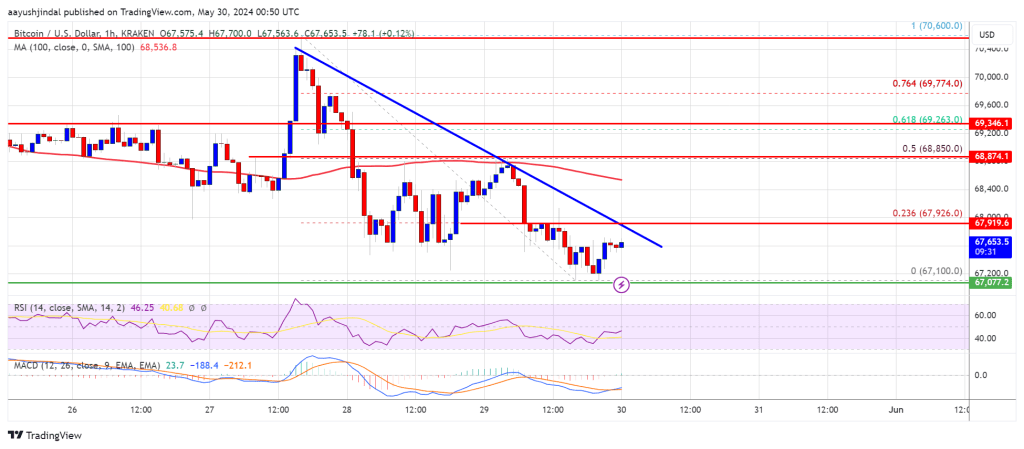
The next key resistance could be ,250. A clear move above the ,250 resistance might send the price higher. In the stated case, the price could rise and test the ,000 resistance. Any more gains might send BTC toward the ,600 resistance.
More Losses In BTC?
If Bitcoin fails to climb above the ,000 resistance zone, it could continue to move down. Immediate support on the downside is near the ,250 level.
The first major support is ,000. The next support is now forming near ,250. Any more losses might send the price toward the ,000 support zone in the near term.
Technical indicators:
Hourly MACD – The MACD is now losing pace in the bearish zone.
Hourly RSI (Relative Strength Index) – The RSI for BTC/USD is now above the 50 level.
Major Support Levels – ,100, followed by ,250.
Major Resistance Levels – ,000, and ,800.
Bitcoin Price Dips Again: Market Fluctuation or Start of a Correction?
Bitcoin price extended losses and traded below ,800 support. BTC is now consolidating and facing hurdles near the ,000 resistance zone.
- Bitcoin extended its decline below the ,800 support zone.
- The price is trading below ,000 and the 100 hourly Simple moving average.
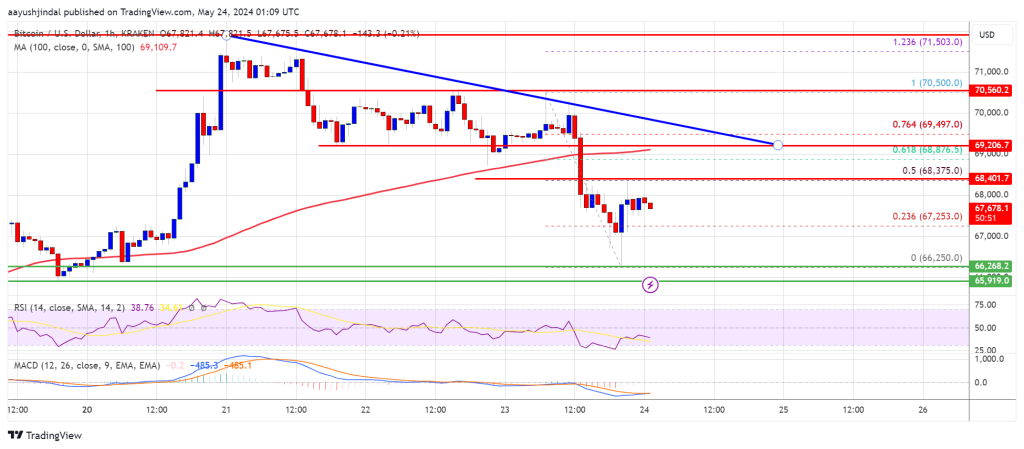
- There is a key bearish trend line forming with resistance at ,200 on the hourly chart of the BTC/USD pair (data feed from Kraken).
- The pair could continue to move done unless the bulls push it back above ,000.
Bitcoin Price Breaks Support
Bitcoin price started a downside correction below the ,000 support zone. BTC bears were able to push the price below major support at ,800. It sparked bearish moves and the price dipped toward ,250.
A low was formed at ,250 and the price is now consolidating losses. There was a minor increase above the ,250 level. The price climbed above the 23.6% Fib retracement level of the downward move from the ,500 swing high to the ,250 low.
However, the bears are active near the ,350 level and the 50% Fib retracement level of the downward move from the ,500 swing high to the ,250 low. Bitcoin price is now trading below ,000 and the 100 hourly Simple moving average.
If there is a fresh increase, the price might face resistance near the ,350 level. The first major resistance could be ,800. There is also a key bearish trend line forming with resistance at ,200 on the hourly chart of the BTC/USD pair.
The next key resistance could be ,000. A clear move above the ,000 resistance might send the price higher. In the stated case, the price could rise and test the ,500 resistance.
If the bulls push the price further higher, there could be a move toward the ,200 resistance zone. Any more gains might send BTC toward the ,800 resistance.
More Losses In BTC?
If Bitcoin fails to climb above the ,800 resistance zone, it could continue to move down. Immediate support on the downside is near the ,250 level.
The first major support is ,800. The next support is now forming near ,250. Any more losses might send the price toward the ,000 support zone in the near term.
Technical indicators:
Hourly MACD – The MACD is now losing pace in the bearish zone.
Hourly RSI (Relative Strength Index) – The RSI for BTC/USD is now below the 50 level.
Major Support Levels – ,250, followed by ,250.
Major Resistance Levels – ,350, ,800, and ,000.
BitMEX Founder Predicts The Dawn Of ‘Crypto Valhalla’: When Will It Start?
In his latest essay titled “The Easy Button,” Arthur Hayes, founder of the crypto exchange BitMEX, delves into the dynamics of global monetary policies and their consequential ties to what he describes as the impending ‘Crypto Valhalla.’ Hayes analyzes the policy maneuvers of the world’s major economies, notably Japan, the United States, and China, and their effects on the crypto landscape.
The Dawn Of Crypto Valhalla
Hayes outlines the Federal Reserve’s potential strategy in coordination with the US Treasury to engage in unlimited dollar-for-yen swaps with the Bank of Japan (BOJ). This measure aims to manipulate exchange rates to stabilize the yen without causing disruptive economic shifts.
Hayes states, “The Fed, acting on orders from the Treasury, can legally swap dollars for yen in unlimited amounts for as long as they wish with the BOJ.” This tactic, according to Hayes, is designed to avert immediate financial crises by deferring hard economic decisions.
The implications for Japan’s economy are stark, with Hayes predicting severe consequences should the BOJ decide to raise interest rates: “If the BOJ raises interest rates, it commits seppuku,” Hayes notes, using the Japanese term for ritual suicide to underscore the potential self-destructive economic impact, given that the BOJ is the largest holder of Japanese Government Bonds (JGBs) and would incur massive losses.
The devaluation of the yen has also significant ramifications for China’s global economic competitiveness, especially in exports. Hayes discusses how a weaker yen harms China’s export economy by making Japanese goods cheaper internationally, directly competing with Chinese products.
He suggests that the People’s Bank of China might respond by devaluing the yuan to maintain competitive balance. “If the yen keeps weakening, China will respond by devaluing the yuan,” Hayes predicts, outlining a potential economic tit-for-tat that could destabilize global markets.
Hayes further theorizes about a dramatic monetary policy shift in China involving its substantial gold reserves. He posits that China could use these reserves to peg the yuan to gold, thereby creating a new economic landscape.
“China is estimated to have stockpiled over 31,000 tonnes of gold […] I believe that for domestic and foreign political reasons, China wishes to keep the dollar-yuan rate stable.” By pegging the yuan to gold, China could potentially insulate itself from currency fluctuations and exert greater control over its economic destiny.
The essay also touches on the intersection of US politics and economic policy, particularly in light of the approaching presidential election. Hayes speculates that domestic economic pressures, such as job losses and the reshoring of manufacturing, could significantly influence the Biden administration’s policy decisions.
He argues that the administration may avoid aggressive moves against China to prevent a backlash in pivotal states: “Biden must win these battleground states to keep the Orange Man at bay. Biden cannot afford a yuan devaluation before the election.”
Hayes suggests that these global currency maneuvers could lead to a bullish scenario for cryptocurrencies. He advises crypto traders and institutional investors to monitor the USDJPY exchange rate closely, asserting that significant movements could indicate shifts favorable to crypto valuations.
“Watch the USDJPY rate closer than Solana devs monitor uptime,” he advises, highlighting the potential for substantial financial opportunities in the cryptocurrency space.On the timing of a potential “Crypto Valhalla,” Hayes speculates that the pace of yen depreciation will accelerate into the fall. “This will put pressure on the US, Japan, and China to do something. The US election is a crucial motivating factor for the Biden administration to come up with some solution.”
According to Hayes, a USDJPY surge towards 200 is “enough to put on the Chemical Brothers and ‘Push the Button.’ This analogy to the Chemical Brothers’ song underscores the urgency and drastic nature of the action required to counter such a currency imbalance.
“If my theory becomes reality, it is trivial for any institutional investor to buy one of the US-listed Bitcoin ETFs. Bitcoin is the best-performing asset in the face of global fiat debasement, and they know it. When something is done about the weak yen, I will mathematically guestimate how flows into the Bitcoin complex will ratchet the price to million and possibly beyond. Stay imaginative, stay boolish, now is not the time to be a cuck,” Hayes concludes.
At press time, Bitcoin traded at ,835.
Bitcoin To $100,000: Infamous Head And Shoulders Pattern Appears To Signal The Start Of Another Rally
Crypto analyst Crypto Jebb recently highlighted an inverse heads and shoulders pattern that had formed on the Bitcoin chart. This bullish pattern indicates another rally may be on the horizon for the flagship crypto, which could send its price to 0,000.
How Could Bitcoin Could Rise To 0,000
Crypto Jebb revealed in a video on his YouTube channel that the inverse heads-and-shoulders pattern he had been predicting for a while had finally formed on the charts. He predicts this pattern could lead to a price breakout, sending Bitcoin’s price to ,000. The analyst also noted that the price target of the bullish pattern is at ,000, which indicates that Bitcoin could hit a new all-time high (ATH) on its next leg up.
Crypto Jebb mentioned that there is a “great degree of likelihood” that Bitcoin would experience a major rally, which would send it to 0,000 should it break its current ATH of ,800. The crypto analyst believes that Bitcoin’s rise to that price level is very likely, considering that it has seen a “pretty large corrective movement” since hitting a new ATH over two months ago.
The crypto analyst warned that there is a scenario where Bitcoin could also end up trading sideways between ,000 and ,000, which would signal a period of consolidation. He noted that Bitcoin could even drop lower during this period. However, Bitcoin’s outlook is generally bullish based on the technical indicators that crypto Jebb highlighted.
The analyst highlighted the Moving Average Convergence/Divergence (MACD), which he noted is turning “very bullish” on the daily chart and shows that the bulls are regaining control. He also claimed that Bitcoin is witnessing a ‘green red green’ formation on the daily chart, indicating that the crypto token is “doing very well.”
BTC Is In “Very Bullish Territory
Crypto Jebb mentioned that Bitcoin is currently in very bullish territory, especially since Altcoins are also rallying. He claims this indicates a “great degree of confidence” in the market at the moment. The crypto analyst also noted that the stock market just broke an all-time high, which he stated is big news for Bitcoin.
He explained that this is big news for Bitcoin because the flagship crypto follows the stock market and moves significantly whenever the stock market experiences a breakout. As such, with the stock market breaking its ATH, he expects Bitcoin to do so soon enough.
Crypto Jebb further explained that the rationale behind Bitcoin following the stock market is that investors are more confident in investing in risk-on assets when they see that the risk-off (the stock market) is doing so well.
Crypto Jebb predicts that Bitcoin will become a risk-off asset in the next ten to twenty years. When that happens, he predicts that hundreds of billions of dollars in investment will be made in the flagship crypto.
Can Ethereum Price Repeat Pattern and Start Fresh Surge To $3,200?
Ethereum price is attempting a recovery wave from the ,865 support. ETH might start a fresh surge if it clears the ,960 resistance zone.
- Ethereum remained stable and attempted a recovery wave above ,900.
- The price is trading below ,950 and the 100-hourly Simple Moving Average.
- There was a break above a major bearish trend line with resistance at ,930 on the hourly chart of ETH/USD (data feed via Kraken).
- The pair could start a major increase if there is a close above the ,990 and ,000 resistance levels.
Ethereum Price Holds Support
Ethereum price traded as low as ,864 and recently started an upside correction, like Bitcoin. ETH was able to rise above the ,900 and ,920 resistance levels. Besides, there was a break above a major bearish trend line with resistance at ,930 on the hourly chart of ETH/USD.
The price even spiked above ,980 and tested ,000. A high was formed at ,992 and the price is now correcting gains. There was a minor move below the ,960 level. The price dipped below the 23.6% Fib retracement level of the recent increase from the ,864 swing low to the ,992 high.
Ethereum is now trading below ,950 and the 100-hourly Simple Moving Average. Immediate resistance is near the ,950 level and another connecting bearish trend line on the same chart. If the bulls push the price and repeat the recent breakout, the price might start another increase.
The first major resistance is near the ,000 level. The next key resistance sits at ,050, above which the price might gain traction and rise toward the ,120 level.
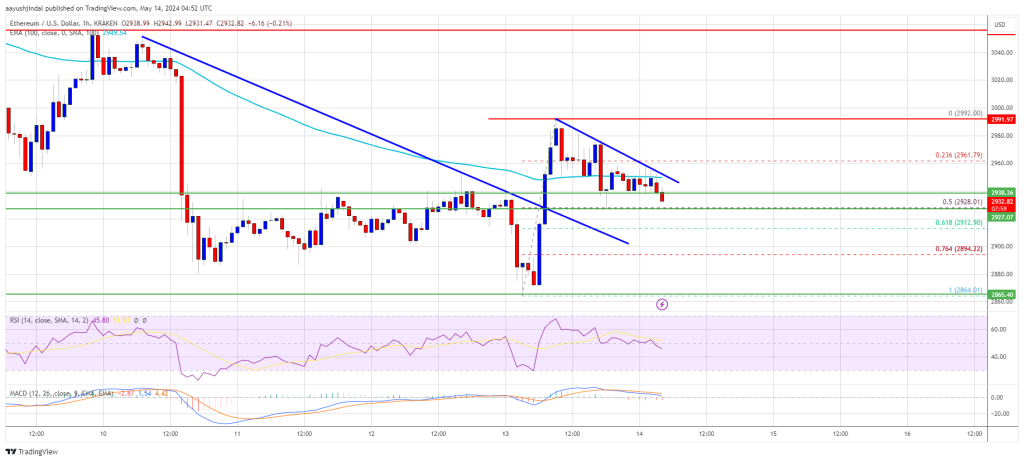
Source: ETHUSD on TradingView.com
If there is a clear move above the ,150 level, the price might rise and test the ,220 resistance. Any more gains could send Ether toward the ,250 resistance zone.
Another Failure In ETH?
If Ethereum fails to clear the ,950 resistance, it could start another decline. Initial support on the downside is near the ,2930 level and the 50% Fib retracement level of the recent increase from the ,864 swing low to the ,992 high.
The first major support is near the ,900 zone. The next support is near the ,865 level. A clear move below the ,865 support might push the price toward ,740. Any more losses might send the price toward the ,650 level in the near term.
Technical Indicators
Hourly MACD – The MACD for ETH/USD is gaining momentum in the bearish zone.
Hourly RSI – The RSI for ETH/USD is now below the 50 level.
Major Support Level – ,865
Major Resistance Level – ,950
Bitcoin.com Announces Launch of Verse Voyager NFTs With Exclusive Airdrop — Public Sale to Start April 24
 Bitcoin.com, a trailblazer in the cryptocurrency domain since 2015, is thrilled to unveil the highly anticipated Verse Voyager NFT collection, which has officially launched with an exclusive airdrop of nearly 10% of the collection’s supply to early community participants. The public sale is scheduled to commence on April 24th at https://voyager.verse.bitcoin.com/, making this innovative series […]
Bitcoin News
Start Selling Bitcoin When This Happens, This Quant Says
A quant has explained that the past pattern in the Bitcoin taker buy-sell ratio metric may suggest the best window to start selling the asset.
Bitcoin Taker Buy Sell Ratio May Reveal Selling Opportunities
In a CryptoQuant Quicktake post, an analyst discussed the trend in the Bitcoin “taker buy sell ratio.” This indicator keeps track of the ratio between the Bitcoin taker buy and taker sell volumes.
When the value of this metric is greater than 1, the investors are willing to purchase coins at a higher price right now. Such a trend implies a bullish sentiment is the dominant force in the market.
On the other hand, the indicator being under the mark suggests the selling pressure may be higher than the current buying pressure in the sector. As such, the majority may share a bearish mentality.
Now, here is a chart that shows the trend in the 30-day moving average (MA) Bitcoin taker buy-sell ratio over the last few years:

As the above graph shows, the 30-day MA Bitcoin taker buy-sell ratio has recently fallen below the 1 level. The quant has highlighted in the chart the region of the metric where the bull run peaks in 2021 formed.
The indicator would appear to dip below 0.97 during both the heights registered in that bull run. According to the analyst, such indicator values suggest the euphoria phase of the market where the smart money starts to sell. Still, the prices continue to hold on as the retail investors continue to FOMO into the asset.
So far, the indicator has approached the 0.98 level in its latest decline, implying that it’s not yet at the levels where the possibility of a top might become significant if the pattern of the previous bull run is anything to go by.
The Bitcoin taker buy sell ratio may also be used as a buying signal, with the 1.02 level being an important level. The quant notes, however, that the metric is better at showing an overbought market than it is for pinpointing oversold conditions.
In other news, as an analyst pointed out in a post on X, all the Bitcoin investor groups have accumulated a net amount of 95,000 BTC (.5 billion at the current exchange rate) over the past month.
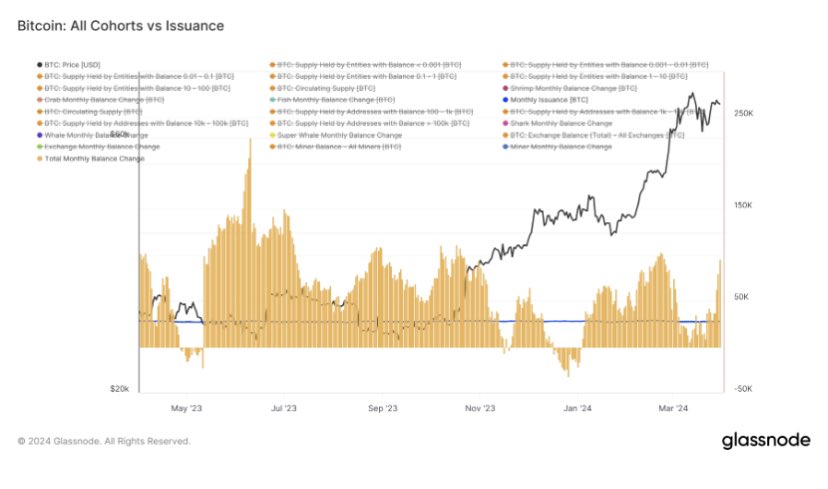
This rapid accumulation suggests that the Bitcoin investor groups have been buying up significantly more than the miners have produced. The chart shows that an accumulation streak of similar levels followed the recent rally in the asset, so this latest one can also be bullish for the asset.
BTC Price
At the time of writing, Bitcoin is trading at around ,600, up more than 3% over the past week.