 A new study has found that crimes enabled by artificial intelligence in the cryptocurrency ecosystem are still in their nascent stages. Stakeholders can prevent these activities from becoming widespread through timely and measured responses. Data from the same study indicate a surge in tokens featuring AI-related keywords such as GPT, Openai and Bard. Approximately 4,500 […]
Bitcoin News
XRP Price Confirms Early Stages Of Bull Market? Data Sheds Light On Recent Rally
Volatility is back in the crypto market as the XRP price and the price of other major cryptocurrencies trend to the upside and into new year highs. The cryptocurrency is heading towards its next resistance level with a high chance of
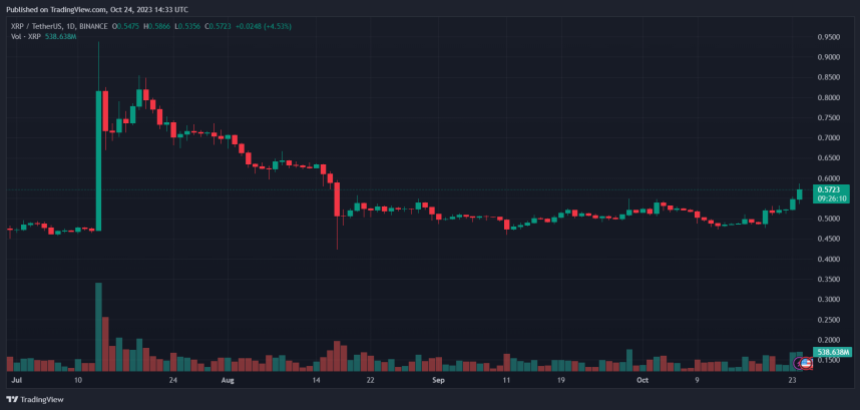
As of this writing, the XRP price trades at .57, with a 9% increase in the last 24 hours. The cryptocurrency recorded a 16% spike in the previous seven days and closely followed Bitcoin and Ethereum’s price action, which recorded a 22% and 16% profit over the same period.
XRP Price On Its Way To Next Critical Level
According to an XRP trader on social media platform X, the token’s price exceeded the critical resistance level of .528. The analyst claims that there is a high chance that the XRP will rise close to .60 in the short term.
In that sense, the trader believes that .66 will operate as the next critical resistance level based on the chart below. The analyst compared the current XRP price with the 2017 bull run.
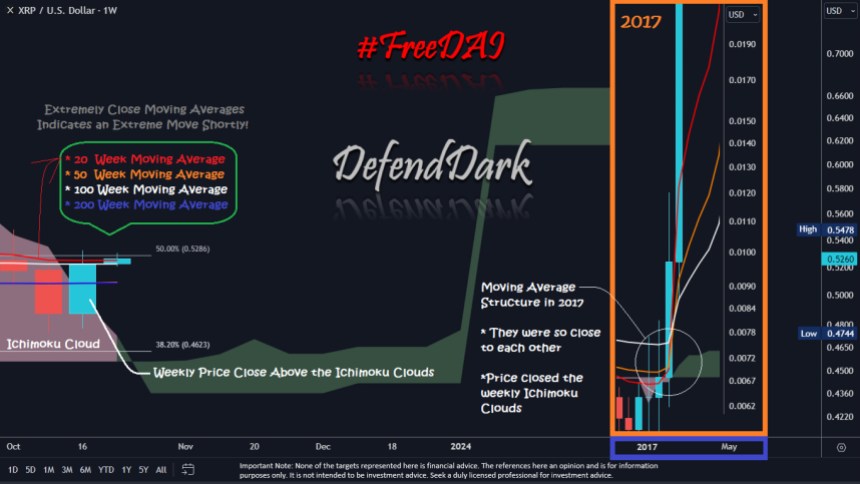
The chart shows that during the 2017 run, XRP closed above the weekly Ichimoku Cloud, a level used to gauge critical resistance and support levels. Once the token broke above that level, it could quickly fall into new highs and price discovery.
The analyst stated the following about the XRP price and its potential to continue its run:
This is not a warning or financial advice, but I would like to share it with you and emphasize how close we are after this weekly close. It seems the weekly Ichimoku close will be above the clouds, and it only happened before the 2017 run and 2021. When it happens, it happens. Be Ready.
Crypto Market Poised For Further Highs
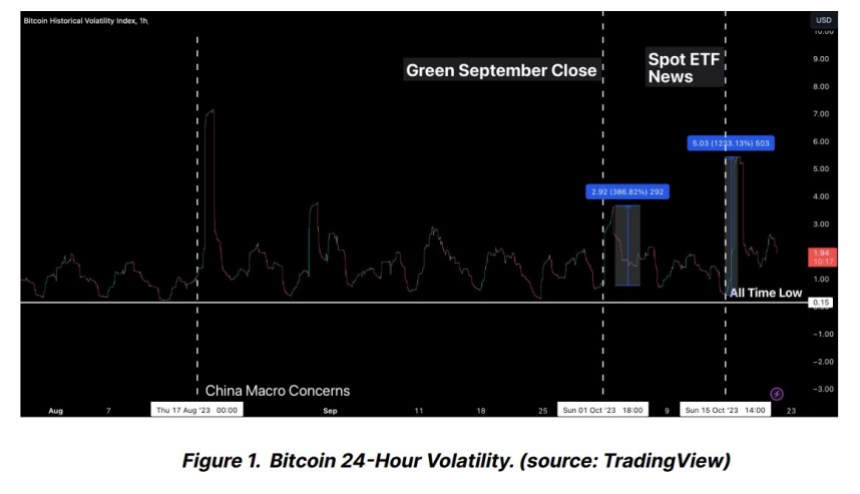
A report from Bitfinex Alpha corroborates the market susceptibility to “new narratives.” In particular, the potential approval of a spot Bitcoin Exchange Traded Fund (ETF) in the US.
As the XRP price and the market continue to rip higher, volatility in the sector is likely to remain high. As seen on the chart below, the crypto has been inching higher and higher with each volatility event (the potential approval of a Bitcoin ETF was the most recent.
In addition, the crypto research firm points to an increase in on-chain activity, which has historically supported higher prices for the sector:
On-chain activity also continues to support the conclusion that higher volatility is here to stay and that it will grow in the coming months. Our analysis of Spent Output Age Bands (SOAB), which track the age of coins when they’re spent, and in particular the “age bands” of UTXOs that are most active, we can discern which group of investors is predominantly influencing market changes. For instance, if the UTXOs aged between three and five years show significant activity, it implies that investors who have held their positions for that time span are the primary movers in the market at that juncture.
Cover image from Unsplash, charts from Bitfinex Alpha, Dark Defender, and Tradingview
Ethereum Price Stages Recovery But Can It Overcome This Key Hurdle?
Ethereum price is eyeing a recovery wave from ,565 against the US Dollar. ETH could rise steadily if it settles above ,600 and ,620.
- Ethereum is attempting a recovery wave above the ,580 level.
- The price is trading above ,590 and the 100-hourly Simple Moving Average.
- There was a break above a major bearish trend line with resistance near ,590 on the hourly chart of ETH/USD (data feed via Kraken).
- The pair could start a recovery wave if there is a close above ,600 and ,620.
Ethereum Price Signals Recovery
Ethereum’s price remained well-bid above the ,565 level. ETH seems to be forming a base above ,565 and is slowly moving higher, like Bitcoin.
The price was able to recover above the ,580 and ,590 levels. There was a move above the 23.6% Fib retracement level of the downward move from the ,669 swing high to the ,565 low. Besides, there was a break above a major bearish trend line with resistance near ,590 on the hourly chart of ETH/USD.
Ethereum is now trading above ,590 and the 100-hourly Simple Moving Average. On the upside, the price might face resistance near the ,600 level.
The next major resistance is ,620. It is close to the 50% Fib retracement level of the downward move from the ,669 swing high to the ,565 low. A push above ,620 might send Ether further higher and there are chances of a steady increase.
Source: ETHUSD on TradingView.com
The next major resistance is near ,650 and ,660. If the bulls succeed in clearing the ,660 hurdle, the price could start a decent increase toward the ,720 resistance. Any more gains might open the doors for a move toward ,800.
Another Drop in ETH?
If Ethereum fails to clear the ,620 resistance, it could start another decline. Initial support on the downside is near the ,580 level.
The next key support is ,565, below which the price could test the ,540 support. If the bulls fail to protect the ,540 support, there could be a sharp decline. In the stated case, there could be a drop toward the ,440 level.
Technical Indicators
Hourly MACD – The MACD for ETH/USD is losing momentum in the bearish zone.
Hourly RSI – The RSI for ETH/USD is now above the 50 level.
Major Support Level – ,565
Major Resistance Level – ,620
Artist Stages Crypto Protest In Front Of US SEC With “Rug Pull” Exhibit
Two years ago, controversial artist Nelson Saiers sparked a debate when he erected a massive inflatable rat outside the US Federal Reserve building in New York; now, the creator takes another jab at a US institution with a new crypto art exhibition.
Crypto Art Exhibition Takes Jab At Scams
According to a release shared with NewsBTC, a crypto art installation was placed in front of the US Securities and Exchange Commission (SEC). This time, Nelson Saiers portrayed a street vendor offering “rug pulls.”
In this latest protest exhibition, Saiers highlighted the crypto-based scam where the team behind a project disappears, leaving their community behind and “holding the bag” for an initial investment. The exhibit aimed to showcase the “ease” of these illegal activities.
Moreover, by setting the crypto art exhibit in front of the SEC, the artist potentially tried to send a message to the regulator: “rug pulls” happened right in front of the institution, seemingly without consequence.
This is the latest, but far from the only art exhibition where Saiers takes a hit on the US SEC and other financial regulators. As mentioned, the artist set an inflatable Bitcoin rat at the Fed’s building in 2020 and 2018.
A few months later, as the crypto market was experiencing a bull run that took the price of Bitcoin into uncharted territory, Saiers called cheap on the Fed with his “Cheap Money is Out-of-Order.” During this exhibition, which saw the sculpture of the Wall Street Bull interfered with a Saiers-made sculpture, the artist criticized the inflationary measures adopted by the financial institution.
Based in New York, Saiers completed a Ph.D. in mathematics and is a former trading group manager for Deutsche Bank AG and Chief Investment Officer for Saiers Capital. In art, Saiers is known as the “Warhol of Wall Street.”
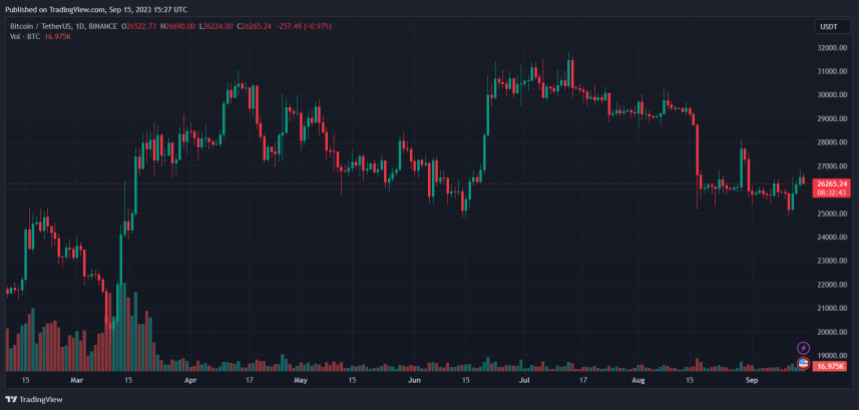
As of this writing, Bitcoin trades at ,200 with sideways movement across the board. The cryptocurrency has been unable to break above or below its current trading range and will likely continue this trajectory until late September.
At that time, macro-economic forces will likely come back into the picture, stirring volatility into the market. In particular, the spot Bitcoin Exchange Traded Fund (ETF) narrative, mainly in the hands of the SEC, is bound to influence the price of the number one crypto by market cap.
Cover image from Unsplash, chart from Tradingview
Solana Price May Fall To $21 Before It Stages Another Recovery
Over the last week, the price of Solana has risen. During the same time frame, SOL surged close to 17%. Although the bulls were in the market, SOL was not entirely out of the woods. The price was dragged to the mark recently after the bears attempted to drag the price down.
The technical outlook of Solana depicted that the bulls were present on the one-day chart. Buying strength registered an increase as demand also moved up. With demand going north, accumulation also noted a positive change.
The asset’s price must remain above the support level; otherwise, a fall through that price mark will bring the bears back in full force. As Bitcoin tries to break past the ,500 level, other altcoins also attempt to target their immediate price ceiling.
The movement of the king coin will determine the price direction of other altcoins. The volatility of the SOL price will start declining once the demand for the altcoin stabilizes over the upcoming trading sessions.
Solana Price Analysis: One-Day Chart
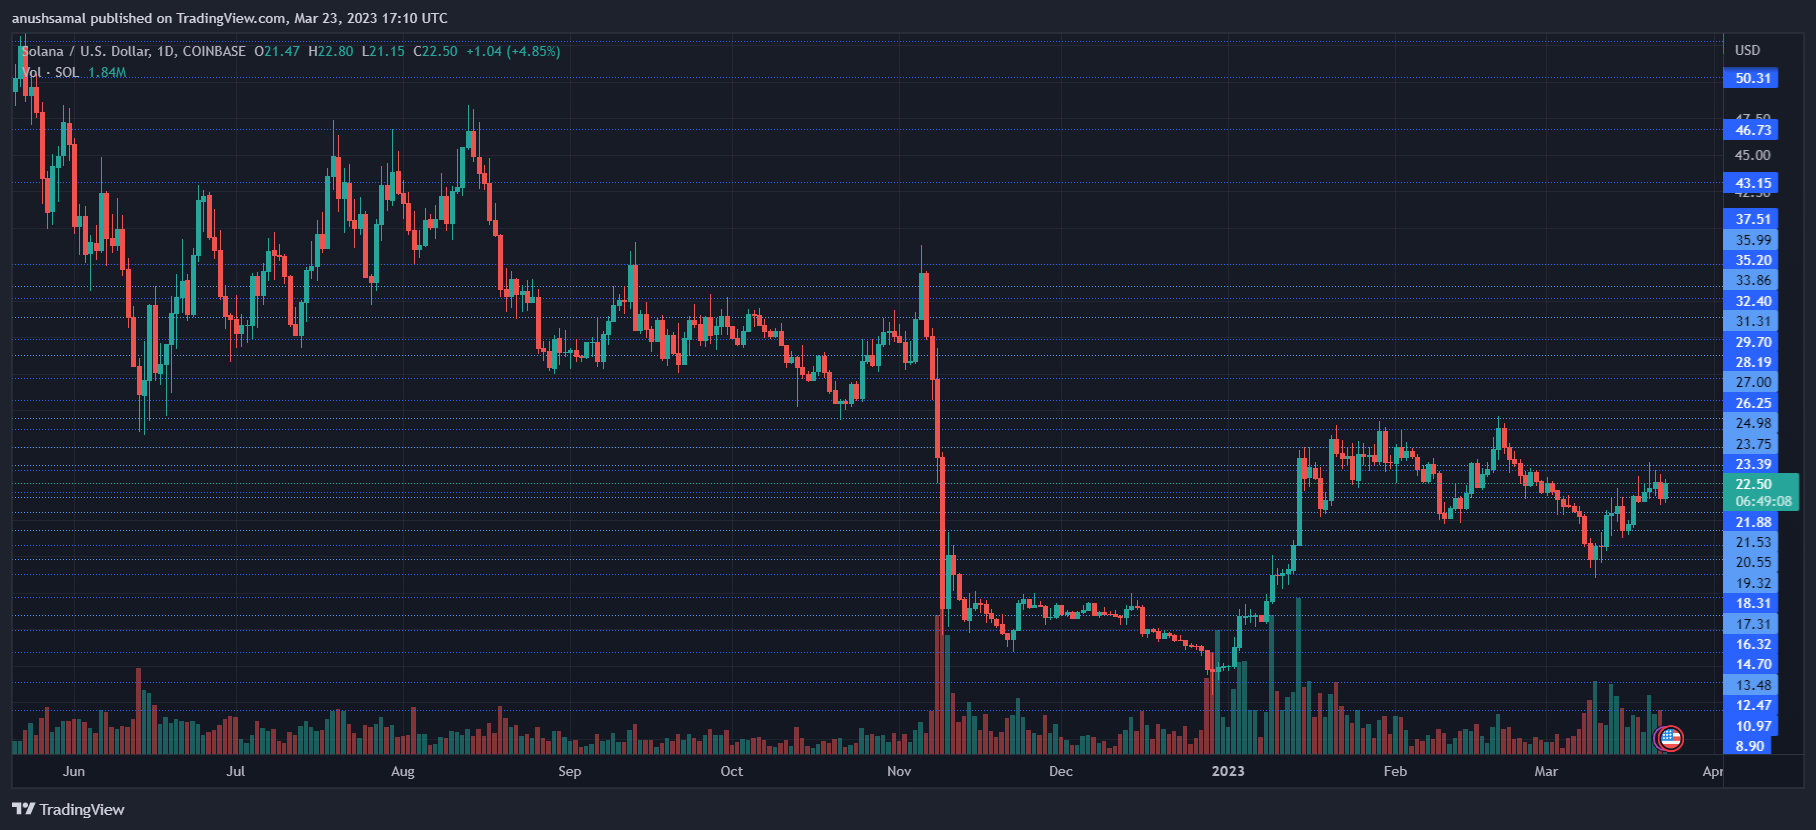
SOL was trading at .50 at the time of writing. Over the past trading sessions, however, the bears dragged the price to the crucial support line of .50. The local support level for the coin was .
The price level has acted as a propelling point for the altcoin, so another dip to this level might shoot the price to or above. The inability to sustain a price above will bring SOL to .
On the other hand, overhead resistance for SOL was at .40; breaching past that will push the price to . This level may act as strict resistance for the altcoin.
Technical Analysis
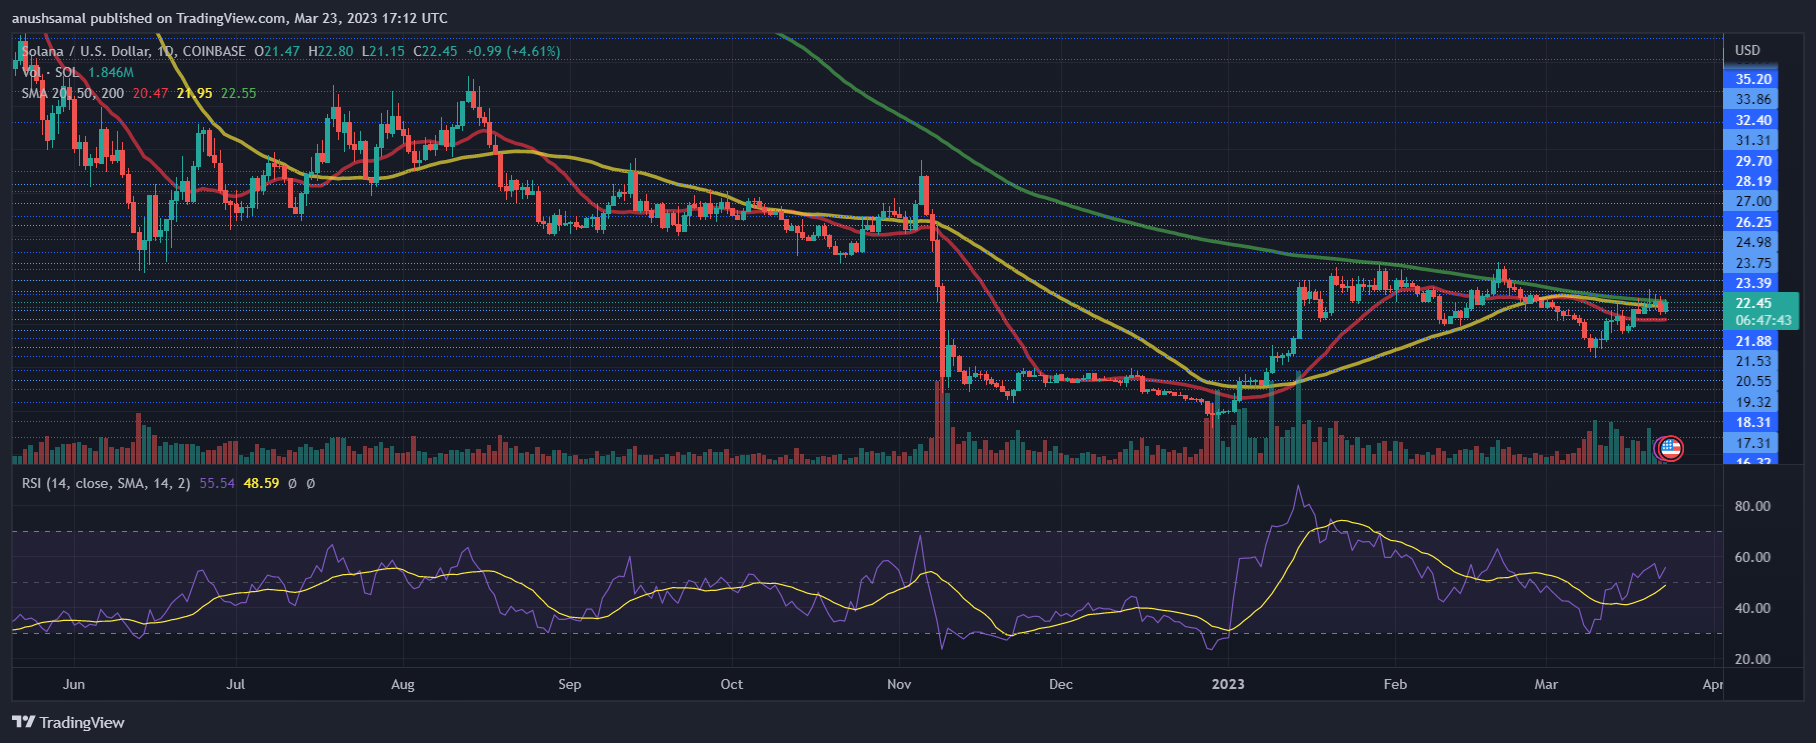
SOL has depicted a recovery in buying strength over the last trading session. The Relative Strength Index noted an uptick and moved near the 60-mark, meaning the buyers were in charge of the market. Similarly, with increased demand, SOL moved above the 20-Simple Moving Average (SMA) line.
This indicated that buyers were driving the price momentum in the market. SOL price is standing at a crucial point because a slight push from buyers will take the altcoin above the 50-SMA and 200-SMA lines, respectively. That would be a sign of increased bullishness.
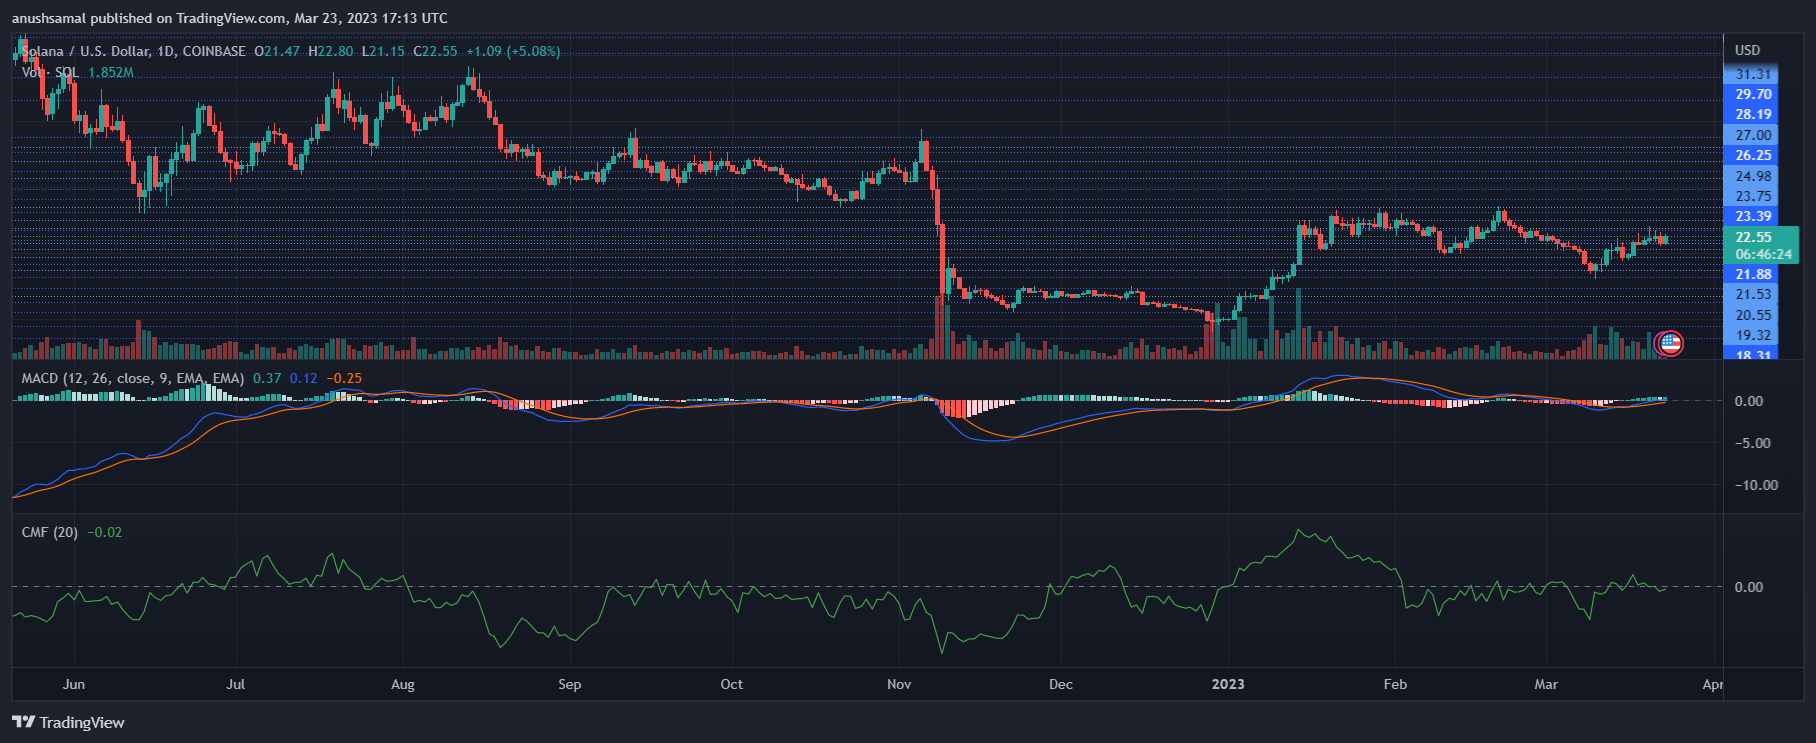
The Moving Average Convergence Divergence depicts the price momentum, which turned positive. The green histograms were related to buy signals for the altcoin. Buyers’ interest also grew as SOL remained bullish in the past few days.
This usually means that there could be an upward increase in price over the next trading session. The Chaikin Money Flow reads the capital inflows and outflows at a given time. The indicator noted a small uptick pushing the capital inflows into the positive zone.
Crypto Market Is Still In The Early Stages, Says Ric Edelman
Famed finance author Ric Edelman has said that crypto is still in the very early stages, comparing it to the internet right before the big boom. The crypto market which is a little over a decade old has grown exponentially in its short time in existence. At its highest, the market grew to trillion surpassing the valuation of some of the most valuable companies in the globe. Despite this growth, the market still has a lot of growing to do and Edelman believes this is only the beginning.
Comparing Crypto To The Internet
It is estimated that there are 130 million users of the crypto market currently. This number has grown from the previous years but still remains a tiny fraction of the world’s population who are yet to come into the market. Edelman, speaking with CNBC, explained that the crypt market now is similar to what the internet was 20 or 30 years ago in its growth pattern.
Related Reading | Jack Dorsey Launches Bitcoin Defense Fund To Aid Devs Facing Litigation
This is not the first time that the space would be compared to the growth of the internet. The growth pattern of crypto has closely mirrored that of the internet, albeit at a faster pace, and if history is to be followed, then the next five years could very much see explosive adoption for cryptocurrencies.
Edelman continues on to say that crypto is an innovative technology that is allowing businesses to operate faster, which is what is driving the adoption of the digital assets. Basically, the market is still in its early innings and is yet to see real growth.
“This is really like the internet back 20 or 30 years ago. We have to recognize that this only comes along once in a generation,” Edelman told CNBC. “The innovative technology is allowing businesses to operate faster, cheaper with greater transparency, greater security, and this is why businesses are falling over themselves with development of blockchain technology.”
Cryptomarket recovers above trillion | Source: Crypto Total Market Cap on TradingView.com
Getting Ready For Explosion
With the growth of crypto strongly correlating with that of the internet, Edelman places the current growth of the market at where the internet was in the 1990s. Recall that the internet did not really take off until the late 90s, where it became the ‘thing’ to have. For crypto, it is nearing this point.
“We now have the benefit of experience. We know how the internet just exploded in growth through the 1990s. That’s where we’re at today – incredibly early for the investors who are recognizing the opportunities that aren’t going to exist 10 or 15 years from now the way they exist today.”
Related Reading | Highlighting Risk: These Crypto Coins Carry The Most Leverage
Additionally, Edelman adds that if blockchain technology can be implemented by the Transportation Department which has nothing to do with the movement of money, it shows the broad and significant value of the technology.
The crypto market has now recovered to the trillion mark after a series of crashes and dips that rocked the space. As digital assets begin another recovery trend, this number will continue to rise.
Featured image from Daily Advent, chart from TradingView.com
NewsBTC
TA: Ethereum Stages Major Rally, Why ETH Could Revisit $4K
Ethereum started a strong rally and it cleared ,500 against the US Dollar. ETH price even climbed above ,800 and it could rise further towards ,000 in the next few days.
- Ethereum started a major increase above the ,500 and ,650 resistance levels.
- The price is now trading above ,700 and the 100 hourly simple moving average.
- There is a key bullish trend line forming with support near ,600 on the hourly chart of ETH/USD (data feed via Kraken).
- The pair could dip in the short-term, but it might find bids near ,680 or ,620.
Ethereum Price Extends Rally
Ethereum remains in a strong uptrend above the ,500 pivot level. ETH gained pace and it was able to surpass the ,650 resistance level. The price even surpassed ,750 and settled well above the 100 hourly simple moving average.
Finally, there was a break above ,800 and the price tested the ,840 zone. A high is formed near ,843 and the price is now correcting lower. It traded below the ,800 level.
There was a break below the 23.6% Fib retracement level of the upward move from the ,520 swing low to ,843 high. Ether price is now consolidating near the ,750 level. It is also trading well above ,700 and the 100 hourly simple moving average.
Source: ETHUSD on TradingView.com
There is also a key bullish trend line forming with support near ,600 on the hourly chart of ETH/USD. An immediate resistance on the upside is near the ,800 level. The first major resistance is near the ,850 level. If there is a clear break above the ,850 level, the price could accelerate higher towards the ,900 level. The next main resistance is near the ,000 level.
Dips Limited in ETH?
If ethereum fails to continue higher above the ,800 and ,850 resistance levels, it could start a downside correction. An immediate support on the downside is near the ,700 level.
The next major support is now forming near the ,680 zone. It is close to the 50% Fib retracement level of the upward move from the ,520 swing low to ,843 high. A downside break below the ,680 zone could lead the price towards the trend line support at ,600.
Technical Indicators
Hourly MACD – The MACD for ETH/USD is slowly losing pace in the bullish zone.
Hourly RSI – The RSI for ETH/USD is correcting lower from well above the 70 level.
Major Support Level – ,680
Major Resistance Level – ,850
Bitcoin Accumulation Patterns Shows Rally Might Only Be In Its Early Stages
Bitcoin accumulation patterns continue to point to the fact that the recent rally might not be ending anytime soon. Investors have continued to hoard assets as the volume of bitcoins sent to exchanges to be sold off or traded falls below the accumulation rate.
Outflows from exchanges have continued to exceed inflows into exchanges. Signaling accumulation patterns rather than sell patterns.
Related Reading | On-Chain Expert Predicts 2K Bitcoin Peak This Cycle
Wednesday saw the price of bitcoin dropping below ,000 to be trading in the ,000 range. Inflows of 11.3K BTC to exchanges correlated with this drop in price. But then the next two hours following this price dip saw more outflows of bitcoins from exchanges. 19.3K BTC were removed in the next two hours following the price dip. Showing investors were accumulating their coins rather than selling.
Exchange Reserve Volumes Continue to Plummet
Outflows from exchanges to personal wallets for safekeeping continue to be on the rise. Bitcoin exchange reserve volumes have seen decreasing numbers following the price crash from the all-time high, and the number has continued to go down. More coins leaving the exchanges than coming in shows that there is currently no selling pressure. Thus, accumulation is the order of the day as investors try to get their hands on as many coins as they can.
Related Reading | Bitcoin Set To Outperform In Second Half Of 2021, Bloomberg Analyst
Just over a week ago, a report from CryptoQuant showed that the volume of BTC currently held on exchanges dropped over 100K in just the span of two days. Numbers like these often indicate that there is significant buy pressure in the market. And buy pressures usually lead to accumulation, which in turn drives the value of the asset higher.
Top exchanges continue to see large volumes of BTC leaving their exchanges on the daily. Centralized exchanges like Binance and Coinbase have seen the highest number of Bitcoins moved out of their exchange.
Related Reading | Bitcoin To Surpass 0,000 In A Year, Says Pantera CEO
Investors continue to see the merit in investing in cryptocurrencies like BTC. Indicators show that general market sentiment continues to buy and hold. So, these investors are going to continue to buy as many bitcoins as they can, and hold these coins in wait for bull rallies.
Bitcoin Continues To Move Forward
Bitcoin continues to see favorable outlooks despite the price taking hits in the market. Following El Salvador’s lead, as they make BTC a legal tender, Uruguay recently proposed a bill to also make the cryptocurrency legal tender in the country.
Megabanks JP Morgan and Wells Fargo have both announced that their high-net-worth clients would have access to investment options that would provide them exposure to the crypto market. Hopefully leading to the opening of these investment options to the rest of the general public.
BTC price close to testing K resistance point | Source: BTCUSD on TradingView.com
Market analysts continue to see bullish movements in the price of the asset. With on-chain data analysis showing that daily transaction volumes are up following the recent price rally.
With so many bullish indicators, it is no stretch to think that the rally might just be beginning. Bitcoin still may be able to break K before the year runs out if these indicators are anything to go by.
Featured image from Flickr, chart from TradingView.com
NewsBTC
Analyst Sees Ethereum in “Reversal Stages” as Price Dips 20%
Ethereum is on the track of registering more losses eves as it trades 196 percent higher on a year-to-date timeframe.
A pseudonymous analyst highlighted a string of technical and fundamental catalysts that could push the second-largest crypto lower. He first noted that ETH/USD is repeating a market setup from the mid-2019, wherein the pair early rallied strongly but then pared a majority of its gains.

ETH/USD cycle from 2019 showing its massive downside correction following a major rally. Source: TradingView.com
Ethereum performed strongly in 2020, especially in the aftermath of March 2020’s global market rout led by the fast-spreading COVID-19 pandemic. Its gains surpassed even that of Bitcoin, the top cryptocurrency, because of its parent blockchain’s growing involvement with the booming stablecoin and decentralized finance sector.
But more recently, ETH/USD showed signs of bullish exhaustion. The pair corrected lower by as much as 36.6 percent from its YTD high at 8.95. It attempted to bounce back but a strong selling pressure near the 5-400 area kept its bullish retracement tryouts under wraps.
The pseudonymous analyst eyed the repeated pullbacks from the said range as a signal of the beginning of bearish momentum. He said that Ethereum has topped out already in August 2019, and is now amid “reversal stages,” just like it was in 2019.
Adding further, the analyst pointed out the catalysts behind his bearish bias for the Ethereum market.
Higher Fees
Ethereum fees are “dangerously high,” said the analyst as the gas prices on the cryptocurrency’s blockchain network shot past 700 gwei this Thursday. The average gas fee runs around 490 gwei, while the market considers 540 gwei as “too high.”
Higher transaction costs reduce a blockchain’s appeal among developers and project handlers alike. In Ethereum’s case, the industry is waiting for the blockchain to switch from proof-of-work to proof-of-stake in the coming months.
The migration expects to reduce its transaction fees and delays.
Nevertheless, other projects are rivaling up to offer an alternative to Ethereum’s gas costs. At the beginning of September, the Binance exchange launched a new Ethereum-compatible Binance Smart Chain to mark a direct competition with the PoW blockchain.
Binance CEO Changpeng Zhao openly invited decentralized finance projects to migrate from Ethereum to their chain.
Of course, love to see moe DeFi projects migrating over, and lessen the load on ETH, and hopefully, reduce the gas fees there a little too.
— CZ Binance (@cz_binance) September 13, 2020
The announcement helped Binance’s native cryptocurrency, BNB, surge higher by 76 percent tops. Binance Chain now DeFi projects, BurgerSwap and SushiSwap, on its chain.
Bearish Ethereum Technicals
As its rivalry with other blockchain projects grew, Ethereum also faced risks in the form of bearish technicals.
The pseudonymous analyst spotted a divergence between ETH/USD price and momentum oscillator. In retrospect, the pair rose higher and left behind a trail of higher highs. Nevertheless, its momentum indicators – the Relative Strength Indicator and the Moving Average Convergence Divergence – formed lower highs.

The price chart of Ethereum. source: CryptoHamster
The analyst also noted a steady decline in the daily trade volumes in the Ethereum market, signaling that fewer traders are actively involved in the buying and selling of the ETH tokens.
He expected ETH/USD to fall towards 0 in the coming session.
Maker (MKR) Stages Bull Run on $14M Liquidity Wipeout
The price of Maker (MKR) crypto tokens surged by an impressive 16 percent in just four hours this Wednesday.
The twenty-fifth largest blockchain asset by market cap hit a seven-month high to 7. The move uphill came as MKR’s liquidity on Uniswap Exchange dropped from million to million, leading to a supply deficit. Financial data analysts at Token Terminal noted that the liquidity wipeout made MKR market thinner and, in turn, “easier to pump.”
1. $MKR @UniswapExchange liquidity suddenly dropped from M to M.2. $MKR price is up 16% in the last 24 hours.
This is a bit strange. What is going on?
— Token Terminal (@tokenterminal) February 19, 2020
Playing Defensive
But what led whales to make MKR scarcer resulted in multiple theories on social media. Some feared whale manipulation while others looked it as an exercise to protect Uniswap against a potential collateral hack.
Token Terminal noted that MakerDAO might have removed the liquidity to repel attackers from getting access to a more massive amount of MKR tokens. The firm earlier was made aware of a bug that could allow anybody holding approximately 52,000 MKR to create new executive contracts and transfer all collateral from Maker to their account.
MakerDAO, in response, introduced a 24-hour governance delay to its protocol in December 2019. A vote concerning the same is about to take place on the coming Friday.
“Removing liquidity from the markets can also be to protect MakerDAO before the 24-hour governance delay is implemented. Less liquidity in DeFi means there’s not enough to borrow for an attack. The higher price makes it more difficult to accumulate the required MKR.”
High MKR price and less liquidity in defi make a governance attack more difficult.
— latetot.eth (@latetot) February 19, 2020
What’s Next for Maker?
The liquidity removal – be it an attack or defensive exercise – came only days after hackers made 0,000 out of a self-initiated million ETH loan, also involving UniSwap Exchange.
1/ Due to the complexity of the transaction, providing a comprehensive accounting of the losses will require additional time. This was not a simple Uniswap attack, and we do not use Uniswap as an oracle.
— bZx (@bzxHQ) February 15, 2020
A Twitterati noted that MakerDAO merely took cues from the flash loan attacks and decided to unplug a large part of its liquidity, in response. Excerpts:
“Removing liquidity seems like a clear attempt to prevent a flash loan attack. Why would you think that the liquidity on Uniswap was there to “avert an attack”?
Overall, the market remained clueless about what led to the MKR price pump. The cryptocurrency, meanwhile, plunged by 3.5 percent after hitting its 2020 high. It is likely to trend in the same corrective direction for the rest of the day purely on profit-taking sentiment.
NewsBTC