 Over the past 19 days, the stablecoin economy has stabilized with negligible growth after reaching the 0 billion threshold at April’s end. Out of the top five, FDUSD is currently the frontrunner in terms of 30-day growth, showing a 15.3% increase in supply. Stablecoin Valuation Holds Steady With Little Growth Following a period of rapid […]
Bitcoin News
Bitcoin Stabilizes Over $42,000 as Crypto Fear and Greed Index Shifts to Neutral

Recently fluctuating within the realms of “greed” and “extreme greed,” the Crypto Fear and Greed Index transitioned into a “neutral” phase on Sunday, Jan. 28, 2024. This shift coincides with bitcoin’s value jumping slightly over ,000. In the preceding week, bitcoin experienced a subtle rise, approximately 1.5%, in comparison to the U.S. dollar.
From Greed to Neutrality — Market Sentiment Cools
Bitcoin’s value currently stands at ,478 per coin, exhibiting an intraday fluctuation from ,396 to ,824 per unit. As of Sunday, the foremost cryptocurrency’s market capitalization slightly exceeds 3 billion, coupled with a global trade volume of .33 billion. In the broader .715 trillion crypto economy, BTC’s dominance is marked at 48.6%.
Over the course of this weekend, the Crypto Fear and Greed Index (CFGI) hosted on alternative.me observed a shift from “greed” to “neutral” between Saturday and Sunday. In the past month, the index has consistently been in the realms of “greed” and “extreme greed.” Specifically, on Jan. 9, 2024, a surge in BTC’s price resulted in the highest reading of “extreme greed” on the Crypto Fear and Greed Index (CFGI) since 2021.
As recently as last week, the CFGI remained in the “greed” territory, registering a score of 56 out of 100. This sentiment persisted into yesterday with a slightly lower score of 55 out of 100, still within the “greed” category. However, the index for Sunday, Jan. 28, 2024, recorded a score of 54 out of 100, categorizing the day as “neutral.” The CFGI evaluates market sentiment by analyzing factors like volume, market momentum, volatility, dominance, social media, and other trends.
On Bitstamp’s BTC/USD chart for Sunday, there was a significant peak at ,824. Post this spike, the price began a consolidation phase, characterized by smaller fluctuations and reduced volume, indicating a state of equilibrium in the market following the recent increase in the crypto asset’s value. Mirroring the CFGI, BTC’s oscillators and moving averages (MAs) also reflect a period of neutrality and balance, with traders poised for the next significant movement.
What do you think about the latest CFGI metric for bitcoin? Share your thoughts and opinions about this subject in the comments section below.
Ethereum Technical Analysis: ETH Stabilizes in a Narrow Range

Today’s trading session commenced with ethereum oscillating between ,480 and ,532 in the past hour, enclosed within a daily range of ,472 to ,544. This restricted range hints at a brief stabilization period after a spell of recent market swings. Ethereum maintains a strong market capitalization of 5 billion and a noteworthy trade volume of .11 billion, reflecting its considerable market influence, especially after the recent endorsement of 11 spot bitcoin exchange-traded funds.
Ethereum
Monday’s technical indicators offer a multifaceted perspective. The relative strength index (RSI) at 60.6 leans toward a neutral to bullish outlook. In a similar vein, the Stochastic at 69.8, the commodity channel index (CCI) at 92.0, and the average directional index (ADI) at 19.1 all mirror a neutral market view. Yet, the awesome oscillator at 241.3 and the moving average convergence/divergence (MACD) at 78.8 suggest a positive market trend, indicating a potential underlying bullish drive.
The trend suggested by moving averages (MAs) also leans toward bullish sentiments in the ether market. The exponential moving average (EMA) and simple moving average (SMA) across various time frames (10, 20, 30, 50, 100, 200) uniformly indicate an upward market trend, showcasing a strong, recent bullish trajectory. Notably, the EMAs in shorter durations surpass their SMA counterparts, signaling a rapid adaptation to recent price shifts, thus reinforcing the bullish trend.
Ethereum’s daily chart illustrates an unmistakable ascending pattern with progressive price increases and higher lows, signifying a consistent positive trend in ETH markets. The significant drop on Jan. 11, followed by a rebound on Jan. 12, however, signals a possible recalibration or stabilization after a pronounced upward movement. This pattern advises traders to exercise caution and consider reassessing the bullish trajectory.
Zooming in on the hourly chart, a detailed view of ethereum’s (ETH) price dynamics is observed. This chart displays a recent upward trend marked by successive higher highs and lows, though it has been subject to notable fluctuations since Jan. 11, 2024. These hourly changes underscore the importance of precise timing for entering and exiting trades in short-term trading, especially given the clear volatility.
In the 4-hour chart, which smooths out the hourly variations, a more coherent view of ethereum’s medium-term trend emerges. It showcases the current resilience of ethereum, as evidenced by its recovery from recent dips. This recovery suggests a potentially opportune moment for market entry, particularly if the price shows signs of a bullish continuation pattern or rebounds off key moving averages or trendline support. However, traders should remain alert to any indicators of a weakening trend.
Bull Verdict:
The prevailing data from the 1-hour, 4-hour, and daily charts for ethereum (ETH) on Jan. 15, 2024, conveys a robust bullish sentiment. The combination of sustained buying pressure, as indicated by moving averages and oscillators, alongside a stable market capitalization, points towards an upward trajectory for ethereum.
Bear Verdict:
Conversely, a bearish perspective might interpret the same data with caution. Despite the bullish indicators, the narrow trading range and the neutral stance of some oscillators could suggest a potential market saturation or a forthcoming correction. ETH traders with a bearish outlook may see this as a signal for potential profit-taking or reallocation of assets, anticipating a possible downturn or stagnation in ethereum’s price in the near future.
Register your email here to get weekly price analysis updates sent to your inbox:
What do you think about ether’s market action on Monday morning? Share your thoughts and opinions about this subject in the comments section below.
Shiba Inu Price Stabilizes As Marketing Lead Teases Upcoming ‘Journey’
Amidst waves of volatility in the crypto market, the Shiba Inu price seems to be stabilizing. Meanwhile, Lucie, the marketing manager of Shiba Inu, provided important insights into the upcoming developments when she revealed the roadmap for the anticipated “journey”.
The Upcoming “Shibarium Journey”
In her most recent tweet, Lucie expressed the magnitude of the upcoming Shibarium journey. She stated, “Embarking on the Shibarium journey is a big task that demands a lot of time and commitment. Our goal is to create outstanding decentralized applications (dApps) that people will love and use.”
Elaborating on the roadmap, Lucie delved into the multifaceted strategy Shiba Inu plans to deploy. She highlighted the significant plans in store for the development of the project’s tokens, SHIB, BONE, and LEASH. Lucie underscored the goal to ensure that these tokens are “not only valuable but also have a strong utility within our ecosystem.” Such enhancements are hoped to draw in more users and investors, thereby amplifying benefits for the Shiba community.
On the topic of decentralized applications, Lucie emphasized their focus on creating “exceptional dApps that will revolutionize the decentralized world.” According to her, the forthcoming dApps will be fashioned to be user-centric, innovative, and meet the demands of the community.
Lucie also touched upon the virtual realms the team is concentrating on: the Shiboshi NFTs and the SHIB Metaverse. She believes these virtual environments will “serve as vibrant hubs for our community to connect, interact, and explore.” By shaping immersive and captivating online spaces, Lucie anticipates fostering a profound sense of community.
Lucie wrapped up her tweet affirming the commitment to Shibarium’s growth as an L2 solution, stating, “Our steadfast commitment to building Shibarium as a successful L2 solution remains unshakable.”
She championed the collaborative and innovative ethos that forms the foundation for the tokens and the burgeoning Shibarium ecosystem, saying:
This journey, marked by collaboration, innovation, and dedication, is the bedrock of our tokens’ triumph and the thriving Shibarium ecosystem. Together, we’re shaping the future of decentralized applications, one innovative step at a time. #ShibariumJourney
However, not all members of the SHIB community are on board with the project’s current trajectory. A notable tweet from @a_king_li read: “@ShytoshiKusama: L2 has been released for two months now, and there are no major projects, no good ecosystem or trustworthy swap. As a responsible official, should we release some official cooperative ecosystems or swap, so that funds can come in with peace of mind.”
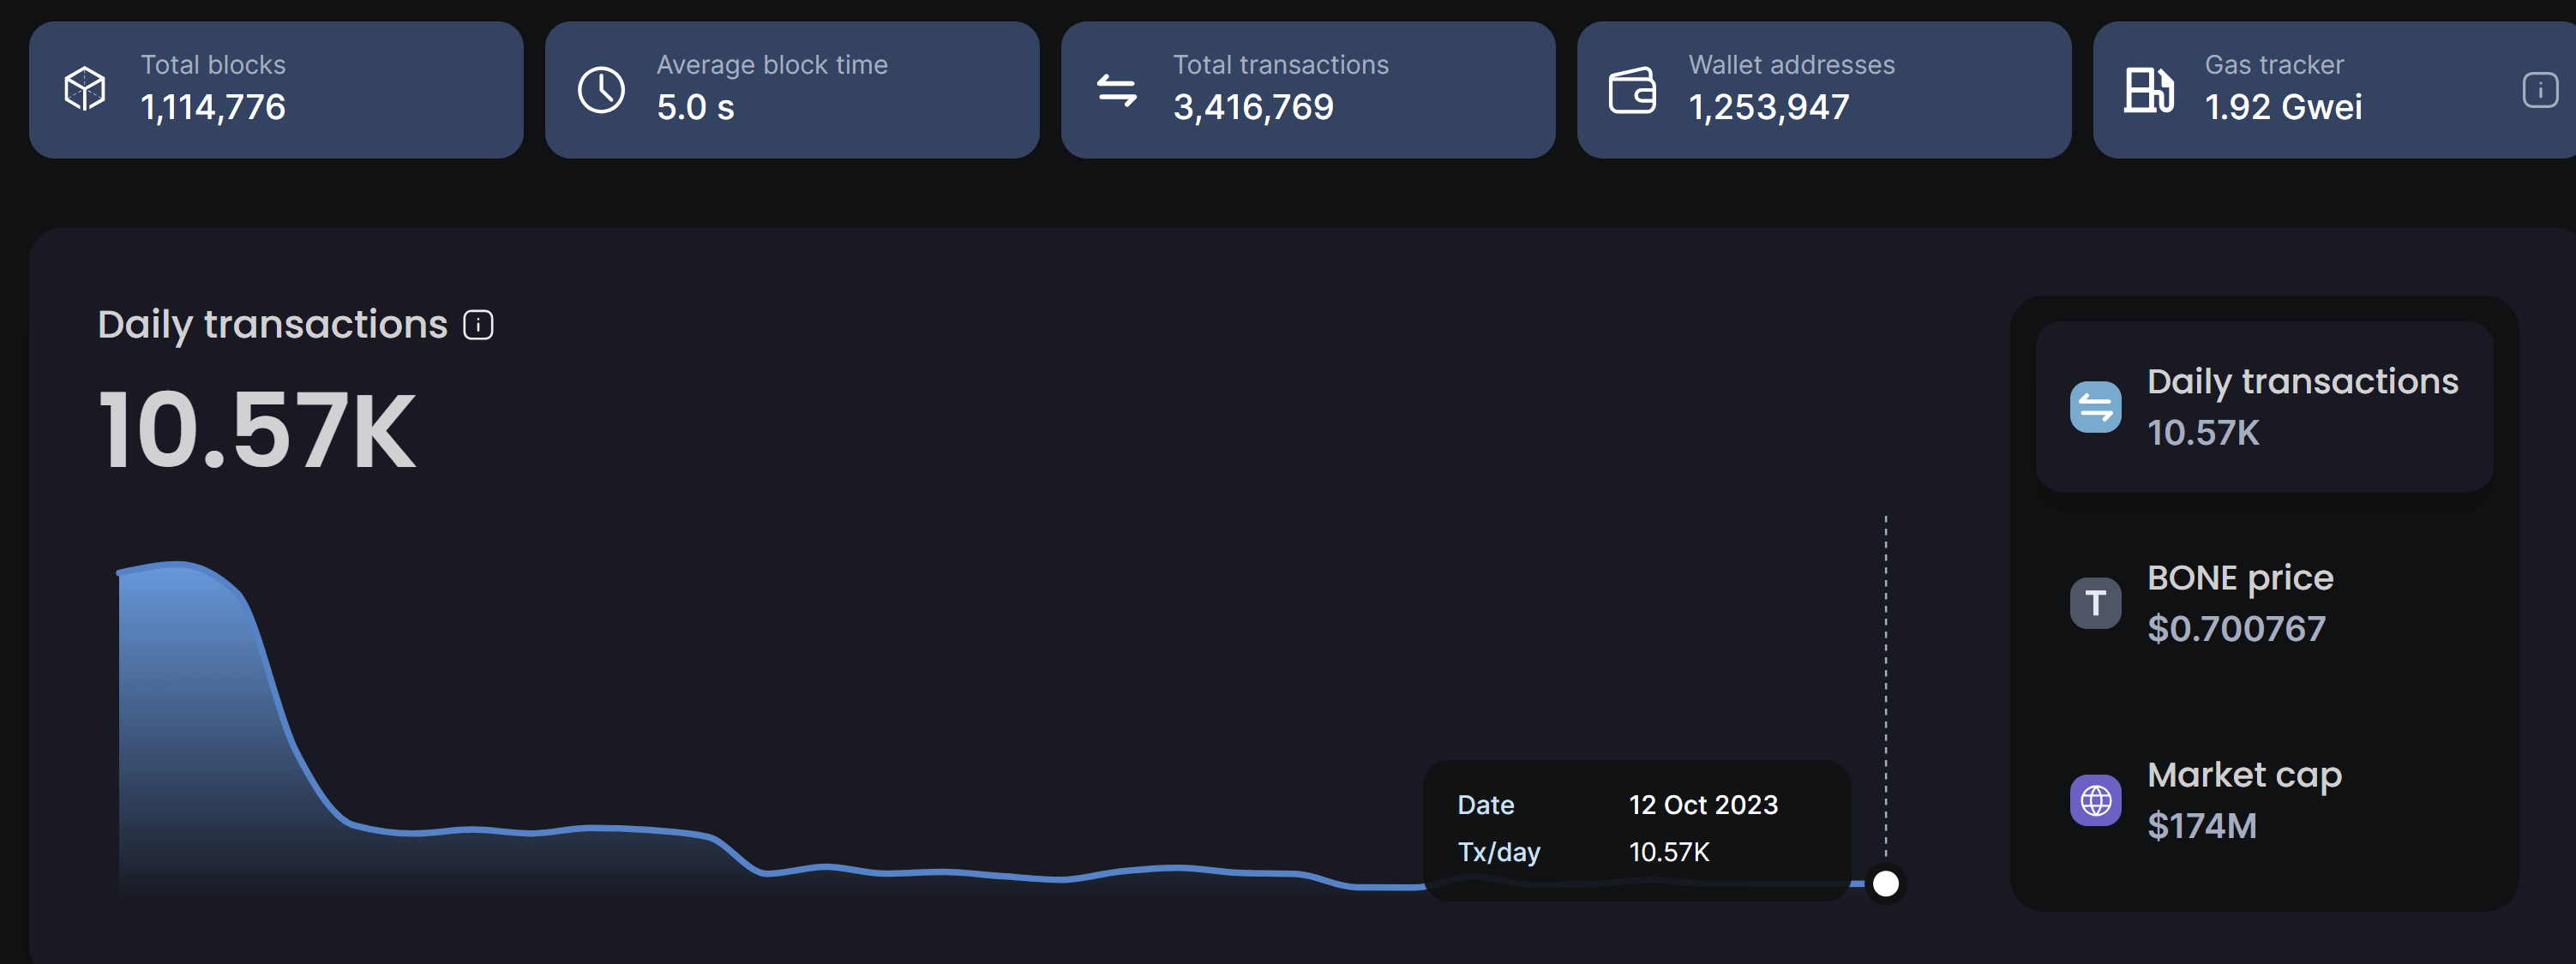
The concerns primarily arise from the absence of any major dApp on Shibarium, as touched on by Lucie. Notable projects like ShibaSwap and the Metaverse are yet to be operational on Shibarium. Furthermore, there’s a noted decline in Shibarium’s user and transaction statistics. After an initial hype with over 200,000 transactions daily post-launch, recent numbers hover above a mere 10,000 transactions per day.
Shiba Inu Price Stabilizes
The stagnation in Shibarium’s development may be a contributing factor to the dissatisfaction of some community members, as well as SHIB’s recent price action. As detailed in our last in-depth analysis, the SHIB price currently treads on decisive technical grounds, influenced by two significant chart patterns.
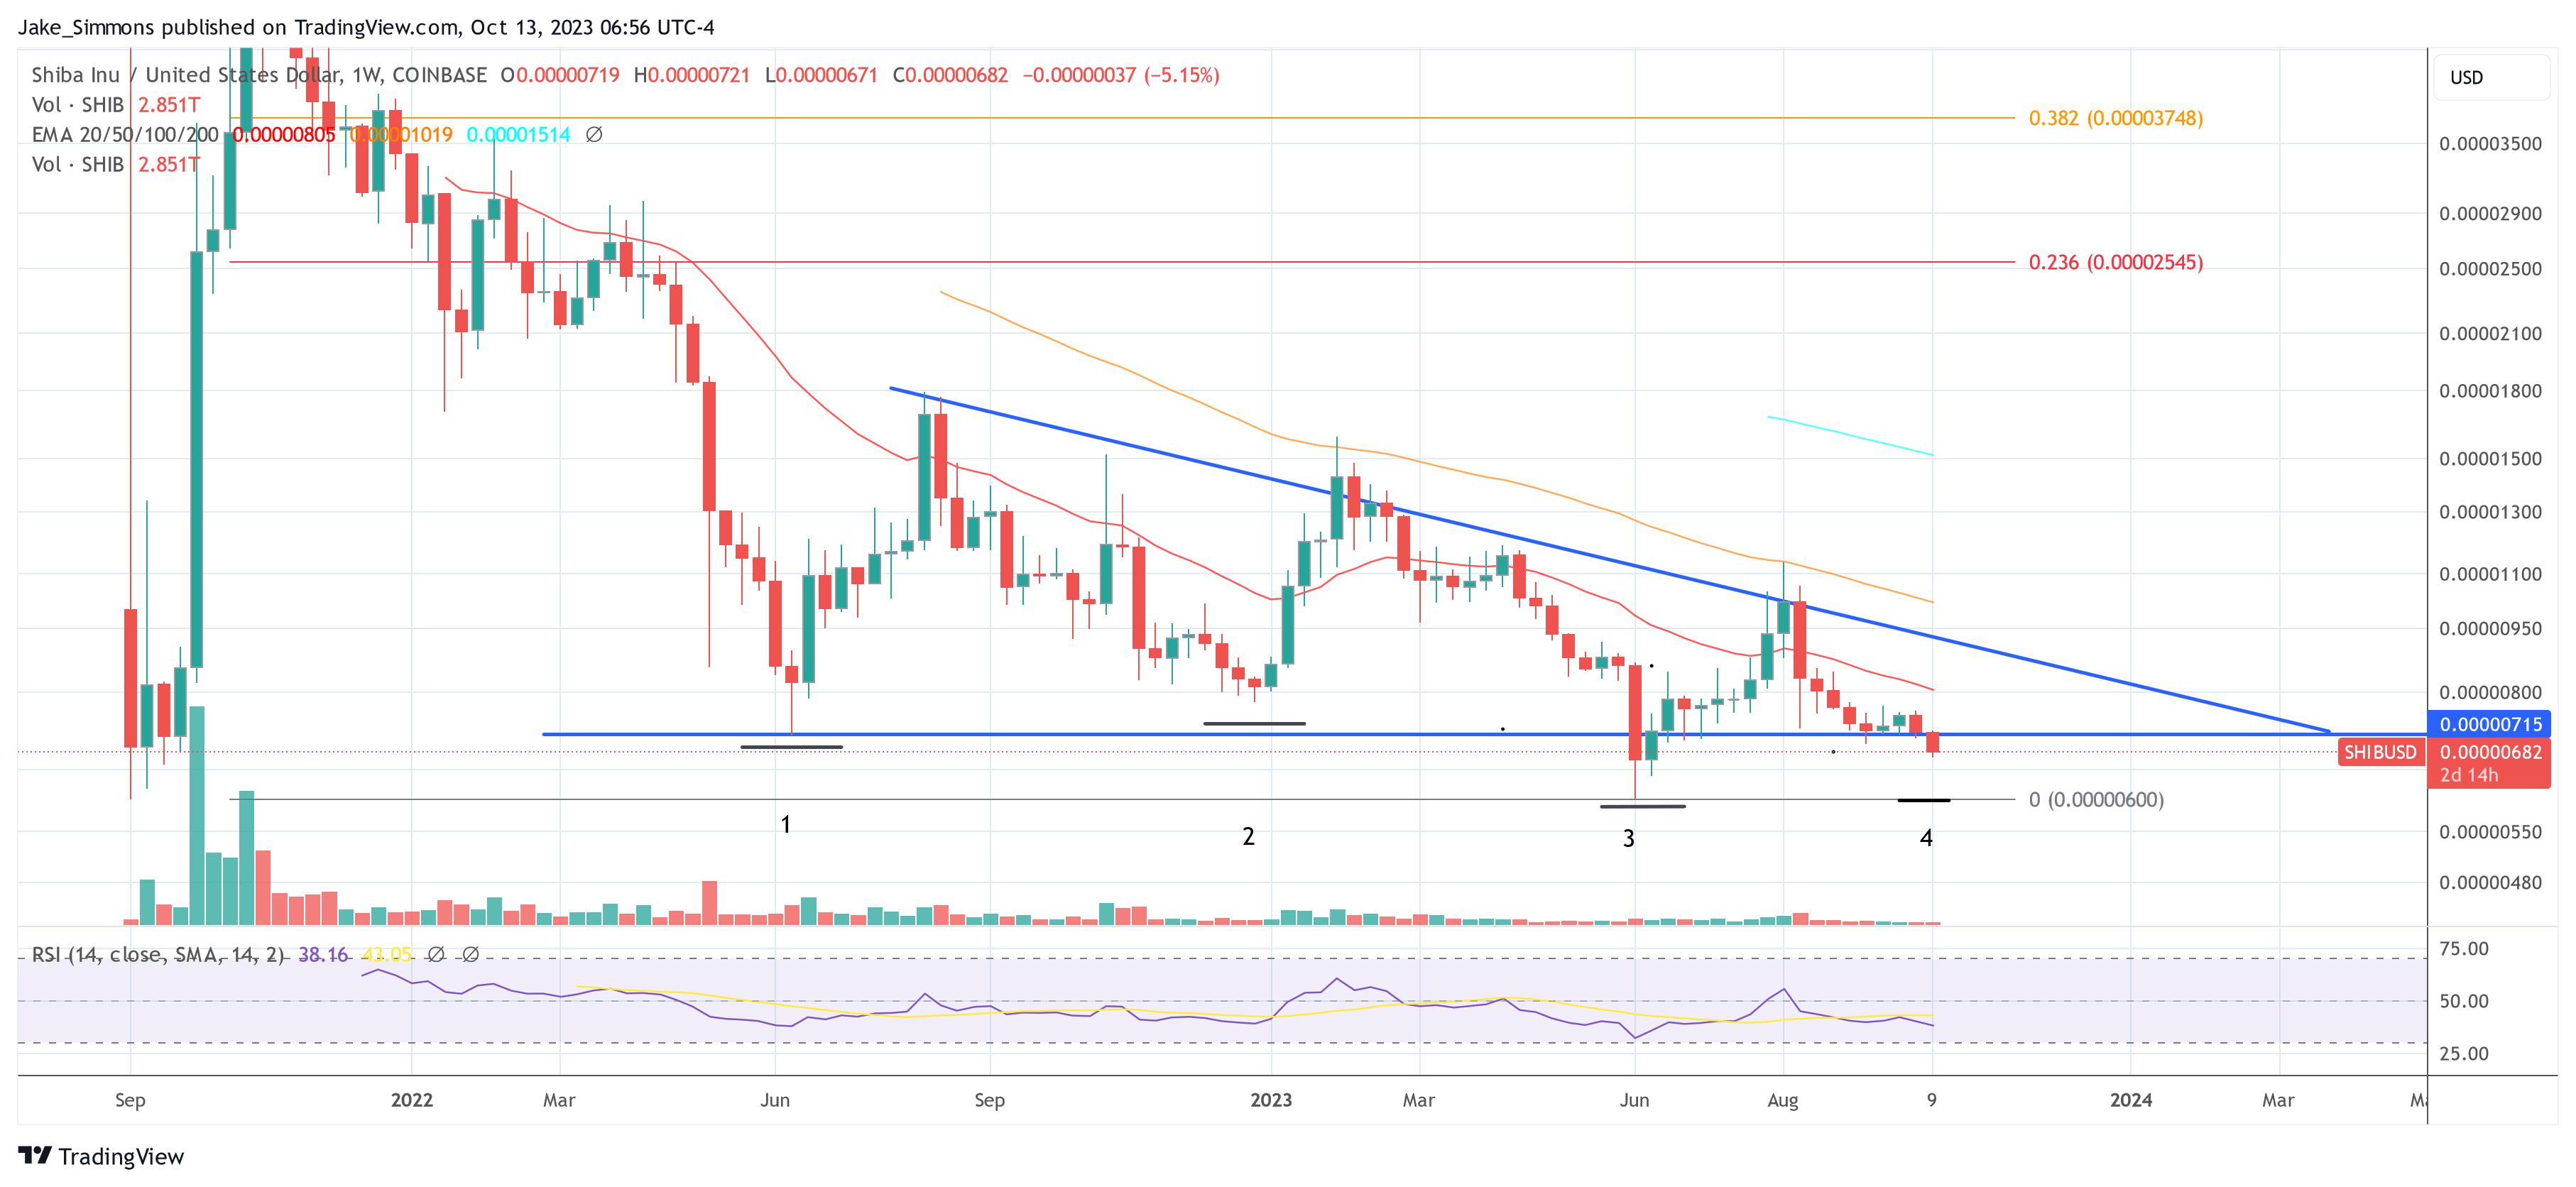
On the 1-week chart, SHIB showcases a promising quadruple bottom formation, indicating a potential bullish surge of up to 250% if realized. Contrarily, a descending triangle pattern, which has evolved over 60 weeks, suggests a bearish downturn. This is highlighted as SHIB’s price, currently at .00000682, has dropped below the descending triangle’s crucial neckline of .00000715.
For now, SHIB has stabilized and recovered slightly, having already fallen to .00000671 yesterday. Hope also comes from previous instances, such as the dip in June followed by a 59% rally, suggesting the potential for swift recoveries.
However, for this to happen, SHIB needs to record a weekly close above the .00000715 this week or next week. This might cement the bullish quadruple bottom trajectory. In case the scenario does not play out, SHIB could fall again towards the yearly low at .000006.
Amid Macro Uncertainty, Bitcoin Stabilizes. Incredible October Stats Inside
The world is upside down. Is bitcoin stable now? Or is everything else extremely volatile all of a sudden? As the planet descends into chaos, bitcoin remains in a weird limbo that’s uncharacteristic of the asset and doesn’t seem to end. That’s both what it feels like and what the stats say. In the latest ARK Invest’s The Bitcoin Monthly report, they put it like this, “bitcoin finds itself in a tug of war between oversold on-chain conditions and a chaotic macro environment.”
What about the numbers, though? The stats support the thesis, “for the third month in a row, bitcoin continues to trade between support at its investor cost basis (,814) and resistance at its 200- week moving average (,460).” Three months in that range seems like too much. Something’s got to give. However, that’s what everyone’s been thinking for the last few months and we’re still here.
The Dollar Milkshake Theory
Bitcoin has been less-volatile than usual, sure, but the main factor here is that the whole world is falling to pieces. Every company is in the red, especially techy ones, and all of the world’s currencies except the dollar fell off a cliff. Are we seeing “the dollar milkshake theory” playing out in front of our own eyes? It sure feels that way. Global central banks have been printing bills like there’s no tomorrow, and that extra liquidity is there for the stronger currency to take.
According to professional investor Darren Winter, the “dollar milkshake theory views central bank liquidity as the milkshake and when Fed’s policy transitions from easing to tightening they are exchanging a metaphoric syringe for a big straw sucking liquidity from global markets.” If that’s what we’re seeing, what happens next? Back to The Bitcoin Monthly, ARK says:
“As macro uncertainty and USD strength have increased, foreign currency pairs have been impacted negatively while bitcoin has been relatively stable. Bitcoin’s 30-day realized volatility is nearly equivalent to that of the GBP and EUR for the first time since October 2016”

BTC price chart for 11/07/2022 on Bitstamp | Source: BTC/USD on TradingView.com
Bitcoin Vs. Other Assets In October
The macro-environment has been so bad lately, that there’s the perception that bitcoin has been doing better than stocks. The facts are that, for the first time since 2020, “bitcoin’s 30-day volatility is on par with the Nasdaq’s and the S&P 500’s.” And, we know past performance doesn’t guarantee future results, but “the last time bitcoin’s volatility declined and equaled the rising volatility of equitiy indices was in late 2018 and early 2019, preceding bullish moves in the BTC price.”
However, let’s not kid ourselves, bitcoin has not been doing good. The thing is, not much is prospering out there. Especially in the tech sector. “The price drawdowns from alltime high in Meta (-75.87%) and Netflix (-76.38) have exceeded that of bitcoin’s (-74.46%). To a lesser extent, Amazon also suggests a correction proportional to that of BTC’s “usual” volatility (-48.05%).”
According to The Bitcoin Monthly, the situation “suggests the severity of the macroeconomic environment and bitcoin’s resilience against it.”
The only constant is change, however. Bitcoin’s stability suggests a violent breakout, either up or down. The entire world can’t remain the red forever, something or someone has got to rise above the crowd and show everyone how it’s done. We’ve been waiting for a resolution for what feels like ages, and we’ll probably have to wait some more. There will be a movement, though. When we least expect it, probably.
Featured Image: Bitcoin 3D logo from The Bitcoin Monthly | Charts by TradingView
NewsBTC
Bitcoin Trading Volume Stabilizes At Lows Of July 2021 As Market Sleeps
Data shows the weekly average Bitcoin trading volume has stabilized around the same lows as July 2021 as market activity remains low.
Bitcoin Trading Volume Has Stayed Low In Recent Weeks
According to the latest weekly report from Arcane Research, the BTC trading volume has sunk down to July lows recently.
The “trading volume” is an indicator that measures the total amount of Bitcoin being transacted on the chain in a day.
When the value of this metric goes up, it means investors are moving a higher number of coins right now. Such a trend suggests the market activity is going up as holders become more interested in trading.
On the other hand, a downtrend in the indicator implies the Bitcoin market is turning more inactive currently. This may show a general lack of interest in the crypto among investors at the moment.
Now, here is a chart that shows the trend in the BTC trading volume over the past year:
The indicator’s value seems to have been at low values recently | Source: Arcane Research’s The Weekly Update – Week 15, 2022
As you can see in the above graph, the daily Bitcoin spot trading volume has struggled a lot recently, and has declined to 7-day average values of around just billion.
Related Reading | Now Or Never: Bitcoin Builds Base At Decade-Long Parabolic Curve
The metric is now at the same lows as July of last year. Back then, the price had been consolidating sideways for a couple of months following the May crash.
Bitcoin Price Surges Above k, Can It Revive The Volume?
Usually, periods of high trading volumes have been when the price of BTC has successfully made some large moves. It’s because to sustain any such move, the market needs a high number of active traders.
Related Reading | Calm Before The Storm: Bitcoin Volatility Reaches Pre-Bull Breakout Levels
But it’s also true that any large price move attracts more investors to the market, thus raising the volume. In cases when it doesn’t happen, the rally generally dies down before too long.
Today, Bitcoin’s price has crossed above the k mark again after plunging down below the k level just a few days back. The below chart shows the trend.
The value of BTC seems to have shot up over the last couple of days | Source: BTCUSD on TradingView
It’s possible that this new surge may be able to revive the volume a little. However, it’s also true that there have been a few instances this year already where a rise in the price wasn’t accompanied by a spike in the volume. It now remains to be seen which scenario will play out this time.
Featured image from Unsplash.com, charts from TradingView.com, Arcane Research
NewsBTC
Bitcoin Driven Higher by TWAP Buying as Price Stabilizes at All-Time Highs
- Bitcoin has seen wild price action over the past couple of days, with the cryptocurrency posting its most extensive ever 1-day candle yesterday following news of Tesla’s BTC purchase
- This candle, which spanned from the upper-,000 region all the way to highs of ,000, has yet to be reversed, as bulls have maintained their control over the market
- Where the entire crypto market trends next will undoubtedly depend on BTC, as altcoins have been closely tracking its general trend
- If the crypto slides lower and fails to extend its momentum, altcoins may see intense selloffs that drive them significantly lower
- One ongoing event that is bullish for BTC is that there appears to be strong TWAP demand for the crypto
- This indicates that funds and other large players are accumulating
Bitcoin and the entire crypto market have consolidated today following a massive push higher that came about yesterday morning on the heels of news regarding Tesla’s .5b BTC acquisition.
Naturally, this news created a buying frenzy that has yet to subside, with traders and retail investors alike rushing to gain heightened exposure to the benchmark digital asset.
One positive sign that may indicate growth is imminent is the presence of large TWAP activity, which is a sign that large buyers are adding to their BTC stacks.
Bitcoin Stable Following Massive Tesla-Induced Rally
At the time of writing, Bitcoin is trading flat around its current price of ,550. This is around where it has been trading throughout the past few days.
Each selloff seen over the past day has been rapidly absorbed, which is a sign that demand is mounting.
The crypto has yet to eat into its recent gains and is still trading around where the daily candle closed yesterday.
Data Shows Large Players are TWAPing BTC
Data seems to suggest that large buyers are using TWAP to acquire BTC, which may be why the benchmark crypto has yet to see any sustained selloffs.
One analyst spoke about this in a recent tweet, pointing to a chart showing the aggressive buying occurring on each dip.
“I suppose lots of bigger players using TWAP and as more institutions buy BTC or larger funds buy BTC… I expect TWAP to work better over time (albeit front running becomes a problem –> but still usable)”

Image Courtesy of Cyrii_MM. Source: BTCUSD on TradingView.
If this trend persists, it could provide Bitcoin with a solid base of buying pressure to extend its uptrend.
Featured image from Unsplash.
Charts from TradingView.
Analyst: Altcoins Likely to Continue Rallying as Bitcoin Price Stabilizes
Bitcoin and the aggregated crypto market have seen some mixed price action over the past few days, with major digital assets showing signs of weakness while smaller market cap altcoins continue seeing bullish price action.
Both BTC and ETH did place some pressure on the entire market overnight, sparking a retrace amongst most altcoins.
That being said, the benchmark cryptocurrency is now showing some signs of strength as it holds above a crucial support level.
One analyst believes that its ability to hold above this level could be enough to propel the entire market significantly higher.
He notes that ,500 is the key region to watch in the near-term, as holding above this level could provide smaller altcoins with massive momentum in the coming days.
Bitcoin Shows Signs of Strength as Market Consolidates
At the time of writing, Bitcoin is trading up marginally at its current price of ,570. This is around where it has been consolidating at ever since bulls defended against a break below ,500.
The decline seen by the cryptocurrency overnight briefly led it to lows of ,400, but this level was ardently defended by bulls.
Their inability to break below this bedrock support shows that the lower-,000 region is a strong support level for the cryptocurrency, which may mean that it is poised to see further near-term upside.
Furthermore, the crypto is now trading above its previous support at ,500, with buyers’ ability to reclaim this level suggesting that it is poised to see further upside in the near-term.
If BTC can continue holding above this level, it will likely consolidate for a short period as it attempts to garner enough support to break above its resistance at ,000.
Analyst: Altcoins Likely to Rally as BTC Holds Key Support
While speaking about Bitcoin’s current outlook, one analyst explained that he believes its ability to hold above ,500 will allow altcoins to bounce and potentially further extend their intense momentum.
His chart does reveal that a break below this level could lead BTC to decline to as low as ,900 in the days and weeks ahead.
“Well, on the daily timeframe we’ve arrived at the crucial level to hold for further upwards momentum. Bearish divergence only gets confirmed if we lose this ,500 zone. Holding here = bounces on altcoins. In general still altseason and alts continue.”

Image Courtesy of Crypto Michaēl. Chart via TradingView.
Bitcoin’s price action will likely be the primary factor that determines how altcoins trend in the days and weeks ahead.
Featured image from Shutterstock.
Charts from TradingView.
Ethereum Stabilizes Above $170 as Indicator Predicts Further Upside
Ethereum (ETH) has posted a strong bounce from its recent lows and has not yet faced any notable rejection after climbing from these lows. This slight upwards momentum has come about as Bitcoin finds increasing stability around the ,000 region.
Analysts are now noting that Ethereum could incur massive upside in the future, although other analysts are also explaining that ETH may further extend its recently incurred downwards momentum in the short-term.
Ethereum Stabilizes Above 0
At the time of writing, Ethereum is trading up nearly 5% at its current price of 3, which marks a notable surge from its recent lows of under 0 that were set earlier this week concurrently with Bitcoin pushing below the ,000 region.
ETH’s ability to surge from these lows signals that the crypto does have some underlying bullishness, but it is important to note that it is still trading down significantly from its recent highs of over 0.
In the near-term, analysts still believe that ETH may incur further bearishness, as Horn Hairs – a popular cryptocurrency analyst on Twitter – recently explained that the crypto is currently pushing up against a significant resistance zone that is likely to force it lower in the near-term.
“$ETH inverse weekly chart: What in God’s name makes you ‘bullish’ here? People calling for lower feels a lot like when people call altseason when we get a bearish retest into resistance,” he explained in a recent tweet.
$ETH inverse weekly chart
What in God's name makes you "bullish" here? People calling for lower feels a lot like when people call altseason when we get a bearish retest into resistance. pic.twitter.com/hzIO9vCqMt
— HornHairs
(@CryptoHornHairs) September 28, 2019
Macro Outlook Looks Very Positive for ETH
Although in the near-term Ethereum could drop significantly further as it pushes into its next key resistance zone, its macro-outlook is still quite bullish, as one technical indicator points to the possibility that ETH will ultimately surge to highs of ,300.
BitcoinEconomics spoke about what the Bitcoin Economics Adaptive Multiple (BEAM) shows when it is applied to Ethereum’s price action, which may be a very positive thing for ETH’s investors.
“BEAM also works with Ethereum. It even says we reentered a buy zone. It predicts a minimum of 00 for the next ATH of Ethereum. Same false sell signal in mid 2017 as for Bitcoin in April 2013,” they noted while pointing to the below chart.
BEAM also works with Ethereum. It even says we reentered a buy zone.
It predicts a minimum of 00 for the next ATH of Ethereum.
Same false sell signal in mid 2017 as for Bitcoin in April 2013. pic.twitter.com/lbqrqz0kxb
— BitcoinEconomics.io (@BitcoinEcon) September 27, 2019
Assuming that Ethereum is unable to break above its near-term resistance level, it may further extend its recently incurred downwards momentum, but it is imperative to keep in mind that the crypto’s macro outlook still looks incredibly bullish.
Featured image from Shutterstock.
The post Ethereum Stabilizes Above 0 as Indicator Predicts Further Upside appeared first on NewsBTC.
Ripple (XRP) Outperforms Crypto Markets as Price Stabilizes Above Historical Support
Ripple has been able to once again find strong buying pressure in the upper-.20 region, which has historically been a region of strong support for the cryptocurrency. After touching this region, XRP climbed slightly higher, and is currently outperforming the markets.
Analysts are now torn on whether or not this price region marks a long-term floor that will allow the crypto to surge higher, or if it is simply a weakening support level that will ultimately lead to a significant drop lower.
Ripple (XRP) Plunges Over Past Few Weeks, But Nears a Critical Support Region
At the time of writing, Ripple is trading up nearly 2% at its current price of .32 and is currently outperforming the aggregated crypto markets.
Although XRP has been able to climb slightly today, its price action over a several week period has been incredibly bearish, as it has plummeted from its late-June highs of nearly .50 to its recent lows of just below .30.
This price action has closely mirrored that of Bitcoin’s, as BTC quickly surged to highs of ,800 in late-June before subsequently plummeting to its recent lows of roughly ,900.
Peter Brandt, a popular cryptocurrency analyst on Twitter, spoke about XRP’s price action a few days ago, explaining to his nearly 300k followers that Ripple could plummet as low as .16 if Bitcoin continues to face downwards pressure.
“If $BTC has intermediate correction then $XRP will go to $.1600,” he explained.
If $BTC has intermediate correction then $XRP will go to $.1600 pic.twitter.com/tqQ0nuHZr4
— Peter Brandt (@PeterLBrandt) July 11, 2019
Is XRP Forming an Accumulation Base Around Current Prices?
Although it does seem as though Ripple is currently sitting on the edge of a precipice that could result in a serious drop, other analysts are noting that the price region that lies just below where it is currently trading at could mark a long-term accumulation base.
Credible Crypto, another popular analyst on Twitter, recently spoke about this possibility to his nearly 50k followers while replying to another analyst’s bearish assessment of the cryptocurrency.
“I don’t know about this one Don. $BTC was resting on a level that had 20 days of consolidation as support. $XRP is resting on a level that has nearly 7 months of consolidation as support. Looks more like we are building an accumulation base here,” he replied.
I don't know about this one Don. $BTC was resting on a level that had 20 days of consolidation as support. $XRP is resting on a level that has nearly 7 months of consolidation as support. Looks more like we are building an accumulation base here. pic.twitter.com/Im0tRfx9hI
— Credible Crypto (@CredibleCrypto) July 14, 2019
Although it remains unclear as to whether or not XRP will closely follow Bitcoin’s price action in the near-future, it is highly probable that it will take a significant influx of selling pressure for the crypto to drop below its long-established support level around .30.
Featured image from Shutterstock.
The post Ripple (XRP) Outperforms Crypto Markets as Price Stabilizes Above Historical Support appeared first on NewsBTC.