 According to the latest data, 5.43 million was liquidated across crypto derivatives exchanges when bitcoin dipped below ,000. One analyst predicts that with the Mt Gox and German government sell-offs, “supply will likely outstrip demand.” Conversely, QCP Capital notes that despite the current crypto sell-off, the options market remains hopeful. Crypto Liquidation Tops 5M as […]
Bitcoin News
Longest Miner Capitulation Since 2022 Signals Potential Bitcoin Rally Ahead
Bitcoin (BTC) has recently struggled to regain bullish momentum, remaining in a consolidation phase just above the crucial ,000 support. Despite reaching an all-time high three months ago, the largest cryptocurrency witnessed a dip to as low as ,500 on Wednesday due to increased selling pressure from miners.
BTC Selling Spree
The ongoing miner capitulation, the longest observed since the summer of 2022 before the FTX implosion, indicates the Bitcoin Halving supply-squeeze effect.
Crypto analyst Ali Martinez noted that Bitcoin miners have sold more than 2,300 BTC in the past 3 days, amounting to approximately 5 million.
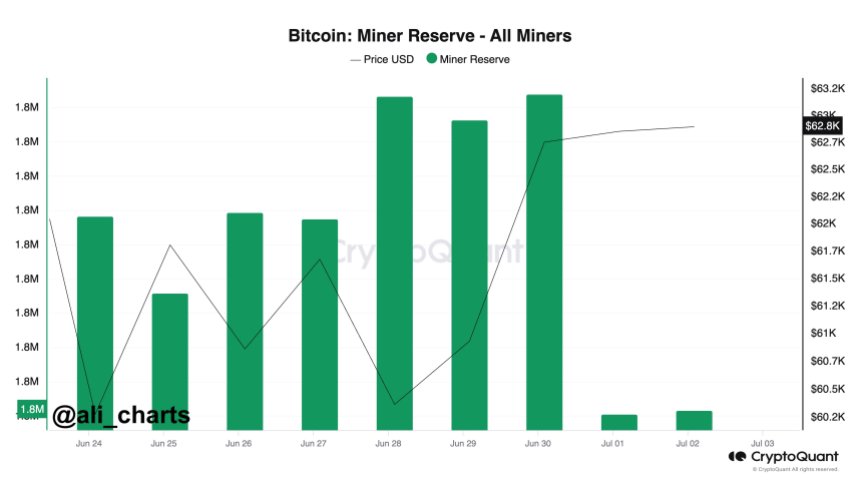
This selling pressure from miners adds to the recent BTC sales by the US and German governments, contributing to the market’s downward pressure and keeping prices within the lower range of the wider consolidation zone between ,000 and ,000 witnessed in recent months.
Notably, addresses linked to the German and US governments have sent 7 million worth of BTC to exchanges, including Coinbase, Bitstamp, and Kraken, in various transactions.
As the selling pressure from governments and miners subsides over time, market observers expect a potential price recovery for BTC, following the typical pattern observed during the post-Halving period, where new all-time highs are often achieved.
Bitcoin Price Outlook
Market expert Scott Melker points out that the market may be nearing a crucial signal, stating that if a daily candle closes below the ,300 level, it could lead to a bullish divergence.
This would involve the daily RSI (Relative Strength Index) moving out of oversold territory, similar to last August when the price was around ,000.
Melker emphasizes the need for a close below the mentioned level, followed by a clear upward move in the RSI without making a lower low. It would require a significant downward move for the RSI to go lower than its level on June 24th.
However, crypto analyst Andrew Kang highlights the significance of a potential loss of the four-month range on Bitcoin, drawing parallels with the range observed in May 2021 following a parabolic rally of BTC and altcoins.
Kang notes that over billion in crypto leverage is currently at near all-time highs, compounded by the fact that the market has been in a prolonged consolidation phase for 18 weeks without experiencing extreme washouts, as seen during the 2020-2021 bull market.
Moreover, Kang suggests that initial estimates of the low ,000s may have been too conservative, and a more significant reset to the ,000s could be possible.
Such a pullback would substantially impact the market and likely necessitate a few months of choppy or downward price action before a reversal and an upward trend could be established.
At the time of writing, BTC has recovered the ,350 level after its brief dip below this crucial support for further movements to the upside.
The largest cryptocurrency in the market has erased all gains in wider time frames, and it is currently recording a 12% price decrease in the monthly time frame.
Featured image from DALL-E, chart from TradingView.com
Ethereum Goes Budget-Friendly: Transaction Fees Drop To Lowest Since 2016
Ethereum, the world’s second-largest blockchain platform, has entered a new era marked by record-low transaction fees. This dramatic shift, the most significant since 2016, has sent ripples of excitement through the cryptocurrency community, raising hopes for increased adoption and a more accessible DeFi (Decentralized Finance) landscape.
From Pricey To Penny-Pinching
Previously, Ethereum’s notorious gas fees, the cost of processing transactions on the network, had become a major barrier to entry. During peak periods in 2021, fees skyrocketed to a staggering 100 gwei, effectively pricing out many users and hindering the network’s growth.
This recent fee freefall, however, paints a drastically different picture. With average fees hovering around 3 gwei (equivalent to a fraction of a US cent), interacting with the Ethereum network has become significantly more affordable.
News of the record-low gas fees first surfaced via Wu Blockchain, a respected online source for cryptocurrency news. The information was then corroborated by Coinbase Director Conor, lending further weight to the reports.
According to data shared by Coinbase Director Conor, Ethereum is experiencing the lowest average network fee since 2016. Among the 10 periods with the lowest average fee per hour on the Ethereum network, 9 were recorded this week, all below 3.3 gwei. At 4:00 UTC on June 30, the…
— Wu Blockchain (@WuBlockchain) June 30, 2024
Analysts attribute this dramatic decline to a confluence of factors. Recent network upgrades, specifically those focused on improving efficiency, have played a crucial role in streamlining transaction processing. Additionally, the overall decrease in network activity, potentially due to a broader crypto market slump, has also contributed to the lower fees.
A Boon For Builders And Blockchain Beginners?
The implications of these low fees are far-reaching. For developers, the Ethereum network has become a more attractive platform for deploying decentralized applications (dApps). Lower transaction costs make it easier to experiment and iterate on new projects, potentially leading to a surge in innovative dApp development.
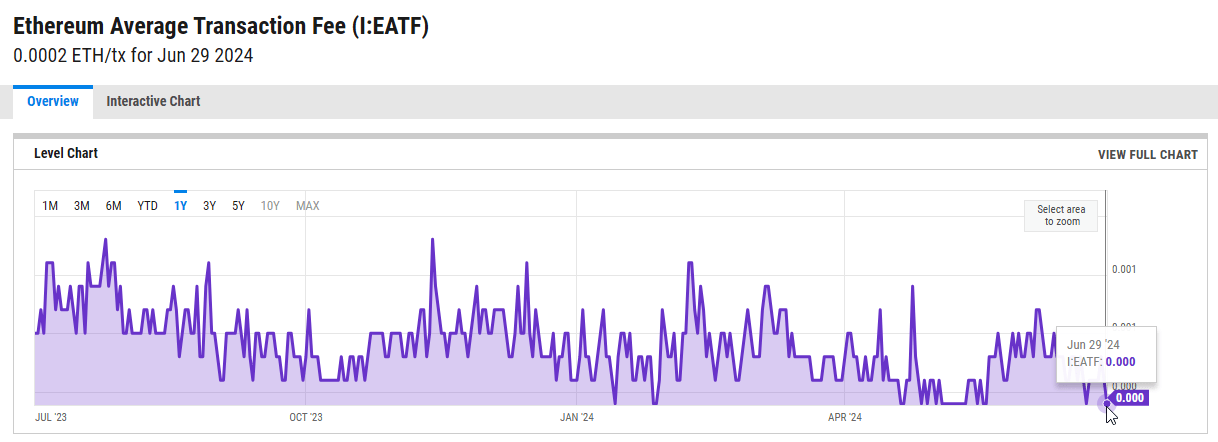
YCharts offers a visualization tool for tracking the Ethereum Average Transaction Fee. This chart (above) allows users to monitor fee trends over time, providing valuable insights into network activity and user behavior.
For users, particularly those new to the crypto space, the reduced fees significantly lower the barrier to entry. This opens the door for a wider range of individuals to participate in DeFi activities, such as lending, borrowing, and trading digital assets. A more accessible Ethereum could lead to a broader user base and a more robust DeFi ecosystem.
However, some experts caution that the long-term implications of these low fees remain to be seen. The Ethereum network relies on transaction fees to incentivize miners who validate transactions and secure the network. A sustained period of extremely low fees could potentially impact network security, raising concerns about the long-term health of the ecosystem.
Featured image from Swyftx Learn, chart from TradingView
DOGE To The Moon: This Dogecoin Metric Just Turned Bullish For The First Time Since 2020
Dogecoin (DOGE) is again in the spotlight as the foremost meme coin could be ready for takeoff. This follows crypto analyst Kevin’s (formerly Yomi OG) analysis of Dogecoin, in which he highlighted an important indicator that has turned bullish for the crypto token.
Dogecoin Indicator Turns Green For The First Since 2020
Kevin mentioned in an X (formerly Twitter) post that the 12-day time frame on the Gaussian channel just recently flipped green on Dogecoin’s chart for the first time since December 2020. He claimed that this indicates a “potential strong bullish trend” is on the cards for the meme coin in the coming months.
Kevin added that this indicator has never failed in indicating these trend changes, suggesting that Dogecoin has indeed undergone a bullish reversal.
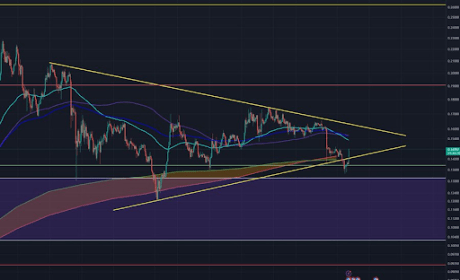
In another X post, Kevin claimed that Dogecoin has looked much stronger than most altcoins throughout this period, during which the crypto market has continued to bleed and trade sideways. He added that Dogecoin will likely move into the golden pocket at the .26 to .33 range if it can stay above the Macro 0.382 FIB and the blue support zone on the weekly time frame.
Kevin also provided another bullish narrative for Dogecoin in another X post. Looking at the four-hour time frame chart, he highlighted a deviation back into the larger symmetrical triangle, which he claimed is a “bullish sign.” He stated that Dogecoin getting back above key moving averages will be important. He also added that he expects the foremost meme coin to test the .175 price level at some point, as there is a lot of liquidity in that price range.
The crypto analyst also hammered on liquidity at that price area. He claimed there is a “very big block of liquidity” at the .175 level, looking at the 3-month time frame. Additionally, he said that most of the liquidity beyond that level is between the .20 to .23 range. This is bullish for Dogecoin, as Kevin noted that market makers like to move where the liquidity is, and it is definitely higher for Dogecoin at the moment.
DOGE’s Next Move
Crypto analyst CrediBULL Crypto recently mentioned that Dogecoin has reached a ‘make it or break it’ level. He, however, seemed confident that Dogecoin could experience an upward trend from its current price level, noting that the meme coin had reached this ‘make it or break it’ level when Bitcoin hit its range lows. As such, he expects Dogecoin to enjoy a price rebound if the flagship crypto experiences a bullish reversal.
Meanwhile, crypto analyst Crypto Daily has made a short-term bullish forecast for DOGE. He predicted that Dogecoin would rise to between .33 and .35 soon. The analyst added that a daily close above .18308 could lead to further gains up to .57 for Dogecoin.
Bitcoin Scarcity Grows as Miner and Exchange Reserves Drop by 183,253 BTC Since January
 Over the past 158 days, starting from the beginning of the year, the quantity of bitcoin held by exchanges and miners has decreased by 183,253 BTC, valued at nearly billion. Roughly 90.95% of this bitcoin withdrawal originated from cryptocurrency exchange reserves. Exchanges and Miners See Massive Reductions From Jan. 1 to June 7, 2024, […]
Bitcoin News
XRP Hasn’t Had A Bull Cycle Since 2017, Analyst Reveals What Will Happen When It Does
The XRP price has been a constant point of worry for investors given that the altcoins seems to be frozen in time. The last time that the coin rallied was in the 2017-2018 bull and even though there has been another massive bull market since then, XRP failed to follow the rest of the market. While expectations for the altcoin have dropped dramatically, one analyst believes that the cryptocurrency could finally have its time in the spotlight, revealing targets for when this does happen.
Why XRP Could Be Gearing Up For A Bull Rally
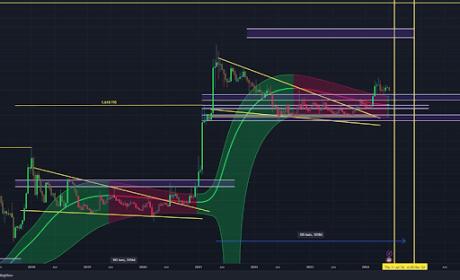
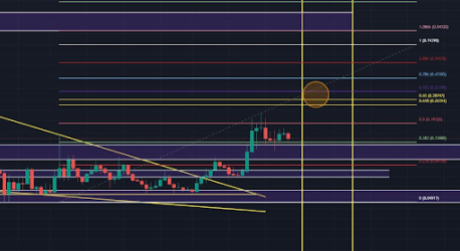
Crypto analyst CryptoManiac101 took to the TradingView platform to share a rather interesting view of the XRP price going forward. The analyst pointed out a number of indicators that suggest that the altcoin may finally be getting ready to move. One of the major points in the analysis was the price levels and movements so far.
The crypto analyst points out a convergence of three different moving averages in the year 2024. At the end of this is the formation of a symmetrical triangle pattern outlined in the chart. Furthermore, the convergence, which is happening around .51, suggests that there is consolidation going on. Now, usually, consolidation will come with accumulation, which is often good for the price, and the analyst points out that interest is rising.
Going further, the crypto analyst points to the performance of XRP over the last 11 years. This begins from 2013 and moves to present time, showing how the performance of XRP has actually flattened during this time. “Significant historical price spikes, particularly in 2017 and 2018, are visible, which is what we are looking at for 2024 and 2025 years as we see some movement consistency between the two cycles,” the analyst stated.
With interesting rising, these indicators could point toward an important breakout for the price. If this happens, the crypto analyst has outlined targets for how high the price could go.
How High Can The Price Go?
One major factor in the analyst’s prediction is the fact that such historical patterns have been previously bullish for XRP to have returned. The analyst points out that a rally usually breaks out when these patterns have seen a 75% completion. However, the current patterns have reached 88.93% completion, suggesting that a breakout is long overdue for the XRP price.
In the event of a rally, the crypto analyst expects an at least 800% increase in price above . This future prediction is based on the potential of a breakout from the symmetrical triangle forming at the convergence of the three moving averages. In this case, the analyst expects a rally to .5 as a starting point.
Bitcoin Miners See 46.15% Revenue Drop in May, Lowest Since October 2023
 After two consecutive months of record-breaking revenue, bitcoin miners experienced a significant downturn in earnings in May, a level not seen since October 2023. In April, miners generated .79 billion, whereas May’s figures show a considerably lower revenue of approximately 4.24 million. Sharp Decline in Bitcoin Miner Revenue in May Bitcoin miners generated 46.15% less […]
Bitcoin News
Only 8 Altcoins Have Broken ATH Against Bitcoin Since FTX’s Collapse – Analyst Weighs In
During this bull cycle, the crypto market has been surfing off Bitcoin’s crest and enjoying the bullish momentum. However, investors hope for a seismic explosion to impulse Altcoins to new highs.
As the crypto industry awaits, online reports revealed that, since FTX’s fall, only eight altcoins have hit a new all-time high (ATH) against Bitcoin. A crypto analyst shared his thoughts on the matter.
Altcoins Underperforming Against Bitcoin This Cycle
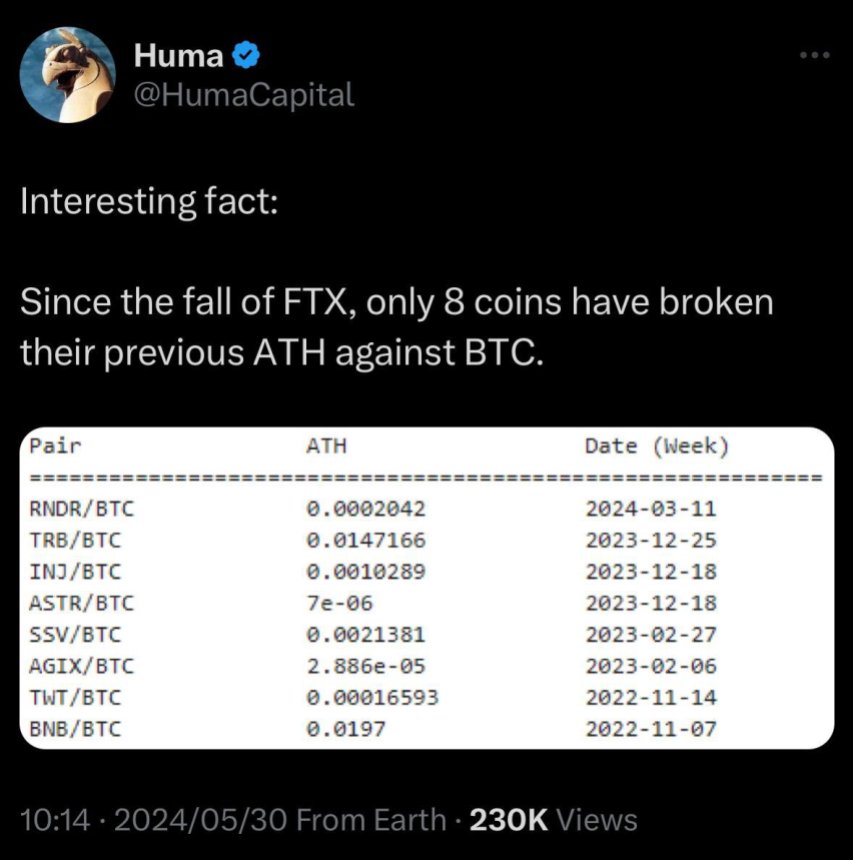
On Friday, Crypto analyst Miles Deutscher shared an interesting fact about the crypto market. Since November 2022, just eight altcoins have broken their previous ATH against the flagship cryptocurrency.
To achieve this feat, tokens include Render (RNDR), Tellor (TRB), Injective (INJ), Astar (ASTR), SSV Network (SSV), SingularityNET (AGIX), True Wallet Token (TWT), and Binance Coin (BNB).
It’s worth noting that RNDR was the latest one to accomplish this on March 11 and that the list only contains altcoins launched before FTX’s collapse.
Deutscher explained that despite his initial shock, the news made sense to him and highlighted some takeaways based on the singularities of this run.
First, the analyst considers that asset selection dynamics changed from previous cycles. Investors have been “punished” for being overexposed to certain sectors like L2 and gaming and “rewarded” for participating in others like Memecoins and AI.
In contrast, in the last cycle, “you could basically bet on anything and beat $BTC.” According to the analyst, the market will likely continue experiencing specific sector outperformance despite the retail liquidity injection.
He also explained that “crypto is an attention economy,” and money will flow where attention is. As a result, even the projects with the best technology won’t perform if there isn’t an exciting reason to buy.
Deutscher’s second takeaway highlights the market’s current ATH dilution. As he points out, thousands of new products are being launched daily, and “low float/high FDV VC coins are launching in the billions.” These launches are seemingly outpacing the new liquidity, resulting in Altcoins struggling with performance.
More Room To Catch Up
The analyst’s third point explains that the bull run has been led by Bitcoin and spot BTC exchange-traded funds (ETH). Based on this, he considers it unsurprising that altcoins have “hardly pumped” so far.
Various crypto analysts and experts share this opinion. Alex Krüger previously stated that the cycle has been “almost entirely” driven by the Bitcoin ETFs’ momentum.
Deutscher sees Altcoins’ underperformance as a bullish signal since Bitcoin’s dominance has been instrumental in previous cycles. To him, this performance allows “more room to play catch up” and could drive altcoins to unseen highs.
The analyst believes the market needs another catalyst for a true Altcoins season. Despite this, he highlights that many investors have had a record Q1 “even in mildly bullish conditions for most alts.”
Ultimately, Deutscher considers there is still room to make big profits this cycle “even without the face-melting altseason we all crave.”

Prospects of Ethereum ETFs Drive Grayscale Ethereum Trust’s NAV Discount to Lowest Since 2021
 On May 21, with the potential approval of several spot ethereum exchange-traded funds (ETFs) by the U.S. Securities and Exchange Commission (SEC), Grayscale’s Ethereum Trust (ETHE) saw its discount to net asset value (NAV) reach its lowest point since 2021. Grayscale Ethereum Trust’s NAV Discount Diminishes to 2021 Levels About a week ago, Grayscale’s Ethereum […]
Bitcoin News
Silver Squeeze: Precious Metal Soars 11.8% in 5 Days, Reaching Its Highest Price Since 2013
 This week, the price of one ounce of silver has seen a significant rise. Over the past five days, silver has increased by more than 11% against the U.S. dollar, surpassing gold’s 2.3% five-day gain. Silver reached per troy ounce for the first time since February 2013. Silver Hits per Ounce, Outperforms Gold […]
Bitcoin News