 The Financial Services Regulatory Authority (FSRA) of the Abu Dhabi Global Market (ADGM) and the Bermuda Monetary Authority (BMA) have signed a digital assets Memorandum of Understanding (MOU). This MOU establishes a framework for collaboration between the two regulatory authorities to support the creation and effective supervision of digital assets entities across their jurisdictions. It […]
Bitcoin News
Report: Speculation Returns as Bitcoin Market Shows Signs of Recovery
 Glassnode’s latest onchain analysis reveals a resurgence in speculative activity in the bitcoin (BTC) market after months of stagnation. This shift marks a potential change in market sentiment, with both short and long-term holders displaying increased engagement. Mt Gox Preparations Spark New Wave of Bitcoin Speculation Analysts at Glassnode reported the reappearance of speculative behavior […]
Bitcoin News
Bitcoin Technical Analysis: BTC Shows Promising Signs Across All Time Frames
 Bitcoin’s price currently stands at ,347, showing an impressive rise within the 24-hour intraday range of ,065 to ,595. With a trading volume of .17 billion and a market capitalization of .4 trillion, bitcoin has gained 4.9% this week, 5.6% over the past two weeks, and 14.4% in the last 30 days. Bitcoin Bitcoin’s 1-hour […]
Bitcoin News
Altcoins: Analyzing Key Signs For A Potential Boom – Or Bust
Altcoins are generating significant buzz among cryptocurrency watchers, as rumors of a potential Bitcoin breakout circulate. After weeks of sluggish trading, a recent surge of capital has revitalized the king of coins. This raises a pressing question: will altcoins ride the wave, or are they doomed to be left behind?
Whispers Of A Bitcoin Bonanza
Data from Farside Investors reveals a significant shift in investor sentiment. Nearly 0 million flowed into Bitcoin exchange-traded funds (ETFs) on June 4th, a clear sign of renewed interest. This surge in buying could act as a catalyst, sparking a wave of speculation and propelling Bitcoin prices upwards.
However, the question remains: how will this newfound focus on Bitcoin impact the broader cryptocurrency market? Historically, strong Bitcoin rallies have often been followed by altcoin seasons, periods where alternative cryptocurrencies experience explosive growth. But is this time different?
Altcoin Season: Just Over The Horizon?
The Altcoin Season Index, a metric that gauges market sentiment towards altcoins, currently sits at a lowly 35. This stands in stark contrast to the readings of 80 observed just six months ago. This suggests that altcoins are not yet basking in the reflected glory of Bitcoin’s potential rise.
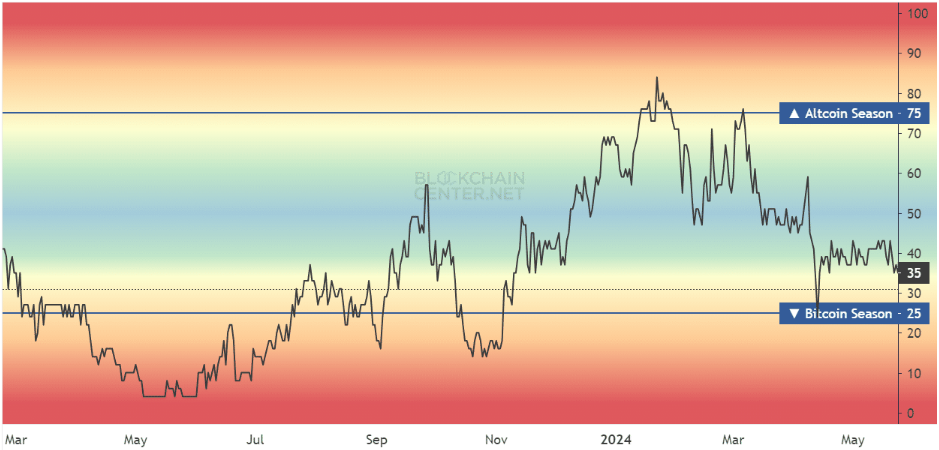
Experts believe that even with a Bitcoin surge, only a select few altcoins are likely to outperform the market leader. To truly unleash an altcoin season, the Altcoin Season Index would need to climb above 75, a sign of widespread bullishness across the entire altcoin ecosystem.
Why Altcoins Might Struggle To Shine
The sheer number of altcoins compared to previous cycles also throws a wrench into the altcoin season equation. In 2017 and 2021, for instance, the altcoin market was a much smaller pond. When Bitcoin surged, investor money flowed more readily into a smaller pool of altcoins, leading to significant price increases across the board.
Today, the landscape is vastly different. With thousands of altcoins vying for investor attention, any gains during an altcoin season might be concentrated in just a handful of high-performing projects, leaving the vast majority behind.
Bitcoin Dominance: A Key Indicator To Watch
Another crucial factor to consider is Bitcoin Dominance (BTC.D). This metric reflects Bitcoin’s market capitalization as a percentage of the total crypto market cap. Historically, a significant decline in BTC.D has coincided with altcoin seasons. In early 2021, for example, the coin’s dominance level plummeted from 70% to 40%, paving the way for a period of explosive altcoin growth.
Currently, however, BTC.D is on the rise, suggesting that altcoins are not yet the center of attention. Investors looking for altcoin opportunities should keep a close eye on this metric, as a sustained downtrend in the crypto’s dominance could be a harbinger of an approaching altcoin season.
Featured image from Indiana Daily Student, chart from TradingView
AVAX Primed To Break $100 Barrier As Bullish Signs Emerge
Avalanche (AVAX), the token powering the smart contracts platform Avalanche, is stirring excitement in the crypto sphere. Bullish technical indicators and upcoming developments within the Avalanche ecosystem are fueling speculation of a significant price surge, with some analysts eyeing a potential rally above 0.
Technicals Flash Green: A Bounce In Sight?
Technical analysis based on historical data and chart patterns paints a promising picture for AVAX. Analysts point to a recent corrective phase that the token appears to have overcome, potentially setting the stage for a new uptrend. Charts on trading platforms like Binance depict a support zone between .45 and .00, suggesting a strong base from which the price could bounce higher.
$AVAX looking for 100+ pic.twitter.com/GUXx2EeB5e
— ᴀʟᴛꜱᴛʀᴇᴇᴛ ʙᴇᴛꜱ (@AltstreetBet) June 5, 2024
Avalanche ICO Season On The Horizon?
Beyond technical indicators, the buzz surrounding Avalanche stems from exciting developments brewing within its ecosystem. The project’s developers are gearing up to launch Layer 1 blockchains (L1s) that inherit Avalanche’s secure and scalable consensus mechanism.

This innovation could significantly simplify the process of launching new blockchains, similar to how ERC-20 tokens are built on top of the Ethereum network. Furthermore, Avalanche’s CEO, Emin Gun Sirer, recently teased a novel concept – Initial Chain Offerings (ICOs). Unlike the traditional Initial Coin Offering (ICO) model where individual tokens are sold, ICOs would involve offering entirely new blockchains to investors.
This paves the way for a potential “Avalanche ICO season,” mirroring the ICO boom witnessed in the early days of cryptocurrencies. Market observers believe this could attract a surge of interest and investment into the Avalanche ecosystem, potentially boosting the price of AVAX.
Key Resistance Levels To Watch
Moving on to the price targets, analysts have identified key resistance levels at and . Overcoming these hurdles could propel AVAX towards its ambitious long-term target of 0. However, the confluence of bullish technical indicators and groundbreaking developments within the Avalanche ecosystem is undeniable.
AVAX Price Forecast
Meanwhile, according to the latest analysis, the price of AVAX is expected to surge by an impressive 227%, potentially reaching 9 by July 5, 2024. The current market sentiment, as indicated by technical indicators from CoinCodex, is Neutral.
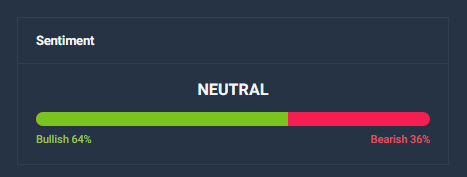
This is in sync with the Fear & Greed Index, which stands at 75, indicating a prevailing sentiment of Greed among investors. Over the past 30 days, Avalanche has experienced 11 green days, constituting 37% of the period, with a price volatility rate of 5.59%. These factors suggest a relatively stable yet bullish outlook for AVAX in the near term.
The high Fear & Greed Index indicates strong buying interest, which could drive prices higher. Despite the neutral sentiment, the significant projected price increase reflects positive market dynamics and investor confidence in Avalanche.
Featured image from LinkedIn, chart from TradingView
Worrying Signs For XRP: Price Tumbles As Demand Dries Up
Crypto investors are keeping a close eye on Ripple (XRP) as technical indicators paint a concerning picture for the altcoin’s price. After closing below its 20-day exponential moving average (EMA) for four consecutive days, XRP has entered what many analysts interpret as a bearish zone.
This technical indicator suggests a potential shift in market sentiment, with the average price of XRP over the past 20 days acting as a resistance level. With the current price trading below this key benchmark, analysts fear a decline in demand could be imminent.
At the time of writing, XRP was trading at .52, down 0.3% and 3.1% in the last 24 hours and seven days, respectively, data from Coingecko shows.
Demand For XRP Loses Steam
Adding fuel to the bearish fire are XRP’s momentum indicators, which provide insights into the strength and direction of price movements. Both the Relative Strength Index (RSI) and Money Flow Index (MFI) are currently positioned below their neutral points. This suggests that buying pressure behind XRP is waning, with investors potentially looking to offload their holdings rather than accumulate more.
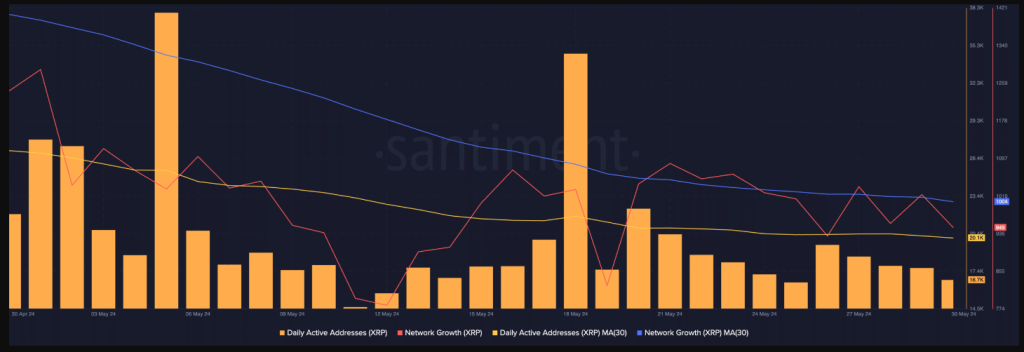
Further dampening the mood is a significant drop in XRP’s active on-chain addresses. According to data from Santiment, the number of daily active addresses on the XRP network has cratered by 30% over the past month. This decline is often seen as a precursor to a price slump, as it indicates a decrease in overall network activity and user engagement.
Profit Amidst The Gloom?
However, there are some glimmers of hope for XRP bulls. An interesting data point reveals that daily traders are still managing to turn a profit. An analysis of XRP’s daily transaction volume in profit compared to loss shows that for every transaction ending in a loss, 1.16 transactions yield profits. This suggests that despite the overall bearish sentiment, short-term trading opportunities might exist for skilled investors who can capitalize on market volatility.
MVRV Ratio Offers A Different Perspective
Another factor that could entice some investors is the negative Market Value to Realised Value (MVRV) ratio for XRP. This metric essentially compares the current market price of XRP with the average price at which all XRP tokens were acquired.
A negative MVRV ratio suggests that XRP is currently undervalued, potentially presenting a buying opportunity for investors seeking assets trading below their historical price points.
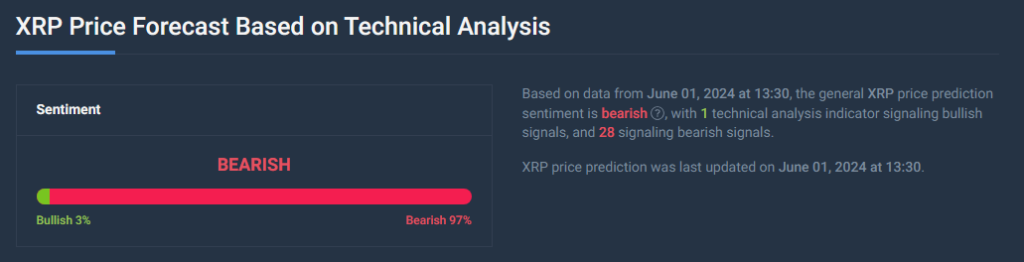
XRP Price Forecast
Meanwhile, the current XRP price prediction indicates a 20% rise to .626627 by July 1, 2024, despite a bearish market sentiment reflected by technical indicators. The Fear & Greed Index at 72 shows high investor greed, suggesting strong buying behavior but also a risk of overbought conditions and potential price corrections if sentiment shifts.
Over the last 30 days, XRP has had almost an equal number of days with price increases (47%). This shows a balance between buying and selling pressures.
The price has fluctuated by 2%, indicating mostly stable but noticeable changes. This balance suggests the market is steady, contributing to the current bearish outlook despite a positive long-term price prediction.
Featured image from Verywell Mind, chart from TradingView
XRP Price Shows Signs of Recovery Within Range: Can it Spark a Rally?
XRP price is attempting a fresh increase above the .5050 resistance. The price could gain bullish momentum if it clears the .520 resistance.
- XRP is eyeing a steady move above the .520 level.
- The price is now trading above .5120 and the 100-hourly Simple Moving Average.
- There was a break above a short-term declining channel with resistance at .5025 on the hourly chart of the XRP/USD pair (data source from Kraken).
- The pair could start another increase if there is a close above the .520 resistance.
XRP Price Eyes Breakout
Yesterday, we saw how XRP price started a recovery wave, like Bitcoin and Ethereum. The price was able to settle above the .4950 and .50 resistance levels.
There was a break above a short-term declining channel with resistance at .5025 on the hourly chart of the XRP/USD pair. The pair even cleared the .5150 resistance level and settled above the 100-hourly Simple Moving Average.
It traded as high as .5195 and is currently consolidating gains above the 23.6% Fib retracement level of the upward move from the .4980 swing low to the .5195 high. The price is also trading above .5120 and the 100-hourly Simple Moving Average.
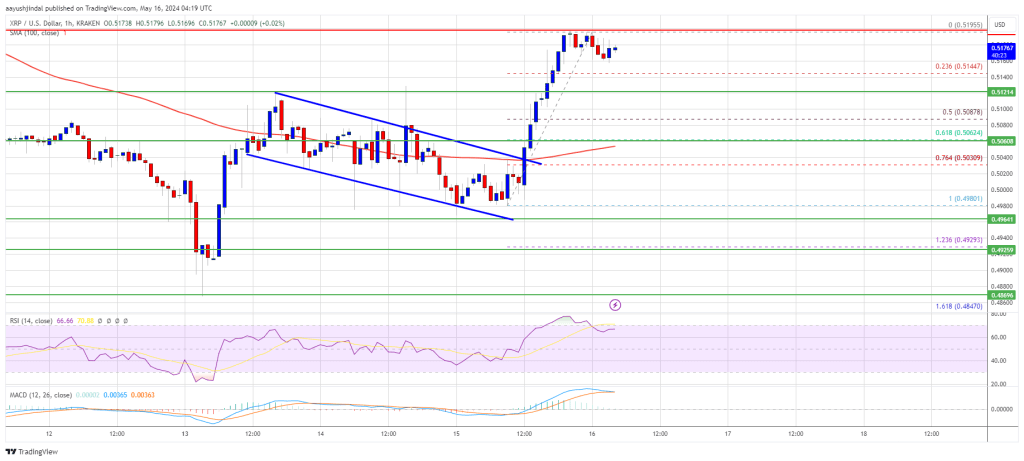
Immediate resistance is near the .5185 level. The first key resistance is near .5200. A close above the .5200 resistance zone could send the price higher. The next key resistance is near .5220. If the bulls remain in action above the .5220 resistance level, there could be a rally toward the .5350 resistance. Any more gains might send the price toward the .550 resistance.
Another Decline?
If XRP fails to clear the .520 resistance zone, it could start another decline. Initial support on the downside is near the .5145 level. The next major support is at .5120.
If there is a downside break and a close below the .5120 level, the price might accelerate lower. In the stated case, the price could even drop below the .5050 support zone or the 61.8% Fib retracement level of the upward move from the .4980 swing low to the .5195 high.
Technical Indicators
Hourly MACD – The MACD for XRP/USD is now losing pace in the bullish zone.
Hourly RSI (Relative Strength Index) – The RSI for XRP/USD is now above the 50 level.
Major Support Levels – .5120 and .5050.
Major Resistance Levels – .5200 and .5220.
South African Fintech Startup Leseka Tech Signs Deal to Buy Payments Provider for $86M
 Lesaka Technologies, a fintech startup based in South Africa, recently signed a deal to acquire Adumo, a payment solutions provider, for nearly million. Under the terms of the agreement, Lesaka Technologies will pay Adumo .5 million in cash. The funds will be sourced both internally and from external financiers. Lesaka Technologies to Issue Shares […]
Bitcoin News
TON Price Surges 15% In A Day But Signs of Bullish Exhaustion Emerge
TON price rallied nearly 15% and traded above the .50 resistance. Toncoin is now showing a few signs of trend exhaustion and might correct gains.
- Toncoin jumped above the .20 and .50 resistance levels.
- The price is now trading above .50 and the 100-hourly Simple Moving Average.
- There is a key parabolic curve forming with support at .80 on the hourly chart of the TON/USD pair (data source from Kraken).
- The pair could start a downside correction if it declines below .80 and the .60.
TON Price Reaches
Recently, TON price started a strong increase from the .60 support zone. It climbed above the .20 resistance zone. It gained nearly 15% in a day and outperformed Bitcoin and Ethereum.
Toncoin traded close to the .00 level. A high was formed at .93 and the price is now consolidating gains. It is trading near the .80 zone and well above the 100-hourly Simple Moving Average. There is also a key parabolic curve forming with support at .80 on the hourly chart of the TON/USD pair.
Immediate resistance is near the .92 level. The first key resistance is near .00. A close above the .00 resistance zone could spark a strong increase.
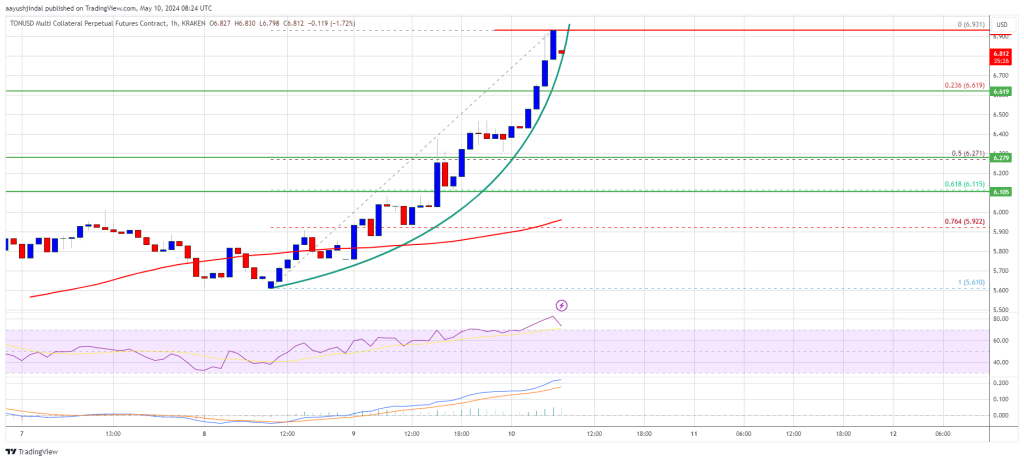
Source: TONUSD on TradingView.com
The next key resistance is near .20. If the bulls remain in action above the .20 resistance level, there could be a rally toward the .55 resistance. Any more gains might send the price toward the .00 resistance.
Downside Correction In Toncoin?
If Toncoin price fails to clear the .90 resistance zone, it could start a downside correction. Initial support on the downside is near the .80 level and the parabolic curve, below which the price might test the 23.6% Fib retracement level of the upward move from the .61 swing low to the .93 high.
The next major support is at .25 or the 50% Fib retracement level of the upward move from the .61 swing low to the .93 high. If there is a downside break and a close below the .25 level, the price might accelerate lower. In the stated case, the price could retest the .00 support zone.
Technical Indicators
Hourly MACD – The MACD for TON/USD is now losing pace in the bullish zone.
Hourly RSI (Relative Strength Index) – The RSI for TON/USD is now above the 70 level.
Major Support Levels – .80 and .60.
Major Resistance Levels – .90 and .00.
Bitcoin Price Is Showing Early Signs of Recovery But 100 SMA Is The Key
Bitcoin price found support near the ,600 zone. BTC is recovering but the bears might remain active near the ,200 resistance zone.
- Bitcoin tested the ,60 support zone and started a recovery wave.
- The price is trading near ,000 and the 100 hourly Simple moving average.
- There was a break above a key bearish trend line with resistance at ,000 on the hourly chart of the BTC/USD pair (data feed from Kraken).
- The pair could gain bullish momentum if there is a close above ,200 and the 100 hourly Simple moving average.
Bitcoin Price Starts Recovery
Bitcoin price extended losses below the ,000 and ,200 levels. Finally, the bulls appeared near the ,600 zone. A low was formed at ,650 and the price is now correcting losses.
There was a move above the ,200 and ,000 resistance levels. The price cleared the 23.6% Fib retracement level of the recent drop from the ,500 swing high to the ,650 low. Besides, there was a break above a key bearish trend line with resistance at ,000 on the hourly chart of the BTC/USD pair.
Bitcoin is now trading near ,000 and the 100 hourly Simple moving average. Immediate resistance is near the ,000 level. The first major resistance could be ,200 or the 50% Fib retracement level of the recent drop from the ,500 swing high to the ,650 low or the 100 hourly Simple moving average.
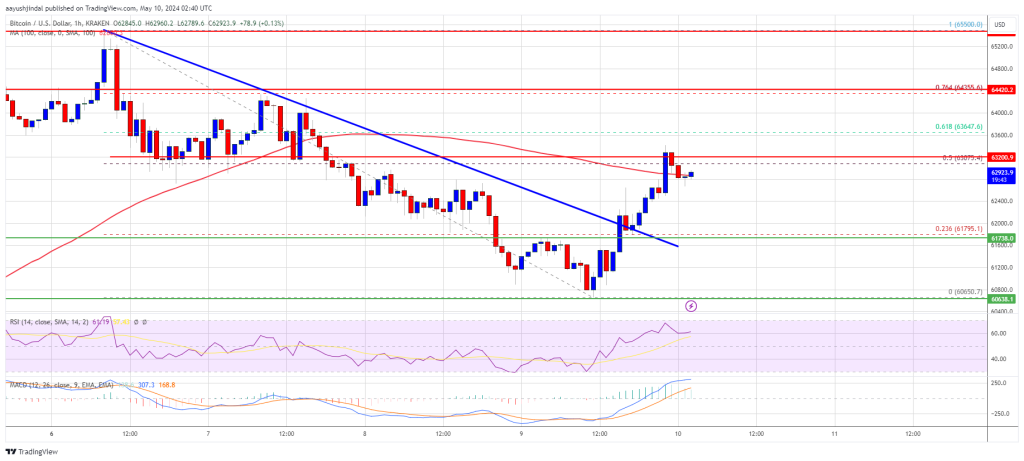
Source: BTCUSD on TradingView.com
The next key resistance could be ,350. A clear move above the ,350 resistance might send the price higher. The main resistance now sits at ,500. If there is a close above the ,500 resistance zone, the price could continue to move up. In the stated case, the price could rise toward ,500.
More Downsides In BTC?
If Bitcoin fails to climb above the ,200 resistance zone, it could start another decline. Immediate support on the downside is near the ,400 level.
The first major support is ,000. If there is a close below ,000, the price could start to drop toward ,200. Any more losses might send the price toward the ,600 support zone in the near term.
Technical indicators:
Hourly MACD – The MACD is now gaining pace in the bullish zone.
Hourly RSI (Relative Strength Index) – The RSI for BTC/USD is now above the 50 level.
Major Support Levels – ,000, followed by ,600.
Major Resistance Levels – ,000, ,200, and ,350.