 Ethereum’s price on May 27, 2024, stands at ,908, reflecting a strong upward trend in the recent trading sessions. Ether’s intraday range has been between ,795 to ,953 over the past 24 hours. Ethereum Ethereum’s 1-hour chart reveals a steady upward trend starting from May 26, peaking at approximately ,953. After reaching this peak, the […]
Bitcoin News
Bitcoin Technical Analysis: BTC Consolidation Signals Range-Bound Activity
 Bitcoin is currently priced at ,350, with a market capitalization of .32 trillion and a trading volume of .36 billion. The cryptocurrency’s price has fluctuated within the range of ,665 to ,028 over the last 24 hours. Bitcoin Recent trends in the daily chart reveal bitcoin (BTC) reaching a peak of ,958 before retreating to […]
Bitcoin News
China’s $53.3B Divestment in US Treasuries Signals Massive Shift From Dollar Assets
 According to records, China has divested .3 billion in U.S. Treasury notes and agency bonds during the first quarter. Some analysts suggest this reduction in foreign exchange reserves might be China’s strategic move to leverage its holdings against the United States. China’s Treasury Holdings Drop Dramatically, Raising Red Flags for U.S. Markets China has significantly […]
Bitcoin News
Chainlink’s (LINK) Outlook Grows Bleak: Signals of Bearish Continuation Surface
Chainlink’s LINK price is struggling to surpass the .80 resistance. The price could continue to move down if it breaks the .00 support.
- Chainlink price is showing bearish signs below the .00 resistance against the US dollar.
- The price is trading below the .60 level and the 100 simple moving average (4 hours).
- There is a key bearish trend line forming with resistance near .50 on the 4-hour chart of the LINK/USD pair (data source from Kraken).
- The price could start a decent increase if it clears the .80 resistance zone.
Chainlink (LINK) Price Turns Red
In the past few days, Chainlink saw a steady decline from well above the .80 level. LINK price declined below the .50 support level to enter a short-term bearish zone, like Bitcoin and Ethereum.
The price tested the .10 support zone. A low was formed at .07 and the price recently attempted a recovery wave. There was a move above the .50 level. It even jumped above the 23.6% Fib retracement level of the downward move from the .30 swing high to the .07 low.
However, the bears were active below the .80 resistance and the 50% Fib retracement level of the downward move from the .30 swing high to the .07 low. LINK price is still trading below the .80 level and the 100 simple moving average (4 hours).
Immediate resistance is near the .50 level. There is also a key bearish trend line forming with resistance near .50 on the 4-hour chart of the LINK/USD pair.
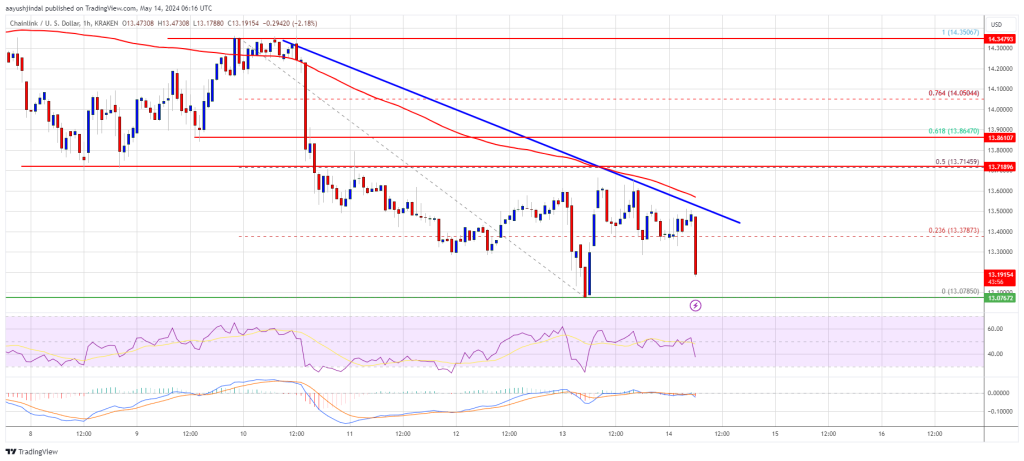
The next major resistance is near the .80 zone. A clear break above .80 may possibly start a steady increase toward the .00 level. The next major resistance is near the .35 level, above which the price could test .50.
More Losses?
If Chainlink’s price fails to climb above the .50 resistance level, there could be a fresh decline. Initial support on the downside is near the .10 level.
The next major support is near the .80 level, below which the price might test the .20 level. Any more losses could lead LINK toward the .50 level in the near term.
Technical Indicators
4 hours MACD – The MACD for LINK/USD is gaining momentum in the bearish zone.
4 hours RSI (Relative Strength Index) – The RSI for LINK/USD is now below the 50 level.
Major Support Levels – .10 and .80.
Major Resistance Levels – .50 and .80.
Bitcoin Price Signals Bearish Continuation, Why BTC Could Drop Below $60K
Bitcoin price started a fresh decline from the ,000 resistance zone. BTC is declining and remains at a risk of more losses below the ,000 level.
- Bitcoin started a fresh decline after it failed near ,000.
- The price is trading below ,000 and the 100 hourly Simple moving average.
- There was a break below a bearish flag pattern with support near ,950 on the hourly chart of the BTC/USD pair (data feed from Kraken).
- The pair could gain bearish momentum if there is a close below the ,000 level.
Bitcoin Price Signals Breakdown
Bitcoin price found support near the ,250 zone and started a recovery wave. BTC was able to recover above the 23.6% Fib retracement level of the downward move from the ,217 swing high to the ,250 low.
However, the bears were active near the ,800 resistance zone. They defended the 50% Fib retracement level of the downward move from the ,217 swing high to the ,250 low. There was a fresh bearish reaction below the ,200 support zone.
There was a break below a bearish flag pattern with support near ,950 on the hourly chart of the BTC/USD pair. Bitcoin is now trading below ,000 and the 100 hourly Simple moving average.
Immediate resistance is near the ,200 level. The first major resistance could be ,000 or the 100 hourly Simple moving average. The next key resistance could be ,500. A clear move above the ,500 resistance might send the price higher.
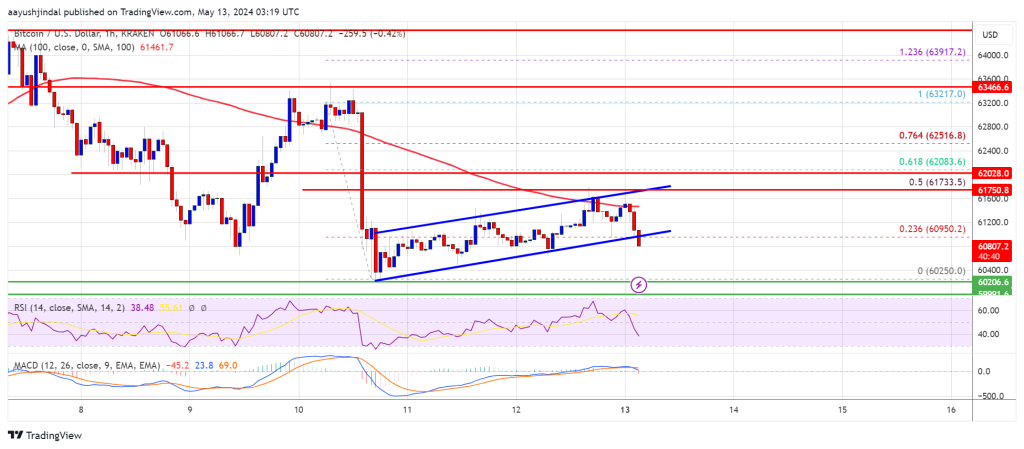
Source: BTCUSD on TradingView.com
The main resistance now sits at ,500. If there is a close above the ,500 resistance zone, the price could continue to move up. In the stated case, the price could rise toward ,000.
More Downsides In BTC?
If Bitcoin fails to climb above the ,200 resistance zone, it could continue to move down. Immediate support on the downside is near the ,500 level.
The first major support is ,000. If there is a close below ,000, the price could start to drop toward ,500. Any more losses might send the price toward the ,650 support zone in the near term.
Technical indicators:
Hourly MACD – The MACD is now gaining pace in the bearish zone.
Hourly RSI (Relative Strength Index) – The RSI for BTC/USD is now below the 50 level.
Major Support Levels – ,500, followed by ,000.
Major Resistance Levels – ,200, ,200, and ,500.
Ethereum Price Signals Fresh Increase Unless Fails To Surpass $3,080
Ethereum price started a recovery wave from the ,940 support. ETH could gain bullish momentum if it clears the ,055 and ,080 resistance levels.
- Ethereum found support near ,940 and started a steady increase.
- The price is trading near ,030 and the 100-hourly Simple Moving Average.
- There was a break above a major bearish trend line with resistance at ,990 on the hourly chart of ETH/USD (data feed via Kraken).
- The pair must surpass the ,080 resistance to continue higher in the near term.
Ethereum Price Holds Support
Ethereum price extended losses below the ,000 level, like Bitcoin. Finally, the bulls appeared near the ,940 and ETH started a recovery wave. A low was formed at ,936 and the price started an upside correction.
There was a decent increase above the ,980 level. The price cleared the 23.6% Fib retracement level of the downward move from the ,218 swing high to the ,936 low. Besides, there was a break above a major bearish trend line with resistance at ,990 on the hourly chart of ETH/USD.
Ethereum is now trading near ,030 and the 100-hourly Simple Moving Average. Immediate resistance is near the ,040 level and 100-hourly Simple Moving Average. The first major resistance is near the ,080 level or the 50% Fib retracement level of the downward move from the ,218 swing high to the ,936 low.
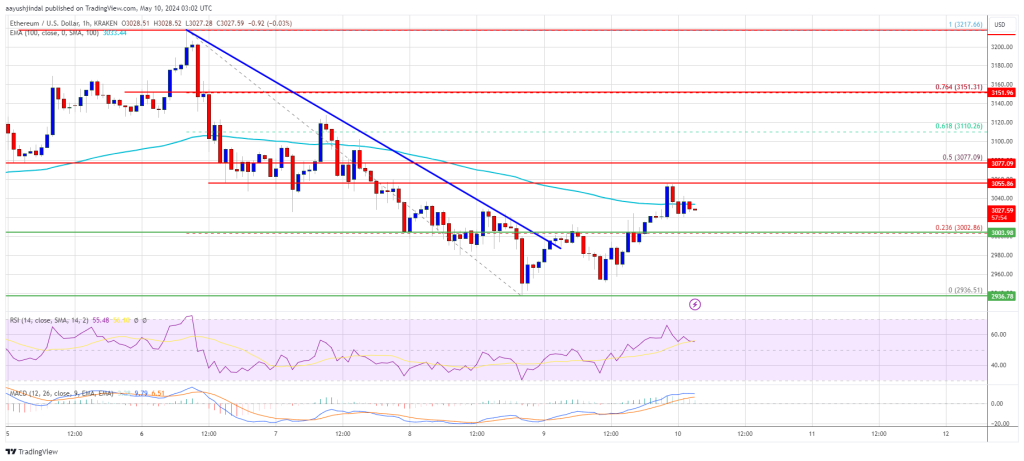
Source: ETHUSD on TradingView.com
The next key resistance sits at ,150, above which the price might gain traction and rise toward the ,220 level. If there is a clear move above the ,220 level, the price might rise and test the ,350 resistance. Any more gains could send Ether toward the ,550 resistance zone.
Another Decline In ETH?
If Ethereum fails to clear the ,080 resistance, it could start another decline. Initial support on the downside is near the ,000 level. The first major support is near the ,935 zone.
The next support is near the ,880 level. A clear move below the ,880 support might push the price toward ,720. Any more losses might send the price toward the ,650 level in the near term.
Technical Indicators
Hourly MACD – The MACD for ETH/USD is gaining momentum in the bullish zone.
Hourly RSI – The RSI for ETH/USD is now above the 50 level.
Major Support Level – ,935
Major Resistance Level – ,080
Bitcoin Price Signals Uptrend Continuation But Patience Is The Key
Bitcoin price extended its increase above the ,000 resistance. BTC is now holding gains above ,800 and might aim for more upsides.
- Bitcoin traded to a new weekly high at ,500 before there was a downside correction.
- The price is trading above ,500 and the 100 hourly Simple moving average.
- There is a key bullish trend line forming with support at ,350 on the hourly chart of the BTC/USD pair (data feed from Kraken).
- The pair could aim for more upsides if it clears the ,500 and ,500 resistance levels.
Bitcoin Price Aims Higher
Bitcoin price remained well-bid above the ,500 support zone and extended its increase. BTC was able to clear the ,500 resistance. It even cleared ,000 and tested ,500.
A high was formed at ,550 and the price is now correcting gains. There was a minor decline below the ,000 level. The price tested the 23.6% Fib retracement level of the upward move from the ,380 swing low to the ,550 high.
However, the bulls are active near the ,000 zone. There is also a key bullish trend line forming with support at ,350 on the hourly chart of the BTC/USD pair.
Bitcoin is now trading above ,000 and the 100 hourly Simple moving average. Immediate resistance is near the ,500 level. The first major resistance could be ,000. The next key resistance could be ,500.
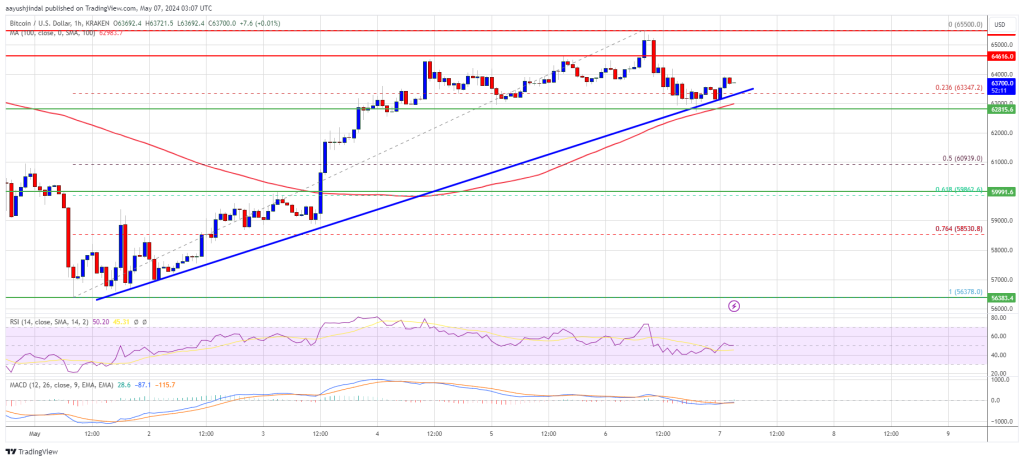
Source: BTCUSD on TradingView.com
A clear move above the ,500 resistance might send the price higher. The next resistance now sits at ,200. If there is a clear move above the ,200 resistance zone, the price could continue to move up. In the stated case, the price could rise toward ,800.
Another Drop In BTC?
If Bitcoin fails to rise above the ,500 resistance zone, it could start another decline. Immediate support on the downside is near the ,350 level and the trend line.
The first major support is ,800. If there is a close below ,800, the price could start to drop toward the 50% Fib retracement level of the upward move from the ,380 swing low to the ,550 high at ,800. Any more losses might send the price toward the ,000 support zone in the near term.
Technical indicators:
Hourly MACD – The MACD is now gaining pace in the bullish zone.
Hourly RSI (Relative Strength Index) – The RSI for BTC/USD is now near the 50 level.
Major Support Levels – ,350, followed by ,800.
Major Resistance Levels – ,500, ,000, and ,500.
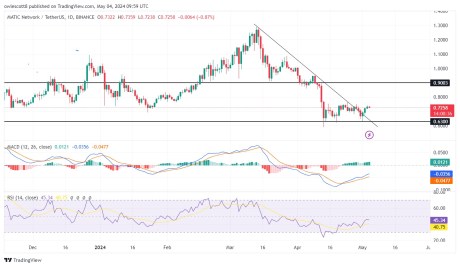
MATIC Bullish Signals Abound: Technical Indicators Hint At Sustained Uptrend
MATIC is the native utility token of the Polygon blockchain and it is currently ranked 18th by market cap, with a total supply of 10 billion MATIC and a total trading volume of over 4 million in the last 24 hours. It has been moving upward since its last rejection at a .6342 support level.
Following the recent bullish trend of the crypto market, MATIC has not been left behind as the price has been on an uptrend with very strong momentum for a while now. Since its last rejection point, MATIC has seen a price reversal of over 10%.
Technical Indicators Point Toward Sustained Uptrend For MATIC
To figure out where MATIC’s price might be headed next, several indicators can be used to examine the chart;
1-Day MACD: A technical look at the MACD indicator from the 4-hour timeframe, the MACD histograms are trending above the zero line, and both the MACD line and the Signal line have crossed and are heading towards the MACD zero line, indicating a bullish trend.
1-Day RSI: the formation of the Relative Strength Index (RSI) in the above image also suggests an upward movement as the RSI signal line is seen moving toward the 50% level. This indicates that buyers are gradually becoming active in the market therefore overpowering the strength of sellers.
4-hour Alligator: A look at the alligator indicator from the 4-hour time frame shows that the crypto asset is trading above the alligator lines as the alligator lip and teeth have both successfully crossed above the alligator jaw, suggesting that the price might continue to move in an upward direction.

Potential Price Movement
From the previous downward movement, the price of MATIC has managed to create one major resistance level of .7365 and one major support level of .6324. Currently, MATIC is moving toward this resistance level and if it breaks above this level, it might go even further to test the next resistance level of .7680.
However, if it fails to break above this major resistance, it will reverse and start a downward movement toward its previous support. Also, if it manages to break below this support level, the price might move further downward thereby continuing on its downtrend. As of the time of writing the price of MATIC was trading around .7253 and about -0.94% down in the last 24 hour
Raoul Pal Signals ‘Banana Zone’ Rally, Predicts Strong ‘Crypto Summer’ for Digital Assets
 With cryptocurrency values on the decline and bitcoin down 13% from a month ago, British financial expert Raoul Pal predicts a rebound during the “Crypto Summer.” According to Pal, this rise will generate widespread excitement, and “everything will get caught up in euphoria.” British Financial Guru Spells Out Next Big Crypto Wave: ‘Full Mania’ Expected […]
Bitcoin News
Cracking the Crypto Code: ETH/BTC Signals The Next Altcoin Explosion – Here’s How
Recently, a seasoned crypto investor, Daan Crypto Trades, offered a fresh perspective on evaluating altcoin market sentiment.
Daan believes the ETH/BTC ratio is a superior indicator of altcoin market sentiment over the SOL/BTC ratio, showing data that suggests the potential for an upcoming altcoin season.
ETH/BTC vs. SOL/BTC: Decoding The True Alts Barometer
Daan Crypto Trades has challenged the emerging view that SOL/BTC might be a better gauge for altcoin strength, arguing instead for the enduring relevance of ETH/BTC. According to Daan, while Solana’s performance has been notable, it hasn’t significantly impacted Bitcoin’s dominance, which remains strong.
This observation suggests that SOL/BTC may not accurately reflect broader alternative coins market trends. On the other hand, ETH/BTC has historically mirrored shifts in altcoin market sentiment more closely, making it a more reliable metric.
This distinction is crucial for investors seeking to understand the real-time health and potential shifts within the broader altcoin market.
Seeing a lot of people claim $SOL/BTC is a better proxy for general alt strength than ETH/BTC.$SOL performed extremely well and the general alt market underperformed BTC as BTC.D grinded higher.
Therefore, I would not say SOL/BTC is a good gauge for overall altcoin strength at… https://t.co/8KpdnACoOt
— Daan Crypto Trades (@DaanCrypto) April 28, 2024
Daan’s analysis points out that significant movements in the ETH/BTC ratio have often preceded dynamic phases in the altcoin market, commonly referred to as ‘altcoin seasons.’ These periods are characterized by rapid price increases across altcoins, often outpacing Bitcoin.
Signs Of An Emerging Altcoin Season?
Current market analysis by Daan and on-chain data from Santiment underline a brewing sentiment that could lead to another alternative coins season. Santiment’s report highlights an unusual accumulation pattern across altcoins, with their Market Value to Realized Value (MVRV) ratios suggesting many are undervalued.
Over 85% of altcoins analyzed are currently positioned in what Santiment describes as the historical “opportunity zone.” This zone indicates that the assets are trading below their realized value, presenting potential buying opportunities for savvy investors.
According to our model, the mid-term gains and losses by average wallets indicate heavy realized losses across most #altcoins. Over 85% of assets we track are in a historic opportunity zone when calculating the market value to realized value (MVRV) of wallets’ collective… pic.twitter.com/NogkCSH5PG
— Santiment (@santimentfeed) April 25, 2024
Further reinforcing this sentiment, the Bitcoin dominance index (BTC.D), which tracks Bitcoin’s market cap relative to the entire crypto market, has slightly declined. BTC.D has dropped from 57.10% as of the middle of this month to roughly 54.69% as of today.
This decline could suggest that capital is beginning to flow more substantially into altcoins. Notably, the combination of favorable MVRV ratios and shifting dominance lends credence to Daan’s assertion that an alternative coins season may be on the horizon, ready to unleash notable gains similar to past cycles.
Featured image from Unsplash, Chart from TradingView