 Ten days ago, after former President Donald Trump was convicted on 34 counts connected to a hush-money scheme, Polymarket bets indicated his chances of winning the 2024 election still stood at 54%, compared to incumbent President Joe Biden’s 40%. Since that time, the gap between Trump and Biden has widened significantly, with Polymarket odds increasingly […]
Bitcoin News
Blockchain Futurist Conference Coming Together with Emerald to Elevate Canadian Show and Expand to US in 2025
 PRESS RELEASE. Toronto [May 29, 2024] Blockchain Futurist Conference is coming together with Emerald, America’s largest producer of business-to-business trade shows, and their associated conferences, content and commerce, to grow the Canadian show and expand to the US Market. As Canada’s largest and longest-running Web3 event, Blockchain Futurist Conference has been a cornerstone of the […]
Bitcoin News
Tens of Thousands Show Overwhelming Support for Abolishing the Fed, US Policymaker’s Poll Reveals
 On May 15, Thomas Massie, a Republican member of the United States House of Representatives, posted on X, inquiring whether he should introduce legislation to abolish the U.S. Federal Reserve. The poll garnered over 115,000 votes, with a significant 86% majority opting to “end the Fed.” Rep. Thomas Massie Questions Introducing Bill to Abolish U.S. […]
Bitcoin News
Historical Trends Show What To Expect For Bitcoin Price Following The Halving
The 2024 Bitcoin halving is only two days away, and there are already varying expectations of what might happen to the BTC price once the event is completed. One way to get an idea of how it could play out for the Bitcoin price, though, is through historical data and how the cryptocurrency has performed at times like these.
Bitcoin Price Trends For Previous Halvings
There have been three halvings so far since Bitcoin was first launched in 2009 and with each one, Bitcoin has demonstrated various reactions to the event. The first halving took place on November 28, 2012, the second happened on July 9, 2016, and the last one was on May 11, 2020.
For the purpose of this report, only the last two halving will be referenced given that adoption had began to climb at the time that these two happened. The 2016 halving happened when Bitcoin was trading around 0, but in the weeks following the halving, the BTC price would drop another 30%, reaching as low as 0 before climbing back up once again.
Then, during the 2020 halving, the BTC price was trending just under ,000, and following the halving, would see a drop in price as well. However, this drop was not as significant as the 2016 drop, with the BTC price only falling around 15% during this time.
This has formed quite a trend with the halving, where the Bitcoin price falls after the event, which is expected to be bullish. Therefore, if this trend continues, then BTC could see a sharp drop in price despite the expectation that the halving will be bullish for price.
However, it is important to consider that subsequent halvings have seen a lower post-halving crash compared to their predecessors. So, if this holds this year, Bitcoin could still be looking at a crash but to a much lesser degree. For example, the 2020 post-halving crash was half of the 2016 post-halving crash, so holding this trend, the crash this time around could only be an around 7-8% crash.
BTC Deviates From Established Halving Trends
While the historical data does suggest where Bitcoin could be headed following the crash, it is also important to note that the digital asset has deviated from a number of pre-halving trends. One of these deviations is the fact that the Bitcoin price hit a new all-time high before the halving, something that has never happened before. This could suggest that there will be a complete deviation from these established trends, meaning that a crash may not follow the halving after all.
Another deviation is that the few weeks leading up to the last two Bitcoin halvings have been green. However, in 2024, the last three weeks leading up to the halving have been red as the BTC price has been in decline. This also lends credence to the fact that there could also be a deviation from its post-halving trends.
One thing to keep in mind though, is that the crypto market has always been uncertain and Bitcoin has a habit of doing what no one expected. The Bitcoin Fear & Greed Index has seen a pull back from the extreme greed territory, but it continues to remain in greed, which means investors are still bullish. In this case, if Bitcoin were to do the opposite of what is expected, then it could follow the established trend and crash back down.
Ethereum Price Stuck Near $3K, Indicators Show Risk of Downside Break
Ethereum price is still facing many hurdles near ,200. ETH could start another major decline if the price stays below ,200 and ,280.
- Ethereum is struggling to recover above the ,200 resistance zone.
- The price is trading below ,200 and the 100-hourly Simple Moving Average.
- There is a key bearish trend line forming with resistance at ,120 on the hourly chart of ETH/USD (data feed via Kraken).
- The pair could start another decline if there is a close below the ,900 support zone.
Ethereum Price Consolidates
Ethereum price found support and attempted a recovery wave above the ,000 resistance zone. ETH was able to climb above the ,200 level. However, the bears were active near the ,280 resistance zone.
A high was formed at ,278 and the price reacted to the downside, like Bitcoin. It dipped below the 23.6% Fib retracement level of the upward move from the ,536 swing low to the ,278 high. Ethereum is now trading below ,200 and the 100-hourly Simple Moving Average.
Immediate resistance is near the ,100 level. There is also a key bearish trend line forming with resistance at ,120 on the hourly chart of ETH/USD. The first major resistance is near the ,200 level and the 100-hourly Simple Moving Average.
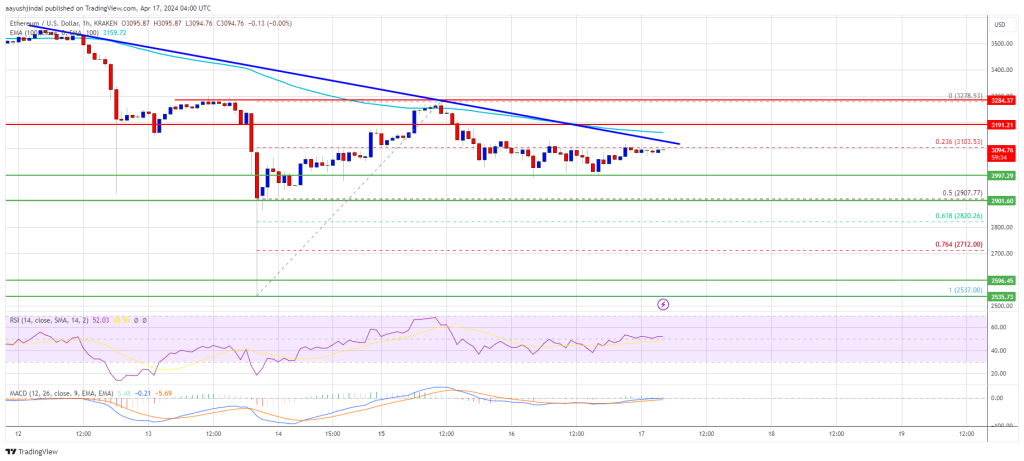
Source: ETHUSD on TradingView.com
The next key resistance sits at ,280, above which the price might rise toward the ,350 level. The key hurdle could be ,500, above which Ether could gain bullish momentum. In the stated case, the price could rise toward the ,620 zone. If there is a move above the ,620 resistance, Ethereum could even climb toward the ,750 resistance.
Another Decline In ETH?
If Ethereum fails to clear the ,200 resistance, it could start another decline. Initial support on the downside is near the ,000 level.
The first major support is near the ,900 zone or the 50% Fib retracement level of the upward move from the ,536 swing low to the ,278 high. The next key support could be the ,710 zone. A clear move below the ,710 support might send the price toward ,650. Any more losses might send the price toward the ,550 level.
Technical Indicators
Hourly MACD – The MACD for ETH/USD is losing momentum in the bearish zone.
Hourly RSI – The RSI for ETH/USD is now above the 50 level.
Major Support Level – ,900
Major Resistance Level – ,200
Digital Renaissance: Global Market of Artification Brings Rubens and Rembrandt Artworks to Global Blockchain Show
 PRESS RELEASE. Dubai, April 12, 2024: The Global Blockchain Show is pleased to announce Global Market of Artification (GMA) as its diamond sponsor at the upcoming two-day conference, set to take place at the Grand Hyatt, Dubai. Artworks by renowned masters like Rubens and Rembrandt will be featured at the event. With the inclusion of […]
Bitcoin News
Global AI Show and Global Blockchain Show Premier in Dubai
 PRESS RELEASE. Dubai, April 8th, 2024: VAP Group is pleased to announce the inaugural edition of the Global AI Show and the Global Blockchain Show scheduled to take place on April 16 and 17, 2024 at the Grand Hyatt, Dubai. The Global AI Show is a power stage hosting international and regional thought leaders in […]
Bitcoin News
XRP Price Holds Support – Indicators Show Risk of Downside Break
XRP price is holding gains above the .60 zone. The price could gain bearish momentum if there is a close below the .570 support zone.
- XRP is facing a major hurdle near the .6580 zone.
- The price is now trading below .640 and the 100 simple moving average (4 hours).
- There is a key bearish trend line forming with resistance near .640 on the 4-hour chart of the XRP/USD pair (data source from Kraken).
- The pair could gain bearish momentum if there is a close below the .5720 support.
XRP Price Faces Uphill Task
After a steady decline, XRP price found support near the .5720 level. A low was formed at .5714 and the price started a fresh increase, like Bitcoin and Ethereum.
There was a move above the .5880 and .600 resistance levels. The price cleared the 23.6% Fib retracement level of the downward wave from the .7442 swing high to the .5714 low. The bulls pushed the price above the .620 resistance zone, but the bears are active near .640.
Ripple’s token price is now trading above .6320 and the 100 simple moving average (4 hours). On the upside, immediate resistance is near the .640 zone. There is also a key bearish trend line forming with resistance near .640 on the 4-hour chart of the XRP/USD pair.
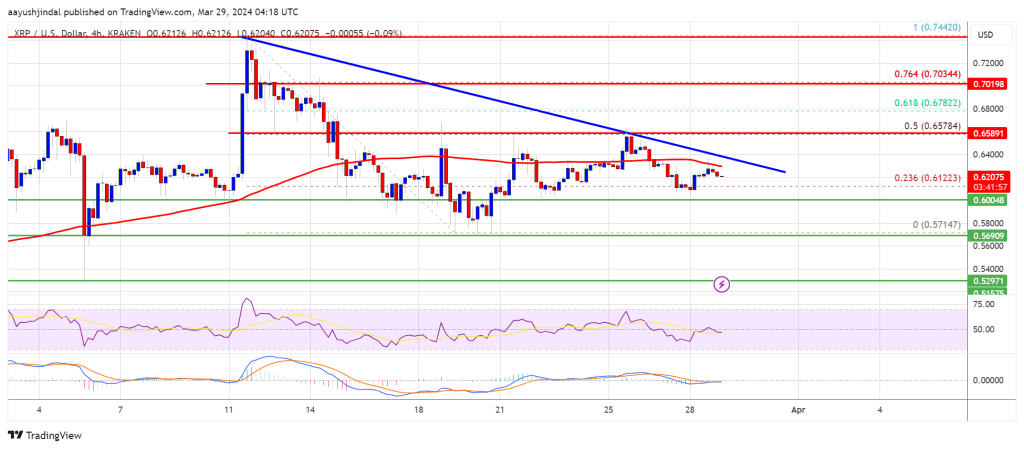
The next key resistance is near .6580. It is close to the 50% Fib retracement level of the downward wave from the .7442 swing high to the .5714 low. A close above the .6580 resistance zone could spark a strong increase. The next key resistance is near .700. If the bulls remain in action above the .700 resistance level, there could be a rally toward the .7440 resistance. Any more gains might send the price toward the .800 resistance.
More Losses?
If XRP fails to clear the .640 resistance zone, it could start another decline. Initial support on the downside is near the .600 zone.
The next major support is at .5720. If there is a downside break and a close below the .5720 level, the price might accelerate lower. In the stated case, the price could retest the .5250 support zone.
Technical Indicators
4-Hours MACD – The MACD for XRP/USD is now losing pace in the bullish zone.
4-Hours RSI (Relative Strength Index) – The RSI for XRP/USD is now above the 50 level.
Major Support Levels – .600, .5720, and .5250.
Major Resistance Levels – .640, .6580, and .700.
House of Streams Presents First-Ever Live Interactive Reality Show With Bitcoin Prize, Global Streamers, and Live Fan Engagement Set to Redefine Reality TV
 PRESS RELEASE. MALTA – March 28th, 2024 – At the forefront of entertainment innovation, Stream House Media Productions™, at https://www.shrimp.co/, announces the release date for its reality docuseries, slated to premiere in the spring of 2024. This production marks a one-of-a-kind venture, bringing together eight globally recognized streaming content creators for an unprecedented month of […]
Bitcoin News
Crypto Analyst Uses Historical Data To Show When The Bitcoin Price Will Reach $207,000
A crypto analyst has laid out a scenario where the Bitcoin price could rise above 0,000 by June. This is based on a historical occurrence that could play out again following BTC’s recent run above its previous all-time high (ATH).
How BTC Could Rise To 7,000 By June
The anonymous analyst behind the prominent crypto X (formerly Twitter) account, Bitcoin Archive, alluded to the 2021 bull run when Bitcoin’s price more than tripled in just 103 days after breaking the previous cycle’s ATH. That means Bitcoin could run to 7,000 by June if history repeats itself.
Bearing the Bitcoin Halving event in mind, Bitcoin’s price tripling by June looks feasible. Bitcoin’s price has more than tripled 90 days after previous Halving events. Considering that Bitcoin surpassed its previous ATH even before this Halving, which is set to take place in April, the flagship crypto could also achieve this exponential price surge in record time this time around.
This narrative is supported by the fact that Bitcoin’s demand continues to exceed its supply, and the supply will be further reduced when miners’ rewards are cut in half. Therefore, although ambitious, a price surge of such magnitude cannot be ruled out.
Moreover, crypto analyst MacronautBTC already calculated how Bitcoin’s price could rise to 7,000 based on the imbalance between supply and demand. BTC rising to 7,000 by June will no doubt defy expectations, with analysts like Skybridge Capital CEO Anthony Scaramucci not expecting such a price surge until next year.
Scaramuci had predicted that Bitcoin would rise to 0,000 18 months after the Halving event. Meanwhile, Tom Dunleavy, Partner and Chief Investment Officer (CIO) at MV Capital, took a conservative stance when he mentioned that Bitcoin could rise to as high as 0,000 this year.
What Next For Bitcoin?
Bitcoin has cooled off following its rise to a new ATH of ,000. As to the next move the flagship crypto could make, crypto analyst Satoshi Flipper suggested in an X post that Bitcoin could consolidate between ,000 and ,00 for a few weeks before breaking its ATH again.
This aligns with Alex Thorn’s (Head of Research at Galaxy Digital) analysis, where he noted that BTC could follow a similar path to December 2020. Back then, BTC touched its prior ATH of ,000, then traded 11.3% lower for the next 15 days before going on to “definitively” break its ATH.
At the time of writing, Bitcoin is trading at around ,000, up in the last 24 hours, according to data from CoinMarketCap.