 Amid Friday’s downturn, following bitcoin’s decline to ,450, the latest Commitments of Traders (COT) report from the Commodity Futures Trading Commission (CFTC) indicates that hedge funds are placing substantial bets against bitcoin. Bitcoin Faces Bearish Sentiment From Hedge Funds While crypto enthusiasts and analysts have been optimistic about bitcoin (BTC) for quite some time, particularly […]
Bitcoin News
What Triggered The 6,350% Spike In XRP Long Liquidations Compared To Shorts?
The bulls have continued to take a beating in the market, and XRP bulls, in particular, were recently in the spotlight as .27 million was liquidated from their long positions. This 6,350% spike in long liquidations is likely due to XRP’s recent price action, highlighting the general sentiment in its ecosystem.
.27 Million In Longs Get Liquidated
Data from Coinglass shows that .27 million in long positions have been liquidated in the last 24 hours. This is massive in comparison to the ,220 liquidated in short positions during this period. This occurrence was likely due to the 3.85% drop in XRP’s price, as the crypto token dropped to as low as .51 in the last 24 hours.
XRP’s price decline during this period is believed to have been caused by the sharp correction in Bitcoin’s price, with the flagship crypto dropping below ,000 again. However, there also seems to be a bearish sentiment in the XRP ecosystem, as data in the XRP derivatives market shows that trading volume has dropped by over 26%.
Meanwhile, options trading volume has also dropped by over 46%. These figures suggest that XRP investors are choosing to remain on the sidelines, seeing as the bears look to have the upper hand at the moment. However, the bright spot is that there has been an uptick in open interest, which means some bulls are still willing to bet on the crypto token.
These bulls might have a good reason to gamble on the crypto token, seeing as crypto analysts are predicting significant moves for XRP. Specifically, crypto analyst Jonathan Carter recently predicted that XRP could rise to .93 and further to .68. There is also the feeling that a rally is long overdue for XRP and could be anytime soon.
When The XRP Rally Could Come
An XRP rally could be on the horizon with the legal battle between the Securities and Exchange Commission (SEC) and Ripple almost coming to an end, with a ruling expected soon enough. Crypto analyst JackTheRippler predicted that the crypto token could rise to as high as 0 once this case ends.
While this price level is undoubtedly ambitious, XRP could still make a significant move to the upside, considering that it also enjoyed an upward trend on the back of Judge Analisa Torres’ ruling that the crypto token wasn’t a security.
At the time of writing, XRP is trading at around .51, down in the last 24 hours, according to data from CoinMarketCap.
History Favors Bitcoin Bulls Despite Crypto Hedge Funds Increasing Shorts
Bitcoin may be dripping lower at spot rates. Still, one analyst is unfazed, expecting the coin to reverse recent losses and snap up firmly before peaking in December 2024. At spot rates, BTC is down roughly 11% from 2024 peaks and struggling to generate sufficient buying pressure, looking at the formation in the daily chart.
Will History Support Bitcoin And Rally To Fresh Highs?
Taking to X, the analyst highlights historical price patterns using the 2-week Fisher Transform indicator, a tool for picking out potential reversal zones like double tops or bottoms. Though the technical indicator lags, it has accurately picked out peaks in the past.
In 2021, when Bitcoin soared to over ,000, the Fisher Transfer indicator printed a signal, highlighting potential peaks. In the coming weeks following this signal, prices crashed.
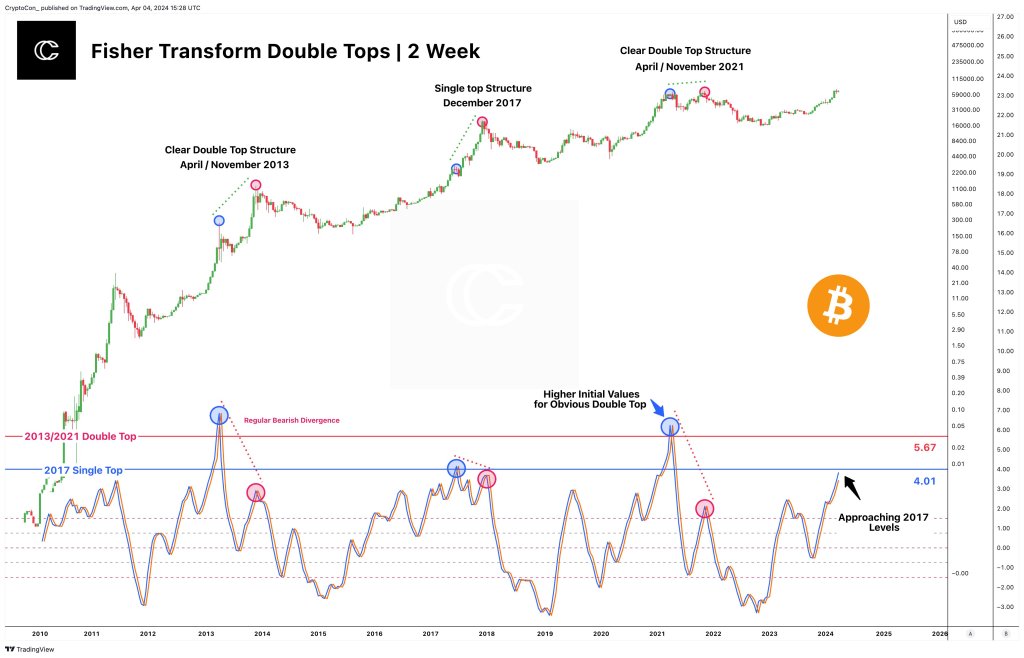
By the end of 2022, Bitcoin had fallen to as low as ,000, accelerated by the collapse of FTX and the bankruptcy of several other popular crypto hedge funds, including Three Arrow Capital (3AC).
The analyst also emphasizes the importance of the indicator in differentiating between a double top, mirroring 2017 and 2021, and a potential single peak later this year.
Presently, the trader said prices are approaching 2017 levels. Then, prices created what the analyst described as a “more subtle initial rise” before peaking six months later at over ,000.
If this leads, and the indicator “pauses” where it is, Bitcoin will likely record a “single top.” However, only time will tell where this top will be at.
Hedge Funds Were Selling At Tops?
This prediction comes amid significant bearish bets by leveraged hedge funds. Data from the United States Commodities Futures Trading Commission (CFTC) reveals that these funds held record “short” positions in Bitcoin futures contracts by last week.
Observers note this was the largest short position since 2017, at over 16,000 contracts. By shorting, they expected prices to dump, which is precisely what’s happening at spot rates.
However, even as hedge funds short, another analyst, responding to the trend, said the futures premium remained high. This is a development that some of these crypto hedge funds are taking advantage of.
The number of shorts could increase in the days ahead as United States Federal Reserve officials appeared to be hawkish and upbeat economic data started pouring in. Being a data-driven central bank, the Federal Reserve might not slash rates as fast as initially projected.
Bitcoin Rallies Post-Fed Rate Announcement, Shorts Worth $151.69M Liquidated
 The valuation of bitcoin (BTC) tapped the ,000 mark merely 17 hours following its dip to ,760 per unit. Following the latest Federal Open Market Committee (FOMC) session, the entire crypto market has seen a 5.9% upturn, with bitcoin rising 6.8% versus the U.S. dollar. Crypto Market Liquidations Reach 4 Million as Long and Short […]
Bitcoin News
Record $1 Billion In Shorts Risk Liquidation If Bitcoin Hits This Price
The Bitcoin price is creeping up once again, rising to a new all-time high above ,000 in the early hours of Monday. As the price surge continues, it has put a record number of shorts at risk, where a less than 10% move upward from here will see billion in shorts liquidated.
Billion In Shorts At Risk Of Liquidation
Crypto trader and analyst Ash Crypto took to X (formerly Twitter) to share a map that showed the number of short positions at risk as the price of Bitcoin rises. The map shared in the post showed that short liquidation leverage had risen above billion.
These short leverage positions had been rising along with the price with a large number of crypto investors expecting the price to crash after pumping to a new all-time high. However, Bitcoin seems to have other plans in mind with its price surging close to ,000 and increasing the risk of liquidations for these positions.
For these positions, Bitcoin reaching ,000 would be detrimental to them. At this price level, over billion worth of short positions will be liquidated. “,000,000,000 WORTH OF SHORTS WILL GET LIQUIDATED IF BTC HITS ,000,” Ash Crypto revealed.
Will Bitcoin Stop Anytime Soon?
The Bitcoin price has seen a 10.33% increase in the last week and shows no signs of stopping soon. However, the debate of whether it continues upward or downward continues to wax strong as crypto analysts far and wide proffer their own predictions.
One crypto analyst know as MarcPMarkets suggests that the price of Bitcoin could hit resistance and then spiral back down if Bitcoin fails to properly clear the ,000. But the analyst also explains that there is a possibility that the positive price action does continue if price does push above ,500 and makes a close above it.
At the time of writing, Bitcoin is trading above ,700, which shows it has cleared the level highlighted in the analyst. Now, what remains is to see if the cryptocurrency is able to make a daily close above ,500, something that would be incredibly bullish for price. In this case, the BTC price could rise as high as ,000 following this breakout.
The Bitcoin move over ,000 has already had a significant impact on traders in the last day. Over 3 million has been lost by traders in one day. But interestingly, the majority of liquidations (64.29%) happen to be long positions, according to data from Coinglass.
Bitcoin Reaches $57K in Stellar Monday Surge, Erasing $70 Million in Shorts in Just One Hour
 Bitcoin reached a peak of ,055 on Monday, climbing 10.1% over a 24-hour span and elevating the digital asset’s market value to .10 trillion. The value of bitcoin relative to the U.S. dollar hasn’t ascended to these levels since Nov. 22, 2021, marking 12 days after the digital currency’s peak value of ,000. Monday’s Bitcoin […]
Bitcoin News
Veteran Trader Peter Brandt Shorts Ethereum, Signaling Potential Downturn

On Monday, veteran trader Peter Brandt took to the social media channel X (previously known as Twitter) to reveal that he had taken a short position on ethereum (ETH), the crypto market’s second-largest asset by valuation. He further shared a technical chart with his 707,000 followers on X to illustrate his strategy.
Brandt Takes Short Position on Ethereum, Suggesting Price Plunge
Since the beginning of 2023, ethereum’s value has surged by 85% in comparison to the U.S. dollar. This increase in ether’s price can be attributed to several key factors. The crypto community has been buzzing with talks of a potential spot ethereum exchange-traded fund (ETF) getting the nod from the U.S. Securities and Exchange Commission (SEC), fueling a bullish outlook in the market. Additionally, onchain analytics show a noteworthy uptick in ETH accumulation by major holders, or ‘whales’, signaling a positive shift in market dynamics.
In the past fortnight, however, ETH’s upward trajectory has plateaued, experiencing a minor 1.4% dip in its value against the greenback. On Dec. 18, 2023, veteran trader Peter Brandt, active in the markets since 1975, showcased an ETH/USD chart from Tradingview. Brandt stated, “Classical chart patterns in price charts are not sacred – they fail to perform according to the textbooks all the time,” Brandt wrote. “But, if the rising wedge in [ethereum] complies with the script, the target is ,000, then 0.”
Brandt added:
I shorted ETH on Friday — I have a protective [break-even stop].
Shorting in financial markets essentially involves a wager against the asset, in this instance ETH, and anticipating a decline in its value, which, if it occurs, results in profit from the short position. Echoing Brandt’s sentiment, Adamant Capital founder Tuur Demeester pointed to a chart illustrating ETH’s performance against BTC over five years. Colin Talks Crypto concurred, stating, “Supporting this is the fact that ETH/BTC looks horrible and soon to break down too. My guess is BTC ETFs are the straw that breaks this camel’s back.”
The ethereum (ETH) chart does display indications of a potential reversal, though the pattern in Brandt’s chart isn’t completely formed yet. Presently, there’s an observed bearish pattern marked by consistently flat lower highs and a succession of lower lows, suggesting that sellers are currently more assertive than buyers. Nonetheless, it’s common for crypto assets to experience periods of low trading volume during holidays, a situation bears might capitalize on. Consequently, it’s quite plausible that ether’s descending triangle formation might be a temporary phenomenon.
Brandt has been vocal about his views on crypto assets and economic matters for an extended period. In August, when discussing the impending Bitcoin halving, Brandt labeled the reward reduction as a “non-event.” Previously, in June, the experienced trader advocated for the U.S. Federal Reserve to increase the benchmark interest rate by 100 basis points. He also holds the opinion that bitcoin (BTC) is a legacy coin, while dismissing most other cryptocurrencies as mere “make-believe crypto wannabees.”
What do you think about Peter Brandt shorting ether? Do you agree with what he has said? Share your thoughts and opinions about this subject in the comments section below.
Solana’s Rally Hits 184% Gain in 30 Days as $19M in SOL Shorts Liquidate in 24 Hours
This weekend, the crypto community’s buzz centered on solana (SOL) and its notable surge in value against the U.S. dollar over the previous week. SOL has posted an 11% gain in the last 24 hours, with a striking 45.2% uptick over the week, ascending to the rank of the sixth largest asset by market cap.
Solana Leapfrogs in Crypto Race With 45% Weekly Rise
Among the leading ten crypto assets by market value, solana (SOL) has outperformed its peers this week. Currently, SOL boasts a 45.2% increase over the last week and has vaulted by 184% against the U.S. dollar in the last 30 days. On Saturday, November 11, trading prices for SOL ranged from .59 to .44 per coin. With around .41 billion in global trade volume over the past day, SOL ranks as the fifth most traded cryptocurrency in terms of trading activity.

The recent uptick in solana’s value has resulted in a significant number of short positions wagering on the digital currency’s decline being liquidated. Data from Coinglass reveals that solana tops today’s chart with short position liquidations amounting to .28 million. Concurrently, conversations about SOL’s rise are peppered across social media networks, including X.
“I missed SOL because less than 30 minutes after my bottom call when I went to buy it had pumped to in one straight candle and now it’s at ,” wrote Eric Wall. Meanwhile, others gloated over their SOL gains. “Mfers watching me make life changing gains with solana right now,” one individual remarked. Another added:
GM to all the people who understand why SOL is headed [higher] than it’s ever been! Now is the time to CHAD a bit more.
Data from Cryptocompare indicates that on Saturday, SOL’s primary trading pair is tether (USDT), capturing 52% of the activity, with trades against the U.S. dollar ranking second at 17.83%. The Korean won is responsible for a significant 16.27% slice of all SOL trades, while BTC claims 5.83% of the market share.
Following BTC, SOL’s trading volumes are bolstered by pairs with BUSD, EUR, TRY, USDC, and ETH. Despite solana’s impressive performance this past month, with triple-digit increases, SOL’s current value is still over 75% lower than its peak of 9 per unit, reached two years back on November 6, 2021.
What are your views on solana’s recent growth, both in the past day and over the previous month? Share your insights and perspectives on this topic in the comment section below.
Bitcoin Bloodbath: Fake Spot ETF Approval Sparks BTC Surge, Obliterates $78M Shorts At $30,000
In a flurry of market activity, false news surrounding the approval of a Bitcoin (BTC) Spot Exchange-Traded Fund (ETF) by the US Securities and Exchange Commission (SEC) sent shockwaves through the cryptocurrency community.
False Rumors of BTC Spot ETF Approval Trigger Volatility
Initially reported by Cointelegraph, the news claimed that BlackRock’s iShares Bitcoin Spot ETF had received regulatory approval.
However, Bloomberg analyst James Seyffart promptly cast doubt on the report’s authenticity, stating that he could not find any confirmation of the news at the time. Seyffart stated:
I believe this to be fake news. While this would be positive for the things we’ve been saying. I can’t find anything that would confirm this at the moment.
Subsequently, BlackRock confirmed to FOX reporter Eleanor Terret that the application was still under review, rendering the initial report false.
The repercussions of this misinformation were immediately evident in the market. BTC experienced a brief surge from ,800 to ,000 within minutes as traders reacted to the purported ETF approval news. However, as the truth emerged, the market corrected itself, causing a wave of liquidations.
According to data from Glassnode, the aftermath of the surge saw a significant increase in liquidations. Within four hours, 3.75 million in long positions and .87 million in short positions were liquidated, reflecting the volatility and sudden reversal prompted by the false news.
The incident also prompted Cointelegraph to apologize for a post that had disseminated inaccurate information regarding the BlackRock Bitcoin ETF.
The media outlet announced that an internal investigation is underway to determine the source of the misinformation. Cointelegraph stated:
We apologize for a tweet that led to the dissemination of inaccurate information regarding the Blackrock Bitcoin ETF. An internal investigation is currently underway. We are committed to transparency and will share the findings of the investigation with the public once it is concluded within 3 hours.
False Breakout Fails To Dampen Bitcoin Profitable Streak
Despite the false breakout above ,000, Bitcoin has retained significant profits within 24 hours. Currently trading at ,100, it remains ,000 higher than the initial price before disseminating the fake news across all platforms. This marks a 5.1% profit during this period.
Consequently, this positive turn of events has caused Bitcoin to shift from negative to positive figures across various time frames. In the past 7 days, Bitcoin has recorded a 2.6% profit, while over 30 days, it has seen a 6.4% increase. Only in the 14 days was a slight decrease of 0.4%.
Furthermore, a closer examination of BTC’s 1-day chart reveals its ability to surpass significant resistance levels. Notably, Bitcoin successfully overcame two critical moving averages: the 50-day MA at ,150 and the 200-day MA at ,030.
These moving averages posed major obstacles for Bitcoin’s price after initially dropping below this threshold.
In addition, Bitcoin managed to break through the ,000 resistance level, which had previously acted as a significant barrier following the false breakout above this mark.
Moving forward, the sustainability of Bitcoin’s current price level and bullish momentum remains to be seen amidst the circulating rumors surrounding the long-awaited ETF decision by the applicants and the US SEC.
Featured image from Shutterstock, chart from TradingView.com
Crypto Shorts See Carnage As Bitcoin Surges Towards $28,000
Data shows the crypto futures market has observed large liquidations in the past day as Bitcoin has recorded a sharp surge towards ,000.
Crypto Futures Observed Million In Liquidations In Last 24 Hours
A crypto futures contract is said to be “liquidated” when the derivative exchange with which said contract is open forcefully closes it up. This happens when the contract has accumulated losses of a certain percentage, the exact value of which may differ between platforms.
In this sector, it’s not too rare to see a flood of such liquidations occurring within a short span of time. The reason behind that is the high volatility that most of the assets display on average.
A lot of investors also like to play with extreme amounts of leverage, due to it being readily accessible in many platforms. Leverage alone can raise the risk of liquidation manyfold, so it combined with the high volatility can make it easy for contracts to be flushed down.
During the past day, the crypto market has once again seen some notable volatility, which has led to another mass liquidation event on the futures side, as the data below from CoinGlass shows.
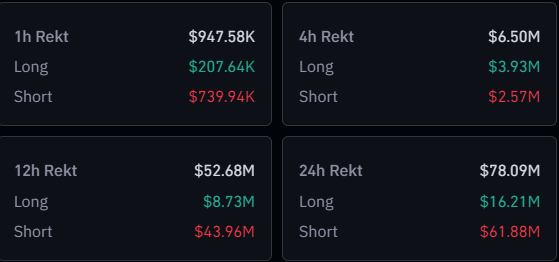
As is visible from the table, the crypto market as a whole has seen liquidations of more than million in the last 24 hours. Out of these, .88 million involved the short contracts, equivalent to almost 80% of the total.
This naturally makes sense, as this latest liquidation squeeze has been led by a rally in Bitcoin’s price.
As displayed above, Bitcoin has enjoyed a sharp surge in the past day. At the peak of this rally, the coin had retested the ,000 level but has since seen a bit of pullback.
The rest of the sector also followed the original crypto in this rally (as is usually the case), which is why shorts around the sector have taken a beating today. The below table shows what the individual contribution towards this liquidation squeeze has looked like for the different symbols in the sector.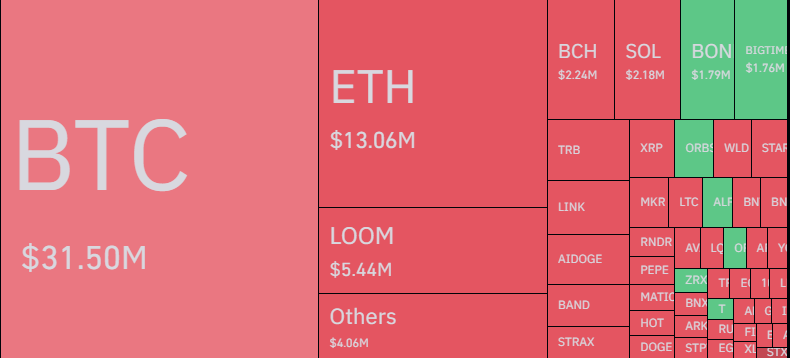
As expected, Bitcoin occupies the largest share of liquidations with .5 million, while Ethereum is second at .06 million. Interestingly, Loom Network (LOOM) is third in this list, despite the asset being just the 71st largest in the sector by market cap.
The altcoin has enjoyed a sharp rally of more than 113% in the past week, which is perhaps why the crypto has had such strong interest behind it on the futures market.
Bitcoin Open Interest Has Rebounded Since The Squeeze
As CryptoQuant analyst Maartunn has pointed out, the Bitcoin open interest, a measure of the total amount of contracts associated with the asset currently open on the futures market, has jumped back since the liquidation flush occurred.
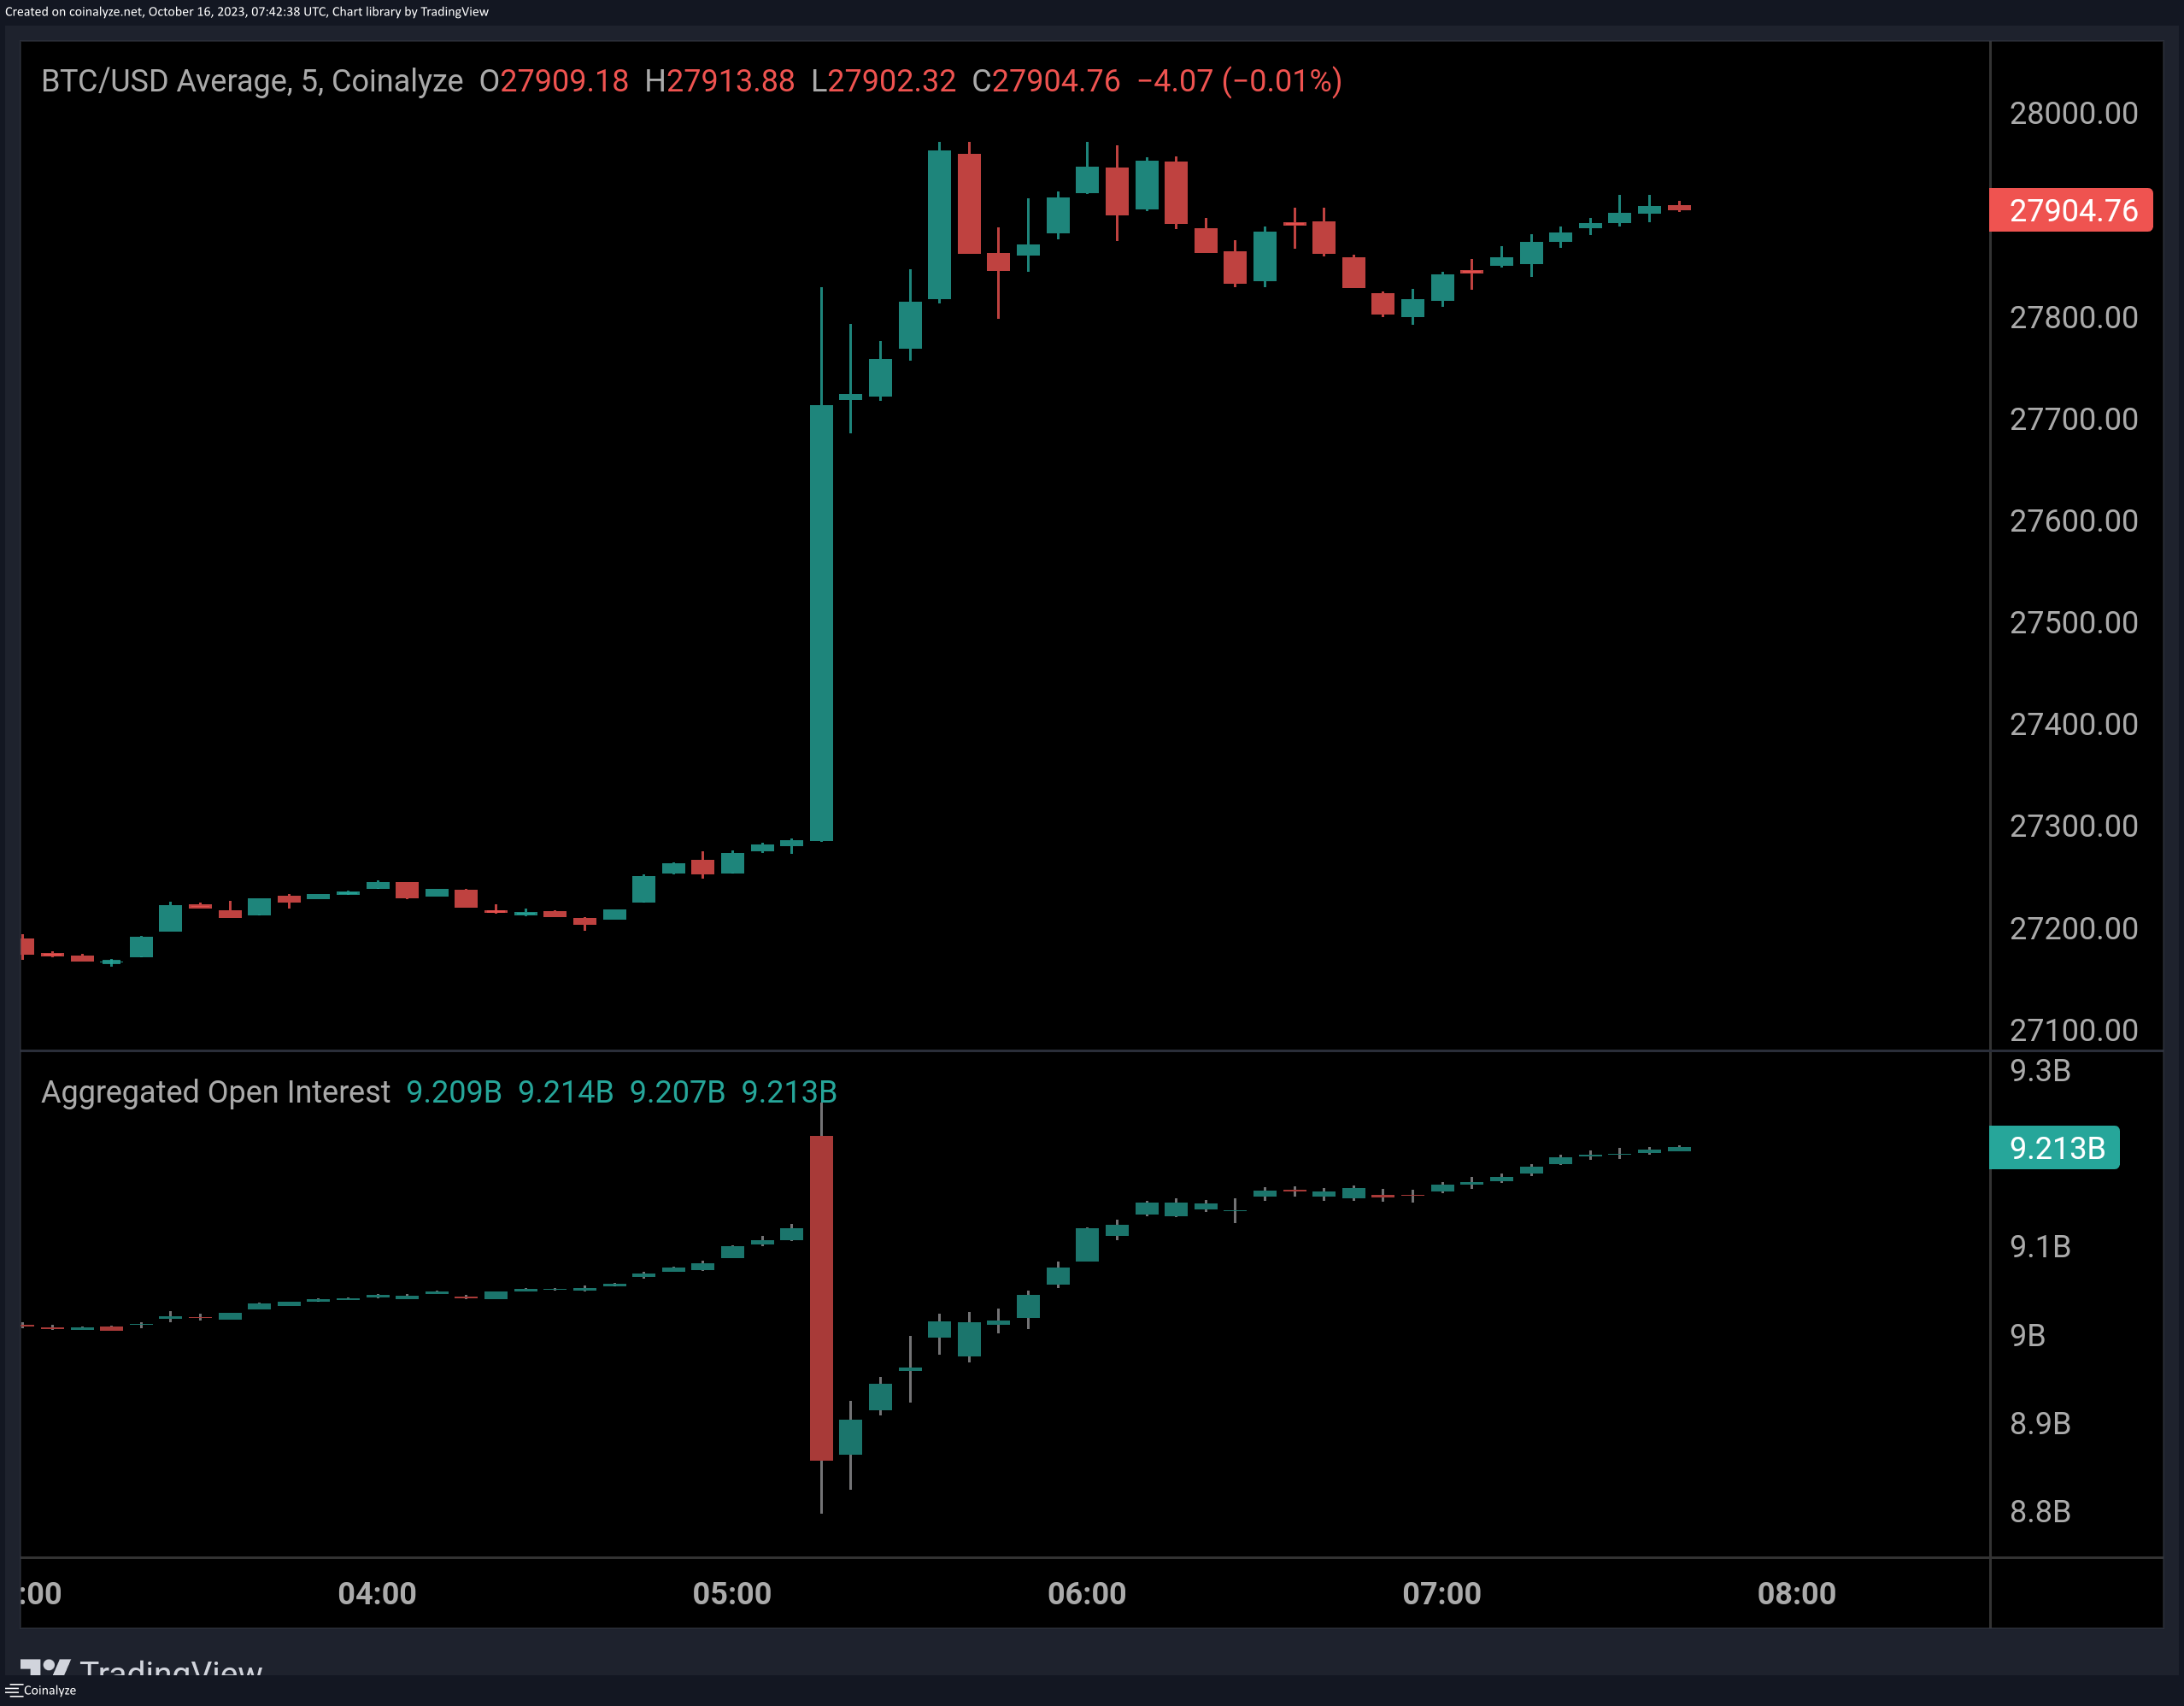
It would appear that more speculators have jumped on the market even after seeing a large amount of traders getting liquidated. Generally, the open interest being high can lead to volatility, so the indicator retracing back to its levels from before the plunge could mean BTC would soon see more sharp price action in the near future.