 The frenzy surrounding GME and AMC remains ongoing, with both stocks experiencing increases of 200% and 150%, respectively, over the past five days. In the midst of this excitement, CNBC’s Mad Money host Jim Cramer suggested that the companies would be foolish not to seize the opportunity to raise capital by issuing shares. Socialite Andrew […]
Bitcoin News
Samson Mow On Bitcoin Halving: Brace For Supply Shock, Omega Candle In Sight
Samson Mow, the chief executive at Jan3, recently spoke to Forbes about the latest Bitcoin halving and its potential to catalyze what he refers to as the “Omega candles” – significant price movements that could elevate Bitcoin to the million mark.
According to Mow, halvings ensure a controlled distribution of Bitcoin, maintaining scarcity and value.
The Mechanics Of Halving And Its Market Implications
Samson Mow detailed in the interview with Forbes the mechanics behind Bitcoin halvings—a critical process built into Bitcoin’s framework by its creator, Satoshi Nakamoto.
Omega Candle in sight! Omega Candle in sight! The #halving is proof that this system works, but it also means a supply shock is coming for any parties looking to buy large amounts of #Bitcoin. Check out @Excellion‘s comments on the recent halving in this @Forbes article by… pic.twitter.com/xp23ulxQIJ
— JAN3 (@JAN3com) April 22, 2024
This mechanism is designed to halve the block rewards given to miners every 210,000 blocks, or approximately every four years, reducing the reward by 50%.
So far, the most recent halving has reduced the reward for mining from 6.25 BTC to 3.125 BTC per mined block. However, initially, miners received 50 BTC per block.
Still, due to the halvings, this amount has decreased over time to manage inflation and extend the mining lifecycle of Bitcoin’s capped supply of 21 million coins. If not for these halvings, the total supply of Bitcoin would have already been mined.
In the same discussion, Mow highlighted the significant impact of newly approved spot-based Bitcoin ETFs, which received SEC approval earlier this year. He believes these ETFs, combined with the reduced block rewards from the halving, could precipitate a “supply shock” in the BTC market.
Mow further speculated on the occurrence of what he calls “Omega candles”—large price movement events in the Bitcoin market.
He noted that even before the recent halving, the daily demand for Bitcoin was significantly outstripping supply, predicting these Omega candles as almost certain events due to their high volatility and substantial price changes.
Mow views these developments as marking the beginning of a new era for Bitcoin, coinciding with its next, or fifth, halving in the coming four years.
Bitcoin Bright Future And Market Performance
Regarding positive sentiment on Bitcoin, Geoff Kendrick of Standard Chartered also supports this bullish outlook, projecting substantial inflows into BTC akin to those experienced by gold with the advent of gold ETFs.
Kendrick suggests that the maturation of the spot ETF market could channel between and 0 billion into BTC.
However, despite the post-halving price not reaching the anticipated heights, BTC has demonstrated resilience and potential for considerable growth. Meanwhile, analysts remain confident, predicting significant long-term value increases.
For instance, Michael Sullivan’s analysis suggests a possible reach of 5,000 by 2029 if BTC maintains a 30% compound annual growth rate, underlining the optimistic projections shared by several market experts.
This optimism is further supported by recent trends, including a 7.1% increase in Bitcoin’s price over the last week, which indicates a possible recovery on the horizon.
Featured image from Unsplash, Chart from TradingView
Bitcoin Fee Shock: Network Charges Double Amidst Excitement Of $70,000 BTC
Bitcoin transaction fees have experienced an unprecedented surge, doubling in just one week, as the market rallies towards the coveted ,000 mark. This surge cannot be solely attributed to the upward trajectory of Bitcoin’s price but is significantly influenced by the sudden rise in Ordinals transactions.
Ordinals: A Driving Force Behind Fee Escalation
Amidst the fervor of Bitcoin’s price rally, Ordinals transactions have emerged as a driving force behind the surge in transaction fees. Our in-depth analysis reveals that Ordinals, which started the week with approximately 48,000 daily inscriptions, witnessed an extraordinary surge, surpassing 93,000 by March 8th.
This surge in daily inscriptions has not only contributed to a substantial increase in fees, with the daily average fee standing at around eight BTC but has also added a staggering .8 million to the total network fees for the week.
Bitcoin Fees Break Records, Reflecting Market Dynamism
Bitcoin’s fee trend for the week has been nothing short of dynamic. While the initial daily fees stood at around 46 BTC, the momentum gained pace around March 5th, surging to an impressive 103 BTC. Towards the end of the week, the daily fee decreased slightly to around 40.7 BTC.
Despite the decline, the overall trend indicates a significant increase in daily fees compared to the preceding week, showcasing the dynamism and resilience of the Bitcoin market.
Bitcoin’s Ascent Towards K And Its Ripple Effect
As Bitcoin teeters on the edge of the ,000 price range, the cryptocurrency market is on the brink of a potential breakthrough. At the time of reporting, Bitcoin was trading at about ,950, marking a 10% increase in the last seven days.
A Closer Look At Bitcoin’s Fee Surge
Examining data provided by IntoTheBlock, it becomes evident that Bitcoin’s recent fee surge is not merely a consequence of its price rise. The notable increase in transaction fees, doubling compared to the previous week, is closely tied to the upward movement in the price of BTC.
Bitcoin fees more than doubled this week, with Ordinals-related transactions hitting a monthly high. pic.twitter.com/YXh9oMMYSK
— IntoTheBlock (@intotheblock) March 9, 2024
This movement has propelled transaction volumes to their highest levels in months, with NewsBTC’s analysis revealing a staggering volume surpassing 0 billion on March 5th and 6th, a level not witnessed since November 2022.
Ordinals’ Remarkable Contribution To Bitcoin Fees
NewsBTC’s detailed evaluation of Ordinals transactions over the past week sheds light on the remarkable contribution of this sector to Bitcoin’s escalating fees. With daily inscriptions skyrocketing and daily fees averaging around eight BTC, Ordinals has made a significant impact on the cryptocurrency landscape, contributing over 0 million in fees to date.
Featured image from Karolina Grabowska/Pexels, chart from TradingView
Bitcoin’s Warm-up Phase: Analyst Predicts a Market Evolution That Could ‘Shock’ Traditional Finance
 As bitcoin remains close to its peak price levels, a wave of positive sentiment and enthusiastic vigor is enveloping the crypto sphere. This week, onchain analyst Willy Woo, the same market strategist who asserted in November 2023 that bitcoin will probably not fall under ,000 again, is of the opinion that the latest surge is […]
Bitcoin News
3 Signs That A Bitcoin Supply Shock Could Be Just Days Away
The Bitcoin community is currently abuzz with discussions of an impending supply shock, a market phenomenon where demand outstrips supply, potentially leading to a substantial price increase. Indicators from various sectors within the market are currently converging, suggesting that such an event may be closer than many anticipate. Here’s an in-depth look at three signs for an impending supply shock:
#1 Surging Demand For Bitcoin ETFs
Bitcoin ETFs have been creating an exceptionally large demand since their launch. Initially, this demand surge was somewhat moderated due to significant outflows from the Grayscale Bitcoin ETF (GBTC). However, day 13 of the Bitcoin ETFs showed once again that the Grayscale outflows are slowly slowing down (yesterday: 0.7 million, previously 1.7 million), while the last two trading days saw net inflows for all ETF issuers of around 0 million.
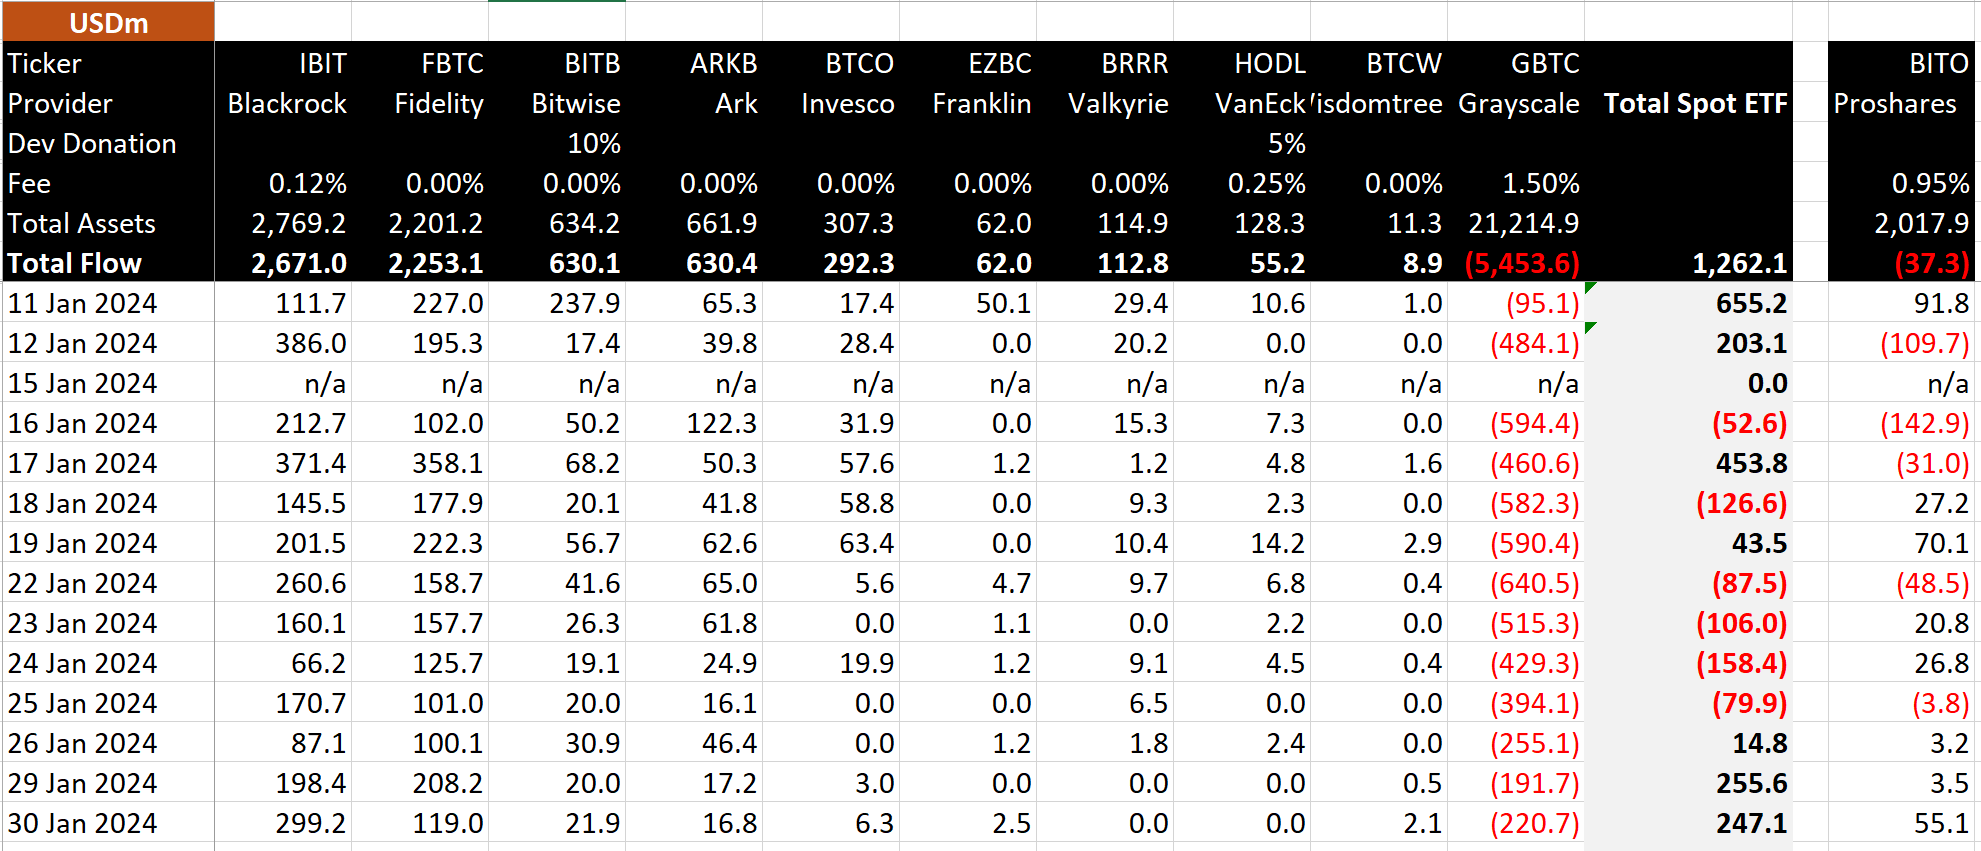
Dan Ripoll, managing director at Swan, provided a detailed analysis on the sheer magnitude of this. “The Bitcoin spot ETFs have already snatched up 150,500 BTC in just 13 trading days. They are buying at a rate of 12,000 BTC per day. Now, let’s KISS (keep it simple stupid). There are only 900 BTC per day being issued. BTC is being bought up at a rate of 13x daily issuance. In 3 months, the issuance will be cut in half, driving the demand/supply imbalance to a staggering 26x daily issuance!”
Furthermore, Alessandro Ottaviani, a respected Bitcoin analyst, underscored the potential market shift, stating, “Now that the Bitcoin ETF inflow will always be higher than the Grayscale outflow, the only way to accommodate that demand will be through an increase of price. Once we reach k and even more after the new ATH, Institutional FOMO will be officially triggered, and it will be something that the human being has never experienced.”
WhalePanda, a renowned crypto analyst, highlighted recent activities, adding credibility to the brewing supply shock: “Yesterday another ~0 million net inflow into Bitcoin ETFs with Blackrock doing a solid 0 million all by itself. Two days of 0 million inflow, the price didn’t rally much yesterday, but a couple of days like this, and you’ll see what kind of supply shock this will have on BTC.”
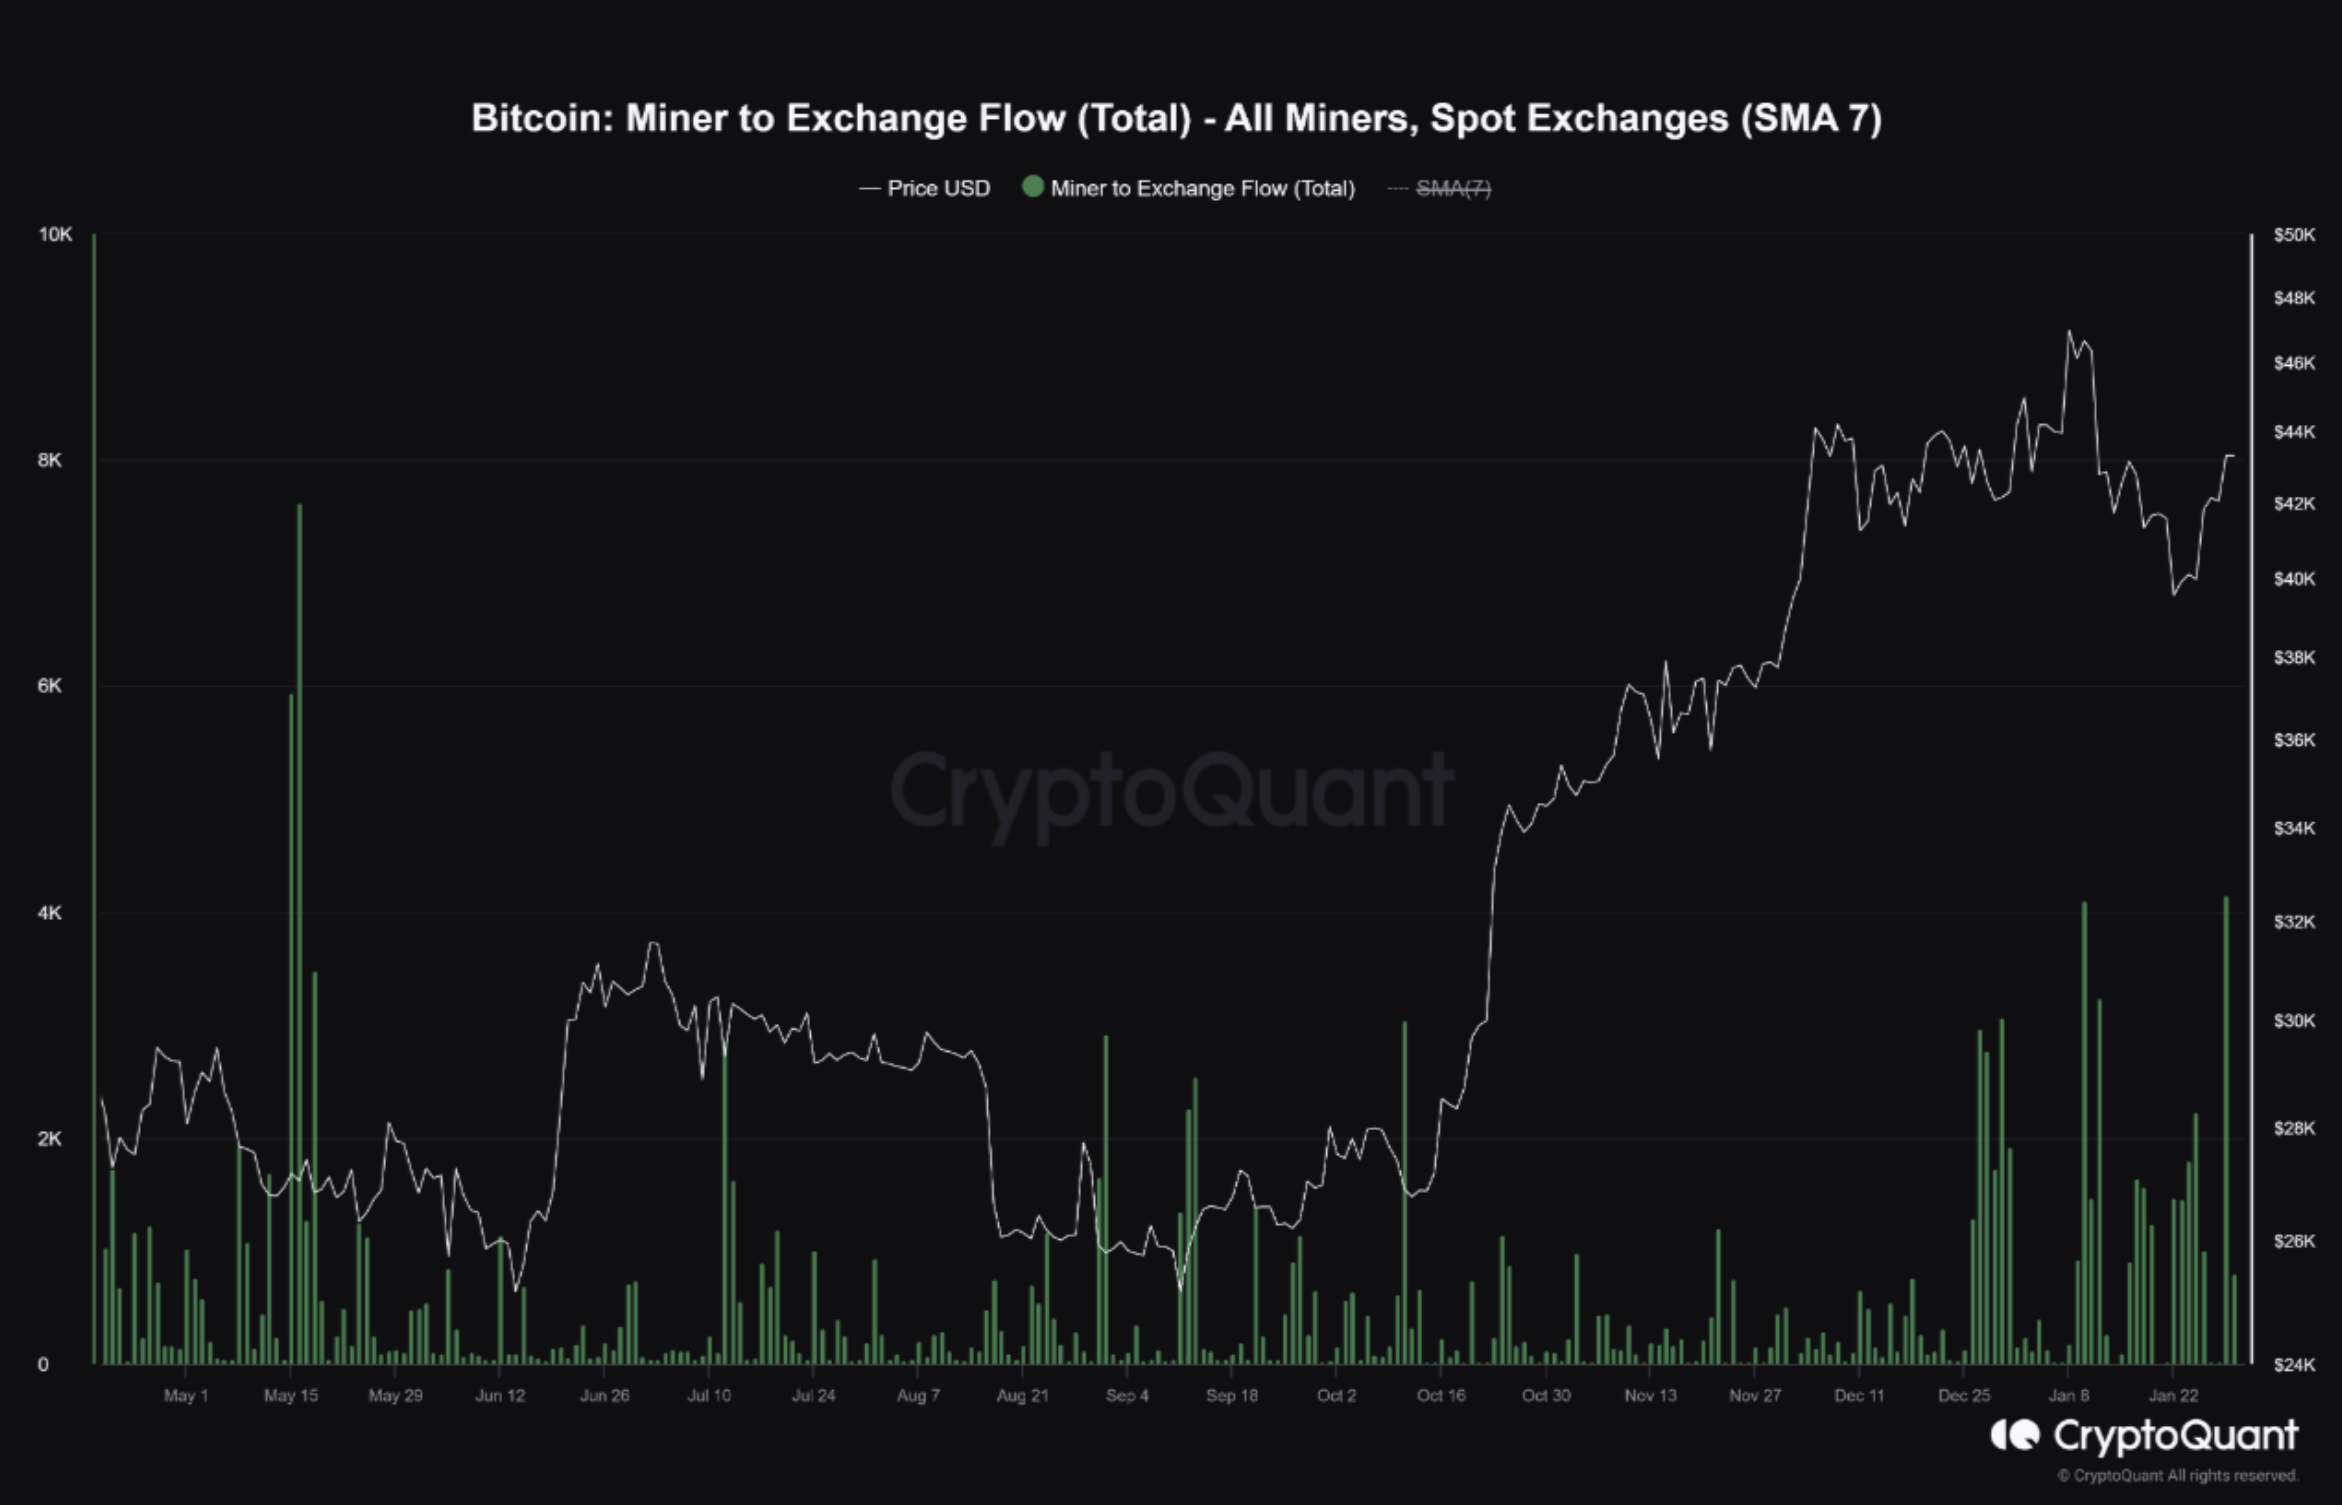
#2 Massive Bitcoin Miner Selling Absorbed
Despite a substantial flow of coins from miner wallets to spot exchanges, the market has shown remarkable resilience. According to a report from Cryptoquant:
“Yesterday, the flow of coins in miner wallets going to spot exchanges recorded the highest value since May 16, 2023. In total, more than 4,000 Bitcoins flowed to spot exchanges, around 3 million in selling pressure. However, this selling pressure was calmly absorbed by the market.”
It’s critical to note that despite these interactions, the reserves in mining portfolios have remained consistent since the beginning of January, indicating that the market has effectively absorbed the selling pressure without significant price depreciation.
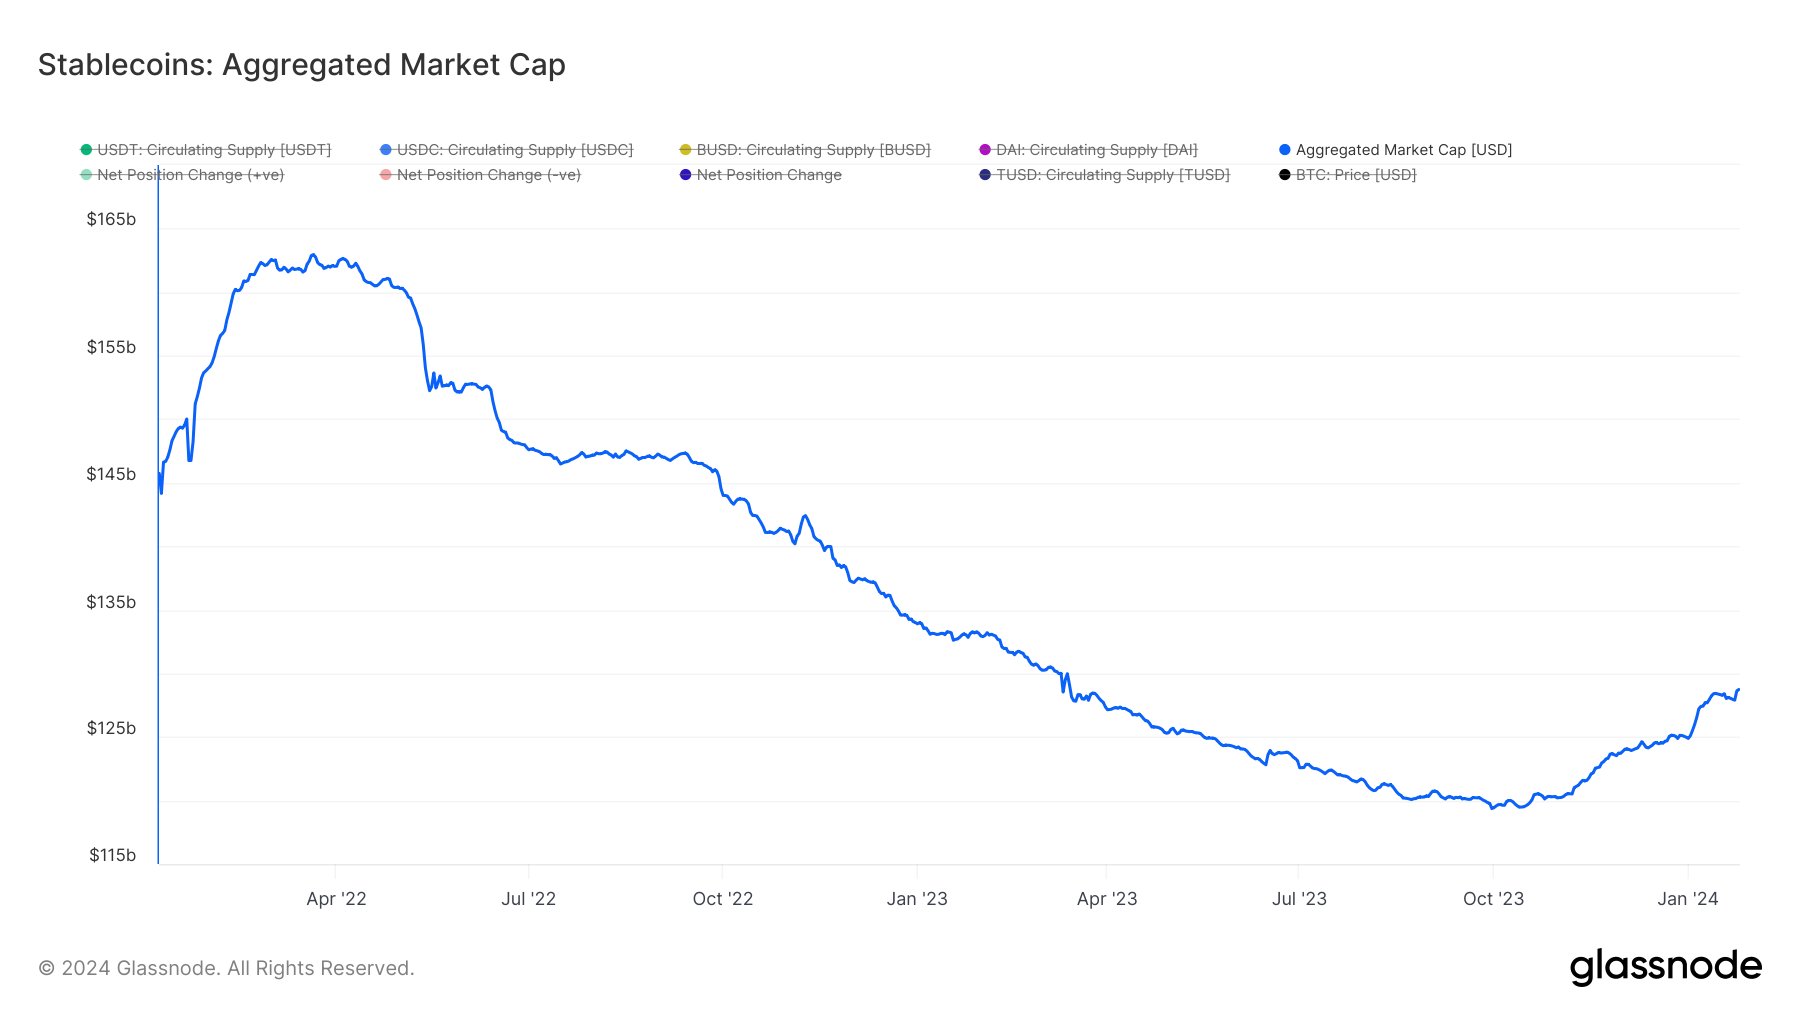
#3 Stablecoins Aka “Dry Powder” On The Rise
The stablecoin aggregated market cap serves as a precursor to potential market movements. Recently, the stablecoin aggregated market cap has shown a significant rebound, moving from a bottom of 9.5 billion in mid-October 2023 to nearing 0 billion.
This rise in stablecoin reserves is often interpreted as “dry powder,” ready to be deployed into assets like Bitcoin, potentially further accelerating the supply/demand mechanics. Alex Svanevik, founder of on-chain analysis platform Nansen, remarked on the correlation between stablecoin reserves and BTC price: “When stables on exchanges peaked, BTC price peaked.”
At press time, BTC traded at ,848.
3 Signs That A Bitcoin Supply Shock Could Be Just Days Away
The Bitcoin community is currently abuzz with discussions of an impending supply shock, a market phenomenon where demand outstrips supply, potentially leading to a substantial price increase. Indicators from various sectors within the market are currently converging, suggesting that such an event may be closer than many anticipate. Here’s an in-depth look at three signs for an impending supply shock:
#1 Surging Demand For Bitcoin ETFs
Bitcoin ETFs have been creating an exceptionally large demand since their launch. Initially, this demand surge was somewhat moderated due to significant outflows from the Grayscale Bitcoin ETF (GBTC). However, day 13 of the Bitcoin ETFs showed once again that the Grayscale outflows are slowly slowing down (yesterday: 0.7 million, previously 1.7 million), while the last two trading days saw net inflows for all ETF issuers of around 0 million.
Dan Ripoll, managing director at Swan, provided a detailed analysis on the sheer magnitude of this. “The Bitcoin spot ETFs have already snatched up 150,500 BTC in just 13 trading days. They are buying at a rate of 12,000 BTC per day. Now, let’s KISS (keep it simple stupid). There are only 900 BTC per day being issued. BTC is being bought up at a rate of 13x daily issuance. In 3 months, the issuance will be cut in half, driving the demand/supply imbalance to a staggering 26x daily issuance!”
Furthermore, Alessandro Ottaviani, a respected Bitcoin analyst, underscored the potential market shift, stating, “Now that the Bitcoin ETF inflow will always be higher than the Grayscale outflow, the only way to accommodate that demand will be through an increase of price. Once we reach k and even more after the new ATH, Institutional FOMO will be officially triggered, and it will be something that the human being has never experienced.”
WhalePanda, a renowned crypto analyst, highlighted recent activities, adding credibility to the brewing supply shock: “Yesterday another ~0 million net inflow into Bitcoin ETFs with Blackrock doing a solid 0 million all by itself. Two days of 0 million inflow, the price didn’t rally much yesterday, but a couple of days like this, and you’ll see what kind of supply shock this will have on BTC.”
#2 Massive Bitcoin Miner Selling Absorbed
Despite a substantial flow of coins from miner wallets to spot exchanges, the market has shown remarkable resilience. According to a report from Cryptoquant:
“Yesterday, the flow of coins in miner wallets going to spot exchanges recorded the highest value since May 16, 2023. In total, more than 4,000 Bitcoins flowed to spot exchanges, around 3 million in selling pressure. However, this selling pressure was calmly absorbed by the market.”
It’s critical to note that despite these interactions, the reserves in mining portfolios have remained consistent since the beginning of January, indicating that the market has effectively absorbed the selling pressure without significant price depreciation.
#3 Stablecoins Aka “Dry Powder” On The Rise
The stablecoin aggregated market cap serves as a precursor to potential market movements. Recently, the stablecoin aggregated market cap has shown a significant rebound, moving from a bottom of 9.5 billion in mid-October 2023 to nearing 0 billion.
This rise in stablecoin reserves is often interpreted as “dry powder,” ready to be deployed into assets like Bitcoin, potentially further accelerating the supply/demand mechanics. Alex Svanevik, founder of on-chain analysis platform Nansen, remarked on the correlation between stablecoin reserves and BTC price: “When stables on exchanges peaked, BTC price peaked.”
At press time, BTC traded at ,848.
Tellor (TRB) Leaves Market In Shock With 75% Price Crash, Here’s What Happened
Tellor (TRB) went on a rollercoaster in the past 24 hours, with its price experiencing a surge and a drop that is comparable to that of price manipulation. As a result, the crypto surged to over 0 in the late hours of 2023 before crashing down to 7.
According to data from CoinGlass, TRB witnessed more liquidated positions than any other crypto within this time period, with whales exiting both long and short positions amidst rumors of manipulation.
Wow $TRB pic.twitter.com/TgYqWNtC0u
— Tony “The Bull” (@tonythebullBTC) December 31, 2023
TRB Price Action And Liquidation
TRB has been on a steady price increase since the beginning of the month. This increase was particularly exacerbated on December 31, pushing the crypto to a new all-time high of 2, and a 1000% increase in trading volume, according to Coinmarketcap data. However, this price surge failed to last more than a few hours, as TRB plummeted to 9.
This price volatility saw TRB lead the market in liquidations on both long and short positions. According to CoinGlass, the crypto market saw a total of 7 million liquidated positions in the past 24 hours, with TRB leading with .93 million, quite unusual for such a low market cap altcoin. ETH and BTC followed with .7 million and .74 million worth of liquidated positions.
While the reason for the astounding price spike is unclear at the moment, the subsequent crash has been attributed to price manipulation from the Tellor team. According to a post on X (formerly Twitter) by Lookonchain, the Tellor team deposited 4,211 TRB worth approximately .4 million on Coinbase as the price skyrocketed.
In the past 24 hours, $TRB soared to 0 and then plummeted to 7, causing M of assets to be liquidated, making it the most liquidated token.
We noticed that the #Tellor team deposited 4,211 $TRB(.4M) after the price of $TRB skyrocketed.
Address:https://t.co/efHPXCiMiG pic.twitter.com/IBty2Wf2gI
— Lookonchain (@lookonchain) January 1, 2024
Price manipulation is certainly not a new phenomenon in the crypto industry, especially among low market-cap altcoins. The transfer into Coinbase has got investors wondering about a selloff from the team, as TRB crashed in the hours after. Nonetheless, this remains a speculation at this point.
TRB is the utility token for Tellor, a decentralized oracle network that provides real-world data to blockchain-based smart contracts. TRB mostly traded below for the majority of the year. Things started to get hot in September as the cryptocurrency started to exhibit a very high level of volatility at this point. TRB kickstarted a sustained price surge in the middle of September that saw it reach 0 on November 9. After reaching this point, it went through a price dip throughout the month to the end of November at around .
December saw a change in momentum, with price action indicating a steady surge since the beginning of the month. At the time of writing, TRB is trading at 1, still up by 143% in a 30-day timeframe.
Analyst Predicts XRP Price Will Rise 800% To $5.5 – The Timeframe Will Shock You
Popular crypto analyst EGRAG crypto has dropped what looks like the most bullish price prediction for XRP. XRP has been subjected to various price predictions in the past few months from EGRAG and other crypto analysts, as the crypto now has free rein on its price movement. This time, the analyst claims XRP is ready to explode 800% in just two weeks, rocketing from under .65 today to over .50 in just 14 days. EGRAG’s analysis pointed to price movement and the Fibonacci indicator, indicating XRP is gearing up for a huge rally.
Massive XRP Price Surge In A Short Time
EGRAG took to social media platform X to reveal his latest prediction about XRP. The prediction came as an update to the analyst’s earlier prediction in May, where he shared that XRP’s price was at the final wake up line. The Final Wake Up Line was drawn from XRP’s all time high of .40 in 2018, sloping downwards as the crypto continued to form lower highs. At that time, XRP was trading at .4639 and EGRAG gave three price targets of .85 to , .5, and .1 in the coming months. The analyst also drew a bottom (Atlas) line on higher lows since 2021 to form a symmetrical triangle.
#XRP Mid-Term Target (0.85c – – .5 – .4):
The ‘Final Wake Up Line’ is gauging the next #XRP breakout. Once #XRP breaks it and retest it without breaking Fib 0.236 (0.45c) on the Weekly Time frame then I can say with high degree of certainty that Fib 1.618 (.5 – .4)… pic.twitter.com/xzPMi7b7FN
— EGRAG CRYPTO (@egragcrypto) May 22, 2023
Now five months after, XRP has had major events in its ecosystem, becoming the only crypto asset to receive regulatory clarity in the US. As a result, XRP went on a price growth that led to a spike over .93 against USDT on various crypto exchanges. According to EGRAG, his first target of the .85 to 1$ was completed amidst the price spike.
A look at the price chart shared by EGRAG reveals XRP seems to have formed a support around this final wake-up line. Now, the next target is around .5, a measured move of the symmetrical triangle formed between the final wake up and atlas line. EGRAG claims we could see XRP trade at this price point in just two weeks.
#XRP 3 Targets
:
Curious about the specifics? Check out the May 2022 post for all the details:https://t.co/CGLMB7CgGi
Target 1: 0.85 – 1$ (Completed)
Target 2: $ 5.5 (Might be achieved in two weeks)
Target 3: $ 6.4 (Fib 1.618 will be extended wick)#XRPArmy STAY STEAD and… pic.twitter.com/vTYMwxFbA1— EGRAG CRYPTO (@egragcrypto) December 14, 2023

How Feasible Is This Price Prediction?
XRP has since fallen below the analyst’s first target of .85. At the time of writing, XRP is trading at .62, down by 9.59% in a 7-day timeframe. EGRAG argued that the recent price correction could make investors jump ship, but HOLDing is still the best decision at this moment.
A surge to .5 would mean an 800% price gain from the current level before the end of the year. However, current fundamentals points to an increase of this magnitude in such a short timeframe being very unlikely .
EGRAG clarified in a comment that the prediction wasn’t based on the next two weeks. Instead the rally to .5 would be completed in just a two week timeframe.
Not within the next 2 weeks but in 2 weeks duration all this move will be completed.
— EGRAG CRYPTO (@egragcrypto) December 14, 2023

Featured image from Shutterstock
Bitcoin And XRP Set To Shine: Shock $8 Trillion Predicted Amid US Dollar ‘Collapse’
Despite initial expectations of a robust rally, major cryptocurrencies Bitcoin (BTC), Ethereum (ETH), and XRP have encountered a slowdown in momentum following a promising start in 2023. However, a prominent tech company’s leaked disclosure can alter this trajectory.
With the Federal Reserve (Fed) grappling with a staggering trillion US “debt death spiral,” investment banking firm Jefferies analysts have warned that the Fed may be compelled to restart its money printing presses.
This move could trigger the collapse of the US dollar and ignite a significant price boom for Bitcoin, rivaling the value of gold.
Expert Advocates For Bitcoin As An Inflationary Safeguard
A recent Forbes report indicates that Bitcoin’s highly anticipated halving event, expected to cause price volatility, is imminent.
Christopher Wood, Jefferies’ global head of equity strategy, emphasized in a note to clients seen by CNBC that G7 central banks, including the Federal Reserve, are unlikely to withdraw from unconventional monetary policies smoothly. Notably, Wood considers Bitcoin and gold as “critical hedges” against the resurgence of inflation.
Since spring of 2022, the Federal Reserve embarked on reducing its ballooning balance sheet of nearly trillion, which expanded significantly during the COVID-19 pandemic and subsequent economic downturn.
This process, known as quantitative tightening, involves draining liquidity from the financial system and shifting the burden of newly issued debt onto the private sector.
US Dollar Caught In ‘Death Spiral’
In addition to balance sheet reductions, the Fed has implemented rapid interest rate hikes to rein in soaring inflation. However, this approach has raised concerns about a potential counterproductive “death spiral” for the US dollar, potentially bolstering the value of Bitcoin.
Wood suggests that the Fed may be forced to adopt a more accommodating stance in response to a US recession. This shift would occur due to a larger-than-usual lag in the Fed’s interest rate hikes aimed at curbing inflation following the significant expansion of the money supply in 2020 and 2021.
Wood further explains:
Such a failure to exit from unorthodox monetary policy in a benign manner is likely to culminate in the collapse of the US dollar paper standard to the benefit of both gold bullion owners and also owners of Bitcoin. Meanwhile, Bitcoin, along with Ethereum and XRP to a lesser extent, has witnessed a surge in institutional interest, driven by the world’s largest asset manager, BlackRock.
The CEO of BlackRock, Larry Fink, who had previously expressed skepticism towards Bitcoin, made a notable shift in June. Fink’s endorsement of Bitcoin sparked a rush among Wall Street investors toward cryptocurrencies.
With custodian arrangements in place for digital assets, Bitcoin has gained credibility as an investable option for institutional investors, presenting itself as an alternative store of value to gold.
In conclusion, the Federal Reserve’s monetary policy challenges and the growing institutional interest in Bitcoin and other major cryptocurrencies have created a perfect storm, propelling their prices to new heights.
Per the report, investors increasingly turn to digital currencies as potential hedges against inflation and storehouses of value as the US dollar faces uncertainty.
When writing, the leading cryptocurrency in the market is trading at ,300, reflecting a decrease of over 2% in the past 24 hours. This decline follows an overall downtrend in the market since the beginning of the new trading week.
Notwithstanding the recent drop, BTC is positioned above its critical 50-day and 200-day Moving Averages (MAs). This favorable positioning may support a rebound in the cryptocurrency’s value and prevent further decline, helping it maintain the crucial ,000 milestone.
Featured image from Shutterstock, chart from TradingView.com
“Paper BTC” Is Counteracting A Bullish Bitcoin Supply Shock, Analyst Explains
An analyst has explained how the growth in “paper BTC” could be counteracting a bullish Bitcoin supply shock from taking effect.
Liquid Bitcoin Supply Has Dropped, But Paper BTC Is Still At Significant Levels
In a new post on X, analyst Willy Woo shared insight into how the paper BTC compares against the real BTC being traded. According to the analyst, “paper BTC” refers to the combined futures open interest value.
Here is a chart that shows the trend in the ratio between the two types of Bitcoin over the past couple of years:
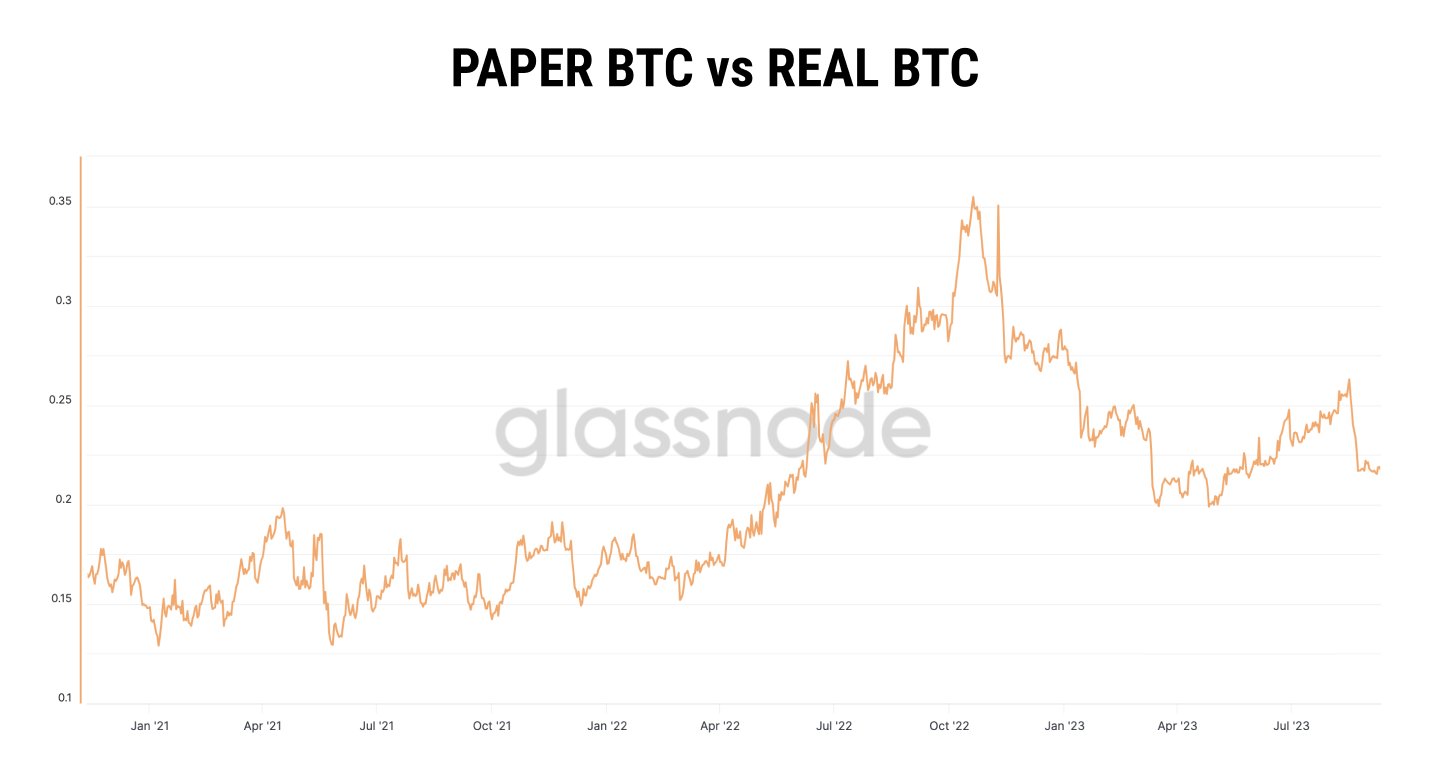
The graph shows that the ratio’s value has fluctuated between 0.2 and 0.3 in recent months, suggesting that the paper Bitcoin has been 20 to 30% more than the real coins during this period.
The real supply of the cryptocurrency may be divided into three categories: illiquid, liquid, and highly liquid. The on-chain analytics firm Glassnode puts coins into these divisions based on the behavior of the investors holding them.
To be more precise, the ratio between the cumulative outflows and inflows of the investor since they entered the market is used to define their liquidity. This ratio’s value approaches zero for the illiquid supply, as holders of this cohort rarely move coins out of their addresses.
Similarly, the value becomes close to 1 for the highly liquid supply, as investors of this class tend to shift their coins quickly. In the above ratio, Woo has only used this highly liquid supply as a measure of the “real BTC.”
As the chart below shows, this highly liquid Bitcoin supply has been going down recently.
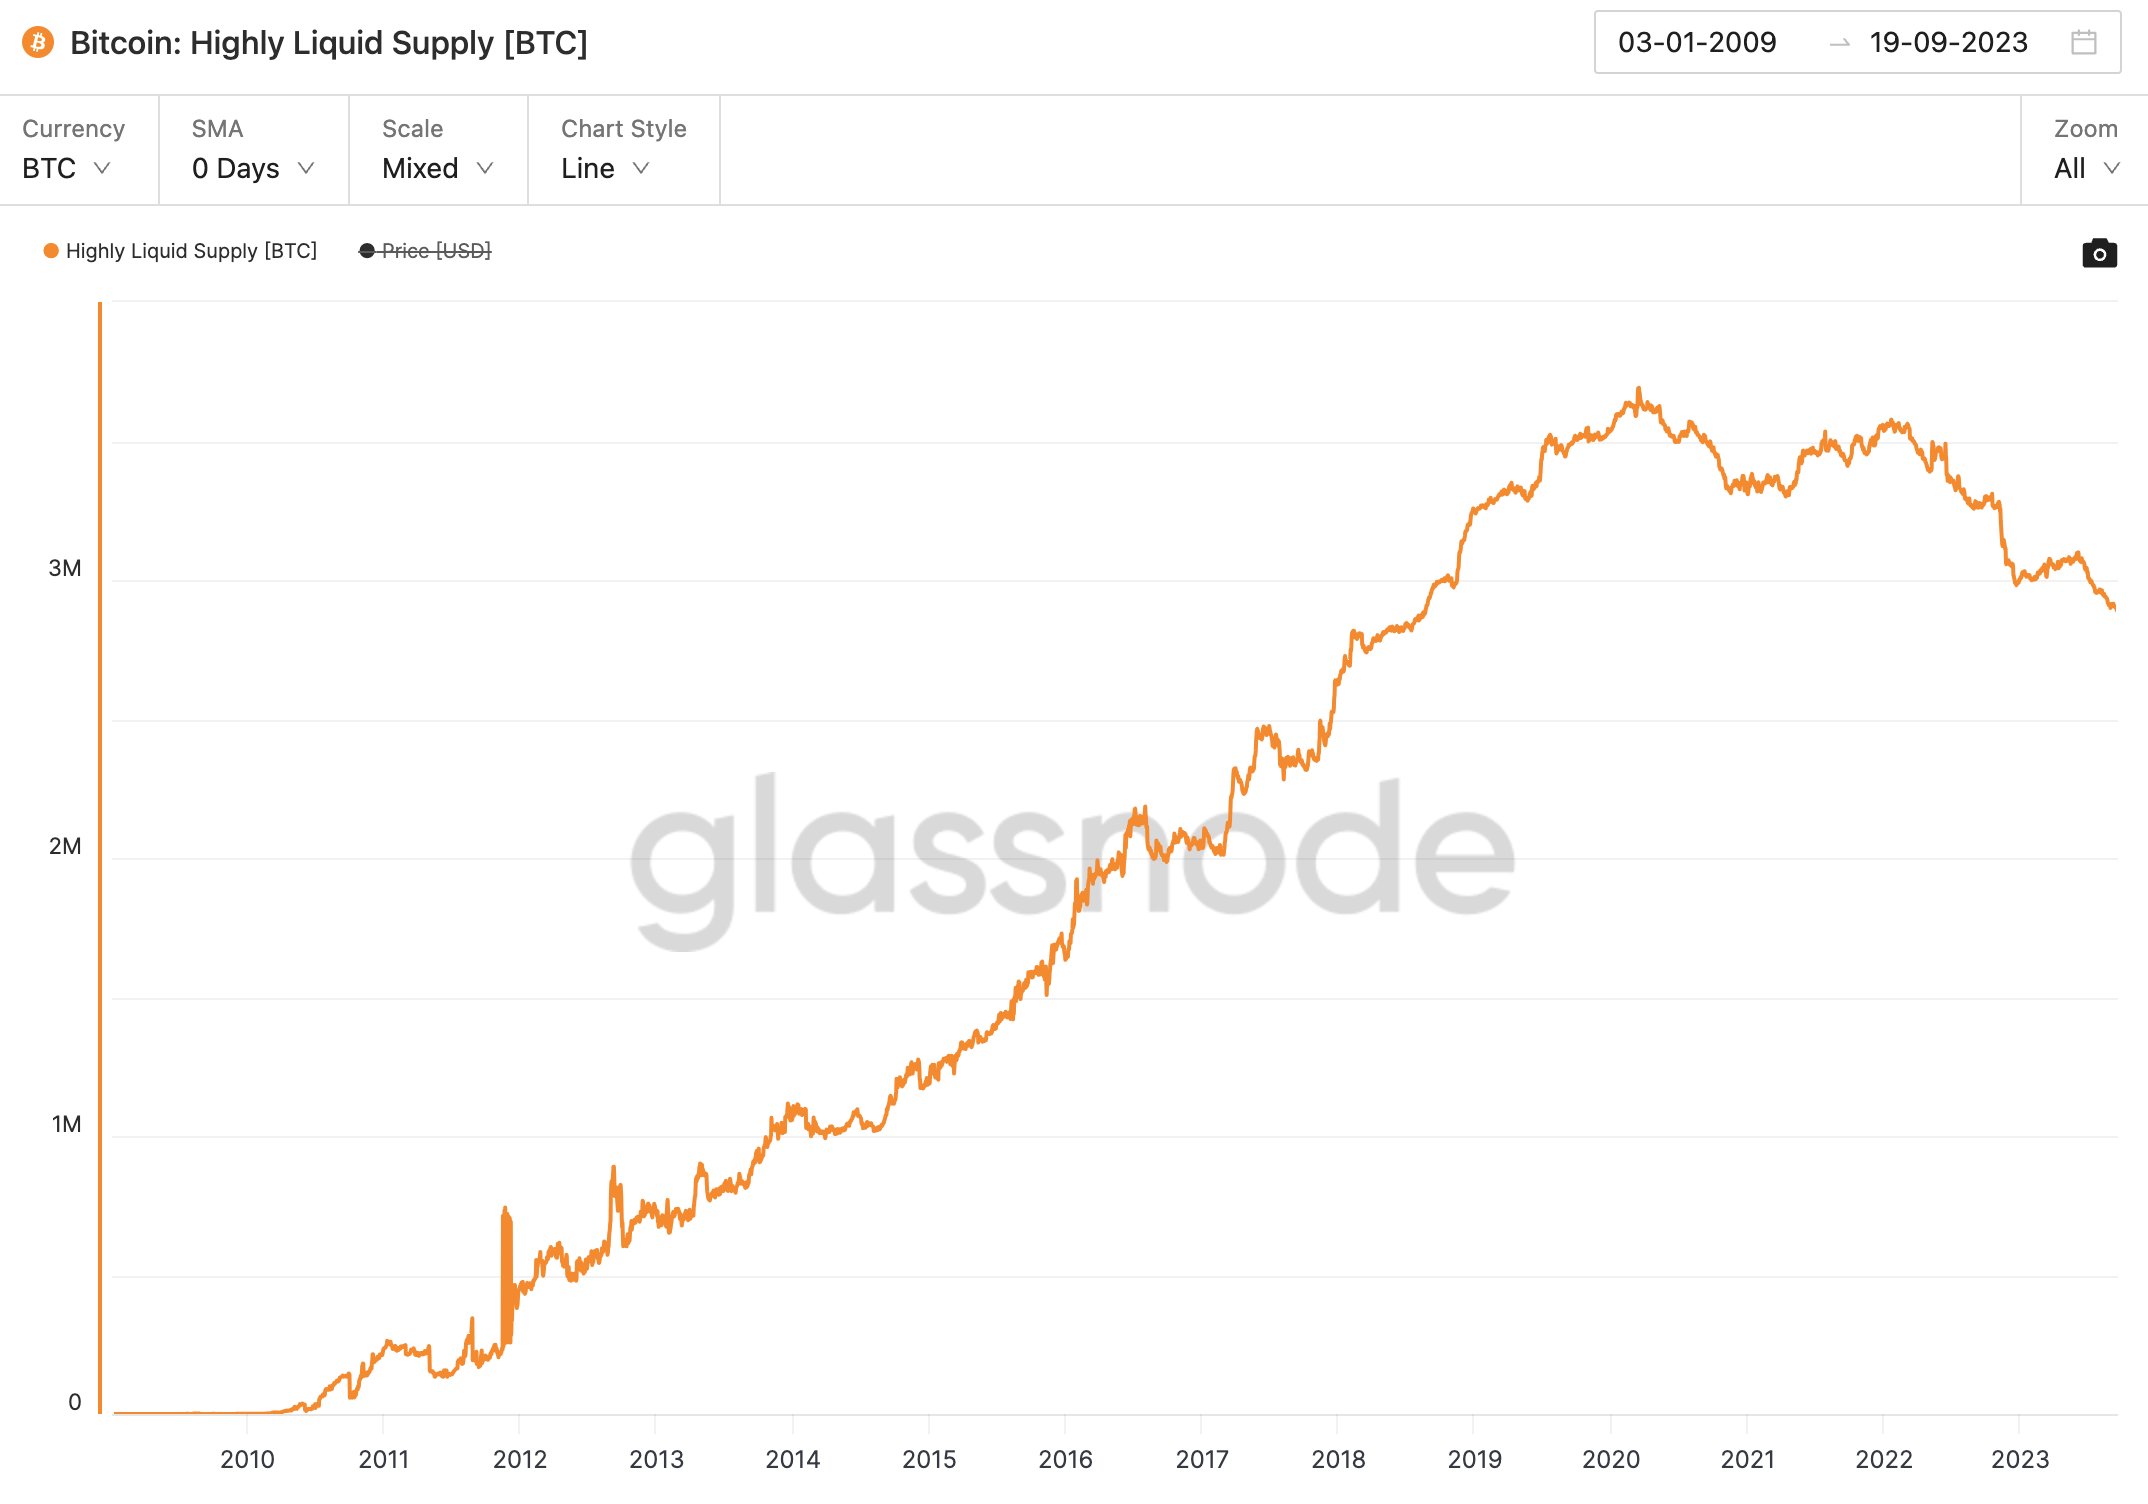
The analyst notes that the less the number of coins in this supply, the more bullish is the outlook for Bitcoin since there are a lesser amount of coins available to be bought.
Another analyst, James V. Straten, replied to Woo’s post with a chart that combines the liquid supply into the ratio, which, while less fluid than the highly liquid supply, still constitutes a notable part of the BTC traded supply.
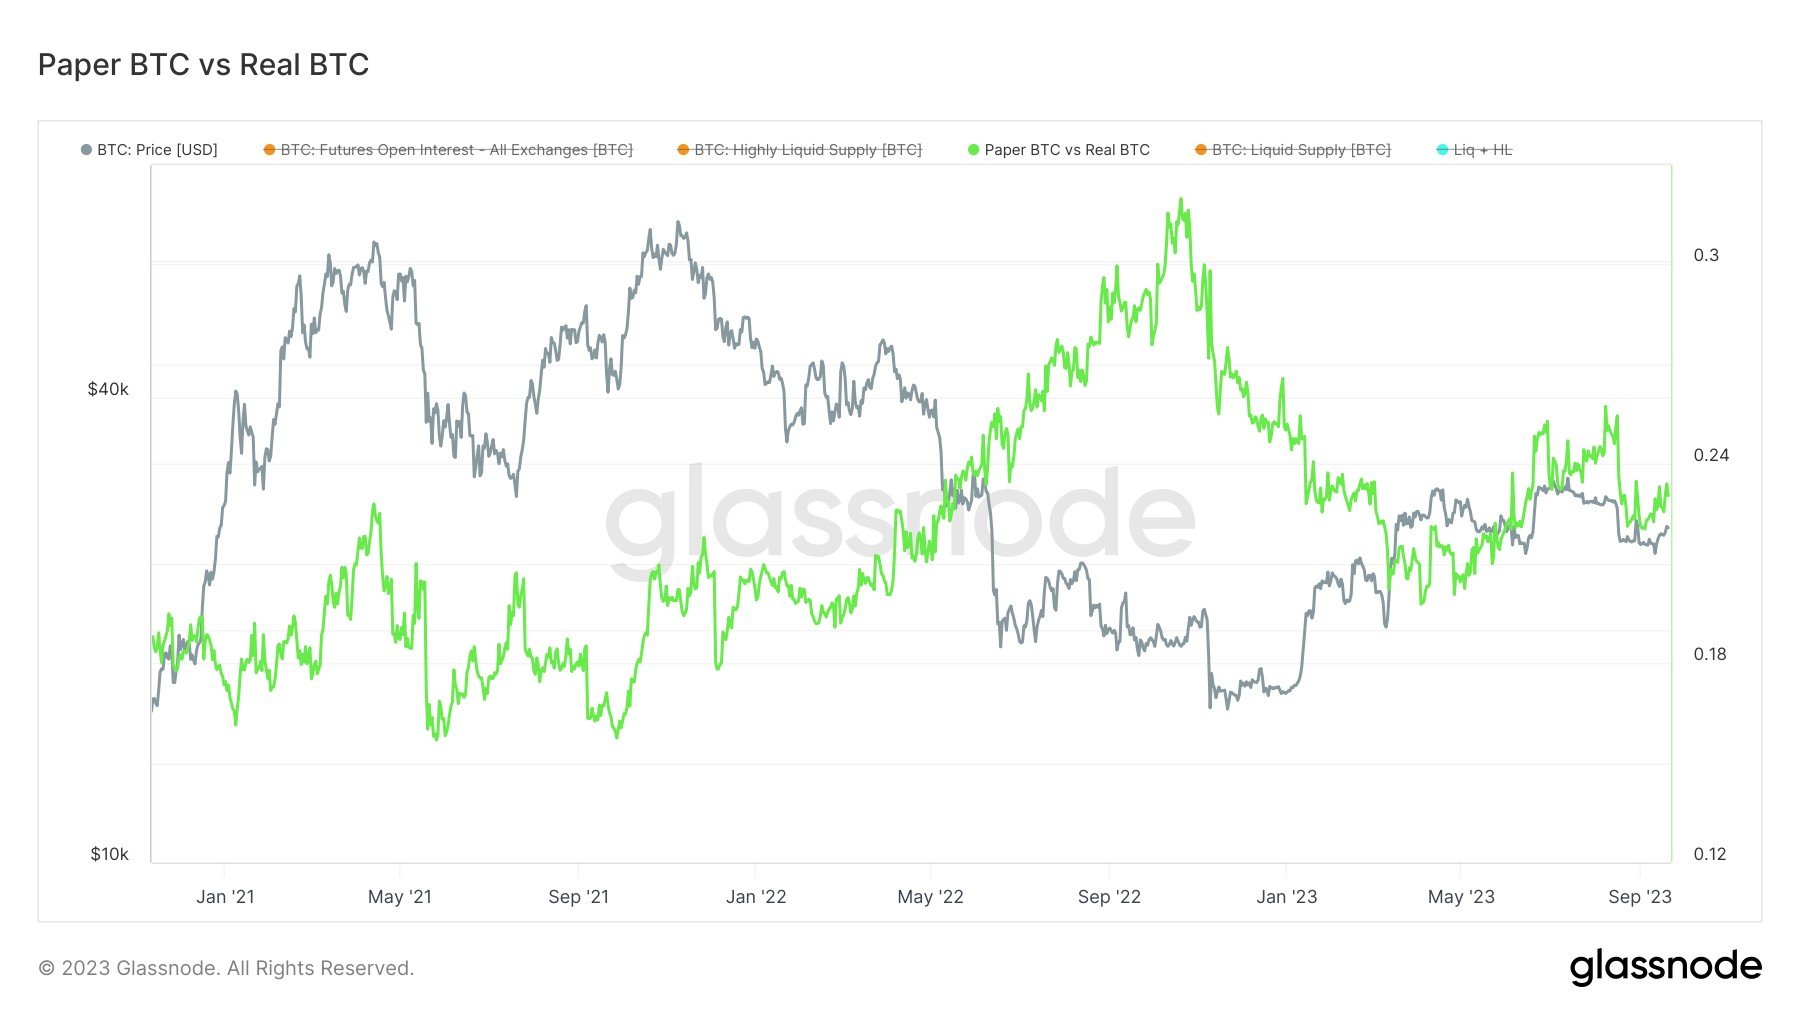
According to Straten, the liquid and highly liquid supplies have observed a combined drawdown of 500,000 BTC (around .3 billion at the current exchange rate) since May 2023.
However, as the paper BTC is still significantly more than the real BTC, any “supply shock” effects being created out of the real supply becoming less liquid are being more than made up for by the increase in the paper supply.
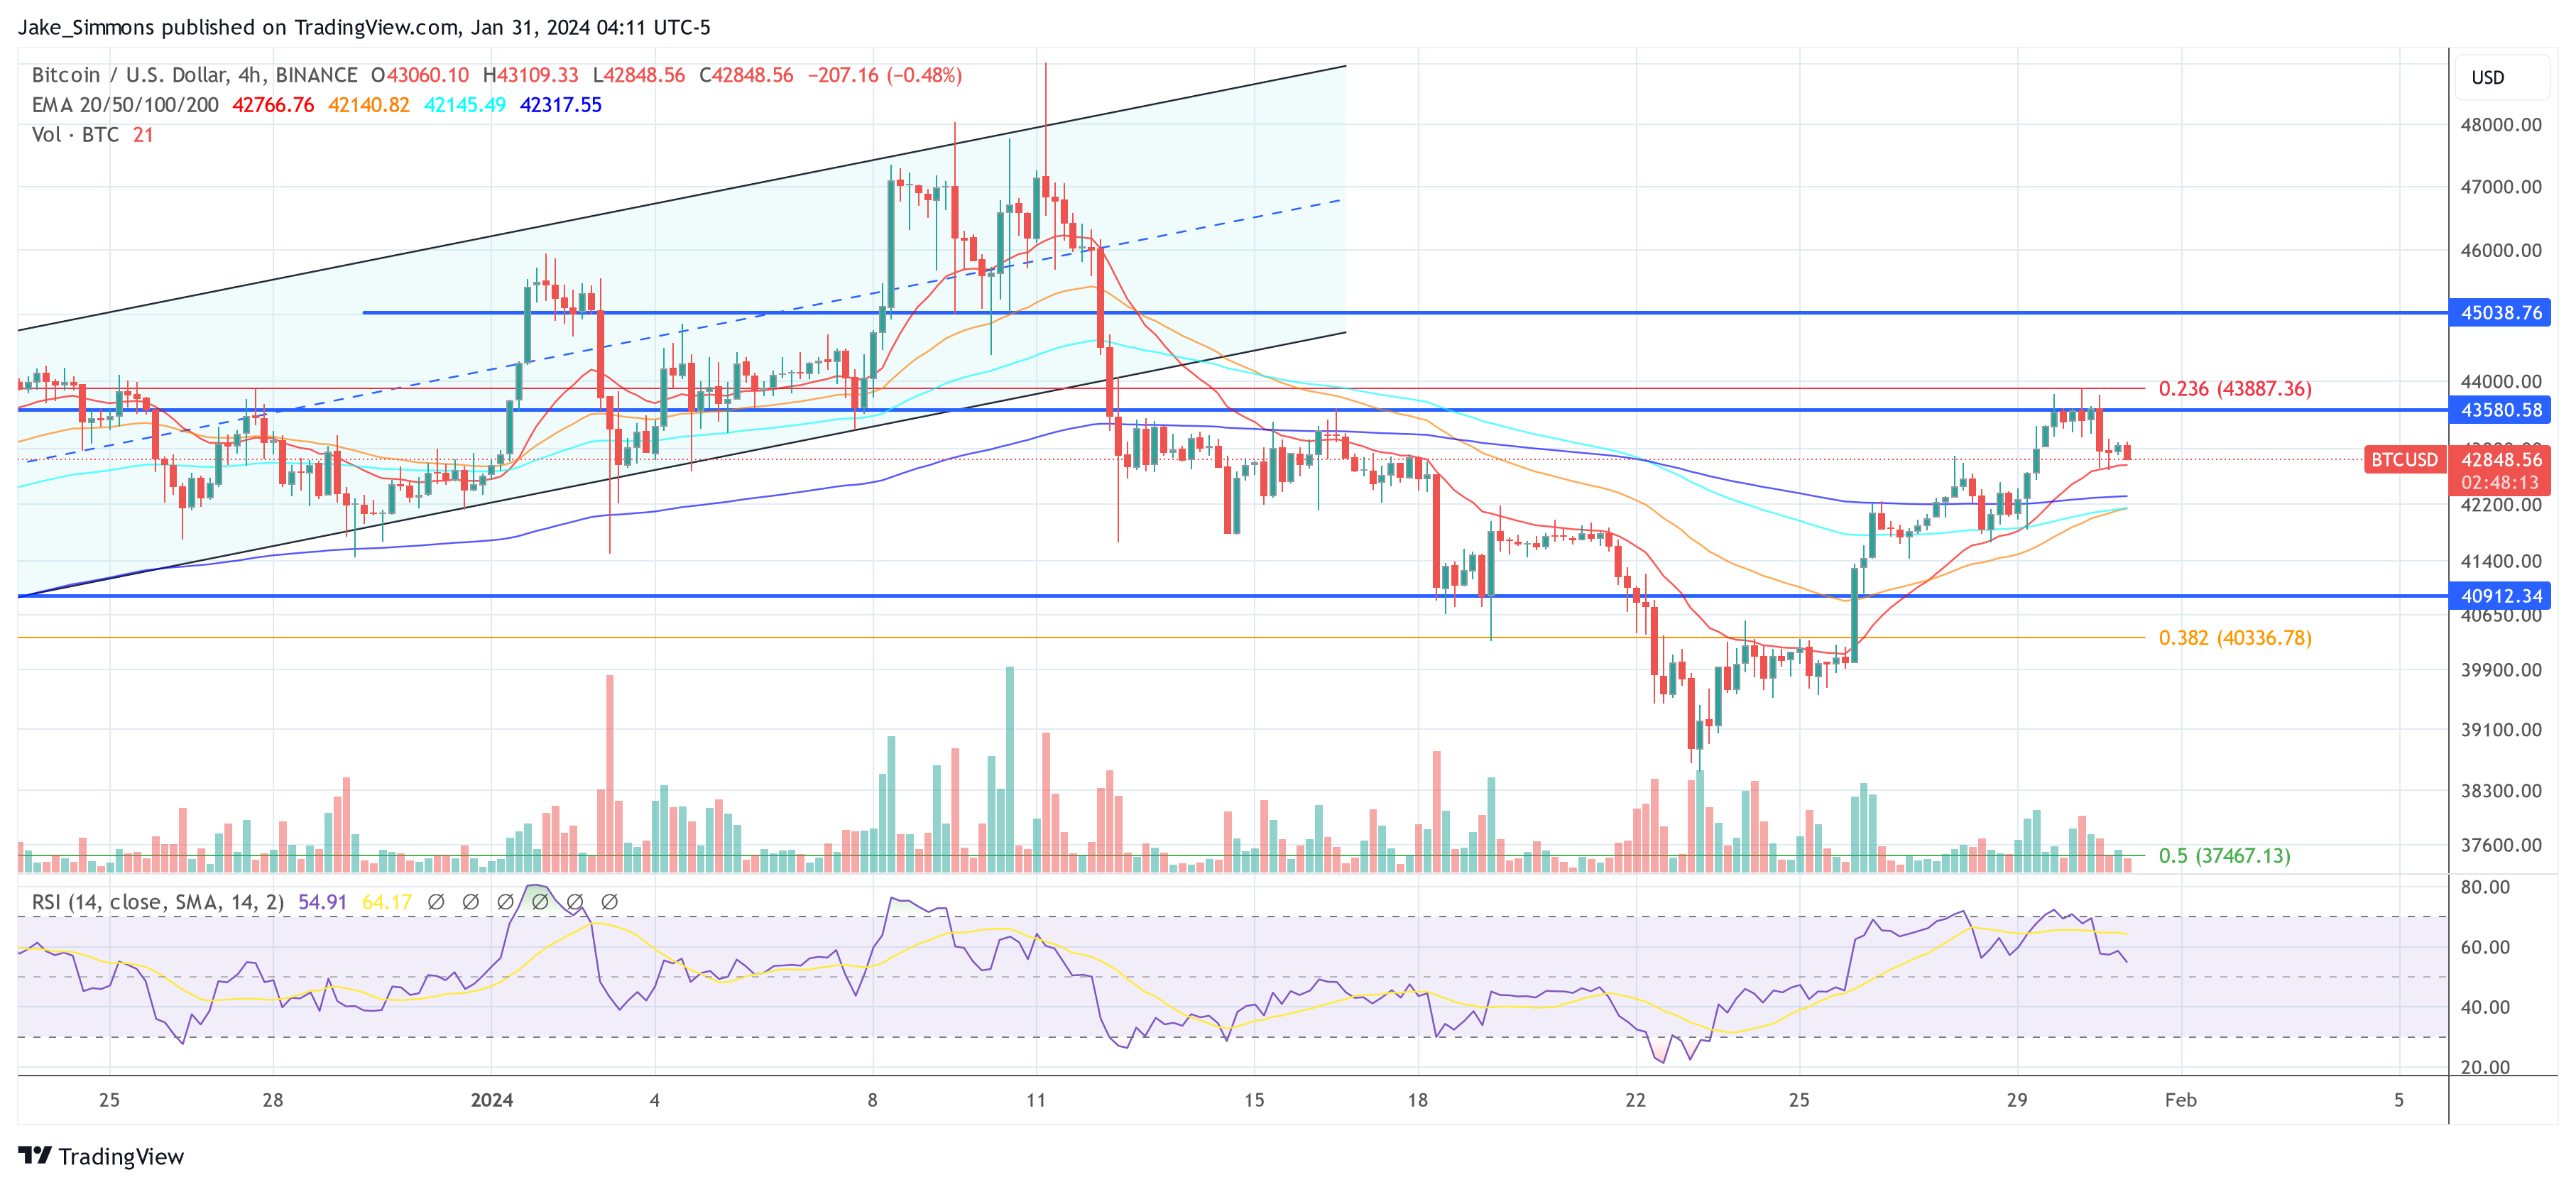
BTC Price
Bitcoin has registered a sharp decline in the past day, as the coin has lost the ,000 level and is currently floating around the ,500 mark.