 This week, blockchain observers noticed that the “37X” wallet, once holding the title of the fifth-largest bitcoin wallet, was activated for the first time since 2019. This significant move involved the transfer of 94,504.03 bitcoin into three distinct addresses. One of these recipient wallets has now risen to become the sixth-largest bitcoin holder, showcasing a […]
Bitcoin News
Report: Bitcoin’s Mining Landscape Braces for Shift as Halving Could Slash 100 EH/s of Hashpower
 Based on a recent analysis, numerous outdated bitcoin mining devices likely powered up in response to the latest uptick in bitcoin’s value. However, with the anticipated block reward halving, it’s projected that around 100 exahash per second (EH/s) of computing power might be disconnected after the event. Bitcoin Miners Enjoy Revenue Boost, Yet Face Potential […]
Bitcoin News
Shiba Inu Sees A Shift: Short Term Holders Take Possession Of 23 Trillion SHIB
Current market dynamics have seen Shiba Inu (SHIB) shedding off a lot of its gains earlier in the month. SHIB kickstarted a price surge on February 29th at .00001178 to reach .00004456 for the first time since December 2021, representing a surge of over 278% in the space of three days.
However, it seems investors are now pulling away from the meme cryptocurrency, and the bull frantic earlier in the month seems to be disappearing. Interestingly, on-chain data indicates that a chunk of over 23 trillion SHIB has moved from the hands of long-term holders into the wallets of short-term holders in the past four days. This cohort of addresses is known to hold their SHIB tokens for quick returns instead of holding them long-term.
Shiba Inu Price Downtrend Expected to Extend Beyond 45%
SHIB has been on a general downtrend since March 5 with the formation of lower highs in cases of brief uptrends. Notably, the crypto has dropped by 46% since attaining this two-year high. At the time of writing, SHIB is trading at .000024, down by 4.79% and 27% in the past 24 hours and seven days, respectively.
According to data from IntoTheBlock, Short-term Shiba Inu owners have now increased their possession by 23 trillion SHIB in the past four days, signaling lower prices ahead. According to ITB’s “Balance by Time Held” metric, the balance held by traders holding for less than a month has increased by 385% in the last 30 days. At the same time, long-term holders (more than a year) and cruisers (holding for one to 12 months) have reduced their balance by 9.27% and 11.30%, respectively.
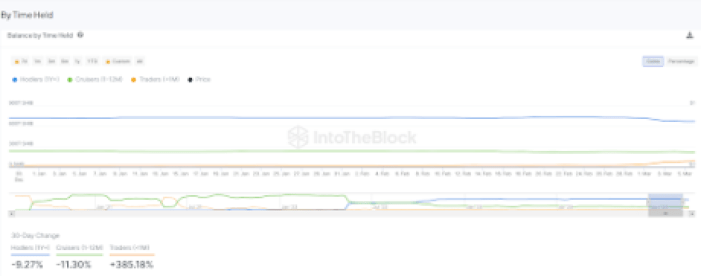 This interesting movement demonstrates the current dynamic among the various cohorts of SHIB traders. The decrease in long-term holder balance indicates they might be taking profit after holding for so long. At the same time, so much of the supply is moving into the hands of short-term traders seeking quick profits, making SHIB vulnerable to continued selloffs.
Technical Analysis: What’s Next For SHIB’s Price?
The overall technical indicators for SHIB point to short-term correction unless there is a change in bullish sentiment. The meme token has now broken below support at the .000026 price level and is now moving towards .000023, a level that has acted as a major resistance earlier in the month.
On the other hand, several fundamental factors point to a potential price recovery and continued growth for the meme coin. Despite its recent correction, the price of SHIB is still up by 144% in the past 30 days, which shows the uptrend can resume anytime soon.
With 1 Month to Go, Bitcoin Halving Poised to Shift Mining Dynamics
 Per the most recent data, we are a month away, or precisely 30 days, from the fourth Bitcoin halving event. This significant milestone will cut the mining rewards from 6.25 bitcoins per block to 3.125 bitcoins per block after the halving. The summary below outlines the essentials to grasp the changes occurring during the halving, […]
Bitcoin News
Goldman Sachs Sees More Institutions Diving Into Crypto — Says Bitcoin ETFs Prompt a ‘Psychological Shift’
 Goldman Sachs is seeing more institutions diving into crypto, the global investment bank’s head of digital assets has revealed, noting that until now the bitcoin price action has been driven primarily by retail investors. “But it’s the institutions that we’ve started to see come in,” he stressed, adding that the appetite has “transformed.” Bitcoin ETFs […]
Bitcoin News
Countdown to Bitcoin’s Fourth Halving: A Shift in the Crypto Economy Looms

At the time of writing, we are now less than 80 days away from Bitcoin’s fourth halving event, where the block reward will decrease from 6.25 bitcoins per block to 3.125 bitcoins per block post-halving. As is customary, market expectations have swelled, fueling speculation about whether the 2024 halving will diverge from its predecessors.
Anticipation for the Next Bitcoin Halving Grows
Based on current statistics and utilizing Bitcoin’s intended ten-minute block average, the fourth Bitcoin halving is just 78 days from today, scheduled for around April 21, 2024. However, the exact date remains elusive due to the variable nature of block times, which can either accelerate or decelerate the process.
For instance, as of this moment, the most recent block interval stands at seven minutes and 31.8 seconds, raising the possibility of the halving occurring as early as April 4, 2024, a mere 58 days from now. Bitcoin’s halving serves as a pivotal event ingrained in its protocol, designed to maintain its status as a deflationary asset.
This event directly influences the rate at which new bitcoins are minted and, consequently, the total supply of bitcoins in existence. Halving events are set to transpire once every 210,000 blocks, roughly equating to a four-year cycle, given the average ten-minute block time.
This schedule was etched into the Bitcoin protocol by its enigmatic creator, Satoshi Nakamoto. When Nakamoto launched the network, the first halving unfolded 1,425 days or 3.9 years later on Nov. 28, 2012, at block height 210,000, reducing the block reward from 50 BTC to 25 BTC.
The interval between the first and second halvings, transpiring on July 9, 2016, at block height 420,000, spanned 1,319 days or 3.61 years. The 2016 event further halved the block reward from 25 BTC to 12.5 BTC.
The most recent, or third halving, materialized on May 11, 2020, at block height 630,000, arriving 1,402 days or 3.84 years after the second halving. Since the third halving, 1,363 days have elapsed.
Scarcity Beckons as Proponents Hope History Repeats Its Famed Crypto Tale
Following the fourth halving, Bitcoin’s scarcity will intensify, as the inflation rate will shift from the current 1.69% annually to a mere 0.84% per annum. Bitcoin enthusiasts have high expectations for this event, with the pseudonymous analyst known as Plan B asserting that BTC “will be scarcer than gold and real estate.”
“It would surprise me if the bitcoin market cap, [which is less than trillion], will stay below the gold market cap, [which is more than trillion],” Plan B posted on X. “This implies a [bitcoin] price [of more than 0,000].”
Strategic advisor Mando CT, also recognized as the Xmaximist, chimed in with his insights regarding the impending halving event.
“History tends to repeat itself in the crypto world, and this time, there are extra factors that could push prices higher,” Xmaximist posted to social media. “The Fed’s interest rate hikes have halted, with cuts likely on the way. Plus, the approval of BTC ETFs makes it easier for retail investors to get in on the action.” The strategic advisor added:
In summary, now’s the time to get your halving strategy in order. With the proper preparation, you can make the most of this pivotal event in the crypto cycle.
Social media is abuzz with a flurry of posts centering on the much-anticipated halving event, with enthusiasts eagerly marking off the days. Among these posts, some are adorned with charts, serving to dismiss BTC’s recent price dip.
As Matt C aptly put it, “Bitcoin had its first -20% correction in almost a year and everyone panics. Find an OG of 2016 halving and ask if they even notice anymore.” Meanwhile, some individuals mock those who choose to part with their BTC holdings before the grand event unfolds.
“Having fun selling precious scarce bitcoin at ,000 right now – February 2024 – two months before the fourth Bitcoin halving, LMAO,” another individual wrote. At press time, less than 11,260 blocks are left until the halving occurs.
What do you think about the upcoming fourth Bitcoin halving event? Share your thoughts and opinions about this subject in the comments section below.
GBTC Experiences Record Bitcoin Outflow; Blockguard CEO Advises Investor Calm Amidst Market Shift

Grayscale’s spot bitcoin exchange-traded fund (ETF), known as GBTC, has experienced increased outflows since its recent update. Present data reveals that a substantial 14,292.18 bitcoin, valued slightly above 6 million, exited the fund after Monday’s trading activities.
GBTC Sees 6 Million Leave, Bitcoin Prices Slide Beneath K
Recent figures indicate a notable decrease in Grayscale’s spot bitcoin ETF holdings, declining from 566,973.40 BTC on Friday to 552,681.22 BTC currently. This reduction highlights that the fund’s most recent outflow is its largest to date, with 14,292.18 BTC, equivalent to 6 million, departing from the trust. Since Jan. 12, 2024, GBTC has seen its reserves diminish from 617,079.99 BTC to its present level, a loss of roughly 64,398.77 BTC, now valued at just over .5 billion.
On Jan. 22, the trade volumes for spot bitcoin ETFs reached .09 billion, with GBTC volume contributing .08 billion to this total. The latest figures reveal that Blackrock’s IBIT spot bitcoin exchange-traded fund (ETF) has experienced a notable uptick in its holdings, currently possessing 39,925.37 BTC as of Jan. 22, 2024. In a similar vein, Fidelity’s Wise Origin spot bitcoin ETF, known as FBTC, now boasts a holding of 30,169.54 BTC.
Grayscale’s outflows and the declining value of bitcoin have sparked widespread discussion on social media platforms. Bitcoin’s price has slid below the K threshold. Etoro’s market strategist, Simon Peters, commented on Monday morning that a portion of GBTC’s outflows can be attributed to investors migrating towards options with “lower fee alternatives.” Concurrently, xs.com’s market analyst, Antonio Ernesto Di Giacomo, pointed to bitcoin miner outflows as contributing to the downturn.
In a note sent to Bitcoin.com News, Blockguard CEO Anthony Bevan emphasized that retail investors should remain calm during the correction. “Retail investors need to be aware that large players in the market will always try to manipulate prices, this is done to flush out sellers’ lower price, and more often than not the big player will buy back in,” Bevan explained. “The important thing you is to stay calm and where possible DCA (dollar-cost-average) into your investment.”
Bevan additionally emphasized that predicting the duration of this downturn is an uncertainty. “However in my opinion, we will see a strong wick down to liquidate longs with bounce and slight recovery so that we find a range again, once we find a new range, we will have a better idea of where the market would go next,” the Blockguard executive added. Over the last 24 hours, coinglass.com metrics show .92 million in bitcoin long positions have been liquidated.
What do you think about the GBTC outflows and bitcoin’s price sinking below K? Let us know what you think about this subject in the comments section below.
Heightened Bitcoin Fees and Erratic Mining Revenues Herald Murky Shift as Halving Nears

Recent statistics reveal that for the past 75 days, starting from Nov. 6, 2023, the average transaction fee on the Bitcoin network has consistently stayed over . Additionally, since Dec. 4, 2023, these fees have predominantly been over , with a single exception occurring when it briefly fell to .33 per transaction.
Bitcoin Miners Face Complex Dynamics in 2024 Ahead of Halving Event
In 2024, the cost of the average onchain transaction fees has surged compared to the previous year. Over the last 46 days, these fees have consistently exceeded per transaction, with the sole exception being Jan. 13, 2024, when they momentarily dipped to .33. Throughout January this year, miners have amassed over 0 million in a combination of new BTC and transaction fees.
Over the last 46 days, median transaction fees on the Bitcoin network have consistently stayed above . Despite January showing stronger performance compared to most months in 2023, the recent decline in bitcoin’s value has impacted miner revenues. This downturn follows the mass approval of 11 spot bitcoin exchange-traded funds, leading to a bearish trend in BTC’s spot market behavior.
For instance, around Dec. 20, 2023, the daily value of one petahash per second (PH/s) of hashpower was nearly 0. By Jan. 19, 2024, this value had decreased by 34.59%, dropping to .48 per PH/s per day. Bitcoin miners also curtailed the hashrate this month leading to a significant drop in overall hashpower. The situation has been influenced by an increase in block time intervals between the previous difficulty adjustment and the upcoming retarget.
As a result, bitcoin miners might receive some relief on Saturday during the retarget epoch, with current estimates suggesting a potential decrease in mining difficulty. It’s projected that there could be a 4.4% reduction in difficulty, which may ease some of the pressure. However, the declining price of bitcoin continues to erode revenues. Additionally, miners are facing the challenge of processing a backlog exceeding 250,000 unconfirmed transactions.
Amid heightened transaction fees and fluctuating mining income, the impending halving looms as a critical juncture for the industry, with fewer than 14,000 blocks remaining. The recent downturn in price and the forecasted difficulty recalibration might herald a small change in mining operations, with market stability possibly affecting future earnings and the stability of the network. As miners tackle these challenges, their actions could create a benchmark, steering the course of the leading crypto asset’s economic environment in the coming months.
What do you think about the fluctuations and challenges bitcoin miners face before the upcoming halving? Share your thoughts and opinions about this subject in the comments section below.
Chainalysis Reveals Decline in Crypto Crime, Shift to Stablecoins in 2024 Crime Report

Chainalysis’ latest report reveals a dual trend in the 2023 crypto crime landscape: a notable decrease in overall value of criminal transactions and a surprising shift from bitcoin to stablecoins as the preferred medium for illicit activities.
2024 Chainalysis Report Reveals a Decline in Crypto Criminal Activity, Shift in Currency Preference to Stablecoins
In a revealing analysis of the cryptocurrency landscape, the 2024 Crypto Crime Trends Report by Chainalysis has potentially revealed shifts in the pattern of illicit activities within the digital currency space. The report, which provides a still-developing view of crypto-related crimes in 2023, has highlighted a notable decrease in the overall volume of criminal transactions, alongside a turn towards stablecoins by cybercriminals.
According to Chainalysis, the total value received by illicit cryptocurrency addresses in 2023 fell to .2 billion, marking a considerable decrease compared to previous years. This figure, however, is an underestimation and is expected to rise as more illicit addresses are uncovered. Apropos, the report revised the 2022 illicit transaction volume from an initial estimate of .6 billion to .6 billion, a more than 90% increase. This significant revision is attributed to the identification of new illicit addresses and the inclusion of transactions from sanctioned services.
Another reason the new total is so much higher, is the inclusion of .7 billion in creditor claims against the now-defunct cryptocurrency exchange FTX, following the fraud conviction of its CEO. This decision represents a departure from Chainalysis’ standard methodology, which typically focuses on measurable on-chain activity.
In a notable shift, the report observes that stablecoins have surpassed bitcoin as the preferred currency for illicit transactions. This change in preference aligns with the overall increase in stablecoin usage in both legitimate and illicit crypto activities. Despite this trend, bitcoin continues to dominate in specific criminal activities, such as darknet market sales and ransomware extortion.
Other key findings include a significant reduction in revenues from crypto scamming and hacking, which decreased by 29.2% and 54.3% respectively. The report attributes these reductions to a change in scamming strategies and improvements in defi protocol security.
The report also sheds light on the increasing role of transactions with sanctioned entities, which accounted for a significant 61.5% of all illicit transaction volumes in 2023. This trend raises questions about how to distinguish between criminal activities and legitimate transactions within sanctioned jurisdictions.
The report has garnered mixed reactions on social media, providing a striking example of confirmation bias in action. Both crypto enthusiasts and detractors have cited the report to bolster their opposite opinions on digital assets.
Overall, do you think crypto-based crime represents an increasing or decreasing amount of total crypto transaction volume? Share your thoughts and opinions about this subject in the comments section below.
Market Dynamics Shift as NFT Sales Tumble 63% Year Over Year

According to recent statistics on non-fungible tokens (NFTs) for the past year, sales hit .70 billion in 2023. This figure represents a .04 billion or 63.35% decrease in NFT sales compared to the previous year.
2023’s NFT Sales Volume Declined Sharply, but Year-End Market Dynamics Hint at Diversity and Growth
Throughout 2023, despite an uptick in demand towards the year’s end, the annual total still reflected a significant drop from 2022’s .74 billion in NFT sales. The year marked about .70 billion in sales, the lowest since 2019’s .75 billion. However, the quantity of NFT transactions in 2023 soared to 90,607,554, surpassing the 54,857,850 recorded in 2022.
Data from cryptoslam.io indicates that there were 4.16 million sellers and 4.97 million buyers of NFTs in 2023. While the year saw an increase in sellers from 2022, it didn’t surpass the 5,420,925 buyers recorded in the previous year. Despite Ethereum’s predominance in the market, Bitcoin and Solana saw a substantial increase in NFT sales towards the end of 2023, with Bitcoin outperforming Ethereum in November and December.

In the grand scheme, Bitcoin-focused NFT sales have climbed to the fourth rank with .83 billion in total sales. Ethereum continues to lead at a staggering .12 billion, followed by Solana at .62 billion and the Ronin blockchain, known for hosting Axie Infinity, at .25 billion. Despite the late surge in BTC-related NFTs, the Axie Infinity collection maintains its position as the top seller overall.
Axie precedes other notable collections like Bored Ape Yacht Club (BAYC) and Cryptopunks. Nevertheless, the past year saw a significant decrease in the base value of both BAYC and Cryptopunks. On Jan. 1, 2023, the BAYC floor value stood at 69.49 ether, with ETH priced at ,195, totaling approximately K. However, as of Jan. 1, 2024, the BAYC floor has dropped to 26.17 ETH, and with ether now at ,325 per coin, the value equates to about K.
Despite a notable dip in overall NFT sales, the increased activity and diversification of platforms and collections underscore a resilient and evolving sector. The shifting tides of buyer and seller demographics, coupled with the rise of Bitcoin-centric NFTs, hint at a market that is far from stagnant. While Ethereum continues to lead, the emergence of new contenders signals a broadening horizon for the NFT ecosystem.
What do you think about NFT sales dipping 63% in 2023 compared to 2022’s sales? Share your thoughts and opinions about this subject in the comments section below.