 Amidst the backdrop of this year’s skyrocketing BTC transaction fees and a congested network, the latest Binance Research report, “The Future of Bitcoin #3 – Scaling Bitcoin,” unveils several approaches to addressing Bitcoin scalability. As average onchain fees have climbed in 2024, Binance researchers say stakeholders across the ecosystem are poised to redefine Bitcoin’s infrastructure […]
Bitcoin News
New Research Paper Sheds Light on Alleged Conflicts of Interest in FTX’s Chapter 11 Filing
 A recent research paper on SSRN by legal scholars scrutinizes the ethical quandaries and potential conflicts of interest surrounding Sullivan & Cromwell LLP’s involvement in FTX’s Chapter 11 bankruptcy filing. Study Highlights Legal Ethics From FTX Bankruptcy Proceedings The SSRN research paper entitled “Conflicting Public and Private Interests in Chapter 11” meticulously explores the controversial […]
Bitcoin News
Grayscale’s GBTC Sheds Over 13,700 BTC in 24 Hours Amid Rising Bitcoin ETF Competition
Prior to Wednesday’s market opening, Grayscale’s exchange-traded fund, GBTC, reported holding 605,890.87 bitcoin in reserves. However, according to the company’s most recent update, there has been a significant decrease in GBTC’s holdings, with a reduction of 13,793.09 bitcoin, valued at approximately 1 million.
Major Outflows Hit Grayscale’s GBTC
This recent decline in reserves marks another 13,793.09 BTC withdrawal from Grayscale’s assets since Bitcoin.com News covered its reductions on Wednesday. Analyzing data from Jan. 14, 2024, records show that Grayscale’s Bitcoin Trust had a total of 617,079 BTC. Consequently, within a span of just four days, a staggering 24,981.22 BTC has been withdrawn from the fund. This substantial outflow, occurring from Jan. 14 to Jan. 17, represents a removal of over billion in value from the fund’s bitcoin holdings.
Currently, as of 2:38 p.m. Eastern Time (ET) on Thursday, the GBTC holdings stand at roughly 592,097.78 BTC. Calculated at the prevailing exchange rate prices at same moment in time, the value of the fund’s BTC cache is estimated to be around .5 billion. GBTC once held an edge on the market when it was traded over-the-counter (OTC) and before it recorded a discount to net asset value (NAV), in 2019 it witnessed a significant premium.
When it became a discount in February 2021, the discount to NAV widened a great deal and lasted up until the fund was converted into a publicly accessible spot bitcoin ETF. The market may be feeling the brunt of these sales, but at the same time, several newly approved spot bitcoin ETFs are stacking BTC reserves. Blackrock’s IBIT now holds 25,067 BTC and the Fidelity Wise Origin Bitcoin Fund (FBTC) holds 20,507 BTC.
Bitwise’s BITB, with 8,309 BTC, secures its position as the third-largest (excluding GBTC) among bitcoin ETFs in terms of BTC reserves. Ran Neuner, the founder of Crypto Banter, recently shared insights about the GBTC outflows on the social media platform X. “The GBTC overhang will be around for a while. I don’t see any way that the other ETF’s absorb it,” Neuner remarked. “If Blackrock had huge immediate buyers, they would be in already. I suspect and have been warning that we are due for a correction and we may be midway through it. My first downside target is ,600 to close the CME gap,” he added.
JPMorgan market strategists led by Nikolaos Panigirtzoglou detailed in a note sent to investors on Thursday that an additional .5 billion might still depart from the bitcoin ETF market through GBTC profit-taking. This scenario could exert “further pressure on bitcoin prices over the coming weeks,” Panigirtzoglou wrote. Analysts had earlier projected a decrease of billion in GBTC’s value, and to date, approximately half of this anticipated reduction has materialized. By 4:11 p.m. (ET) on Thursday, BTC was trading for ,838 per unit, after hitting a 24-hour low of ,600 at 3:00 p.m. during the afternoon trading sessions.
What do you think about the GBTC outflows since the exchange-traded fund started trading publicly last week? Share your thoughts and opinions about this subject in the comments section below.
Shiba Inu Burn Rate Skyrockets Over 300% As Price Sheds A Zero
The Shiba Inu burn initiative has been one of the most notable developments this week that has gained the interest of the crypto community, witnessing massive surges in its token burn rate in the past few days.
Shiba Inu Burn Rate On The Rise
Data from Shiba Inu burn tracker Shibburn shows that the SHIB burn rate has increased significantly in the past 24 hours. According to the tracking platform, the burn rate has witnessed a 395.43% uptick today, January 12.
The tracker reveals that over 18 million SHIB tokens have been destroyed in the past 24 hours. The rise in burn rate came in light of Shiba Inu experiencing a price rally which has led to the token erasing another zero.
It is noteworthy that three burn transactions were responsible for the rise in burn rate today. Shibburn revealed that the three transactions incinerated a total of 16.56 million SHIB tokens in less than 8 hours.
The first transaction carried out by the wallet address 0x618ffd1cdabee36…3f21272bd7 saw about 7.77 million SHIB tokens being burned. Additionally, another wallet address 0xab782bc7d4a2b30…f8f63ee1bc sent over 3.33 million SHIB to the burn wallet five hours later.
Meanwhile, the third transaction initiated by the wallet address 0xa9d1e08c7793af6…7fb81d3e43 incinerated about 5.46 million SHIB tokens.
Over the past few days, the Shiba Inu burn rate has been recording major spikes. The development seems to have caused quite a speculative frenzy within the crypto space.
On Tuesday, January 9, the tracking platform recorded an increase in burn rate of over 28,000%. The surge was caused by a burn transaction carried out by the Shiba Inu team.
The team sent a whopping 9.35 billion SHIB tokens valued at ,553 to the burn address. This marks the highest burn the team has initiated since it started burning SHIB.
SHIB Erases Another Zero Post ETF Approval
The majority of crypto assets are flashing green, signaling a general upturn in the cryptocurrency market. The recent approval of the Bitcoin Spot Exchange-Traded Funds (ETFs) by the SEC is largely considered to be responsible for the upward trend.
Prior to the approval of Bitcoin ETFs, Shiba Inu was trading at a comparatively low value of .0000095. However, after the approval, SHIB has witnessed a price increase, allowing the token to shed another zero.
The increase in SHIB price post-ETF has garnered interest from investors and generated speculations over the coin’s potential for long-term growth.
Currently, SHIB is trading at .000010, indicating a 0.60% decrease in the past 24 hours. However, the token’s trading volumes appear to be down in the past day by over 12%, according to CoinMarketCap.
Falling Down: XRP Sheds 10% As Short-Term Recovery Prospects Remain Dim
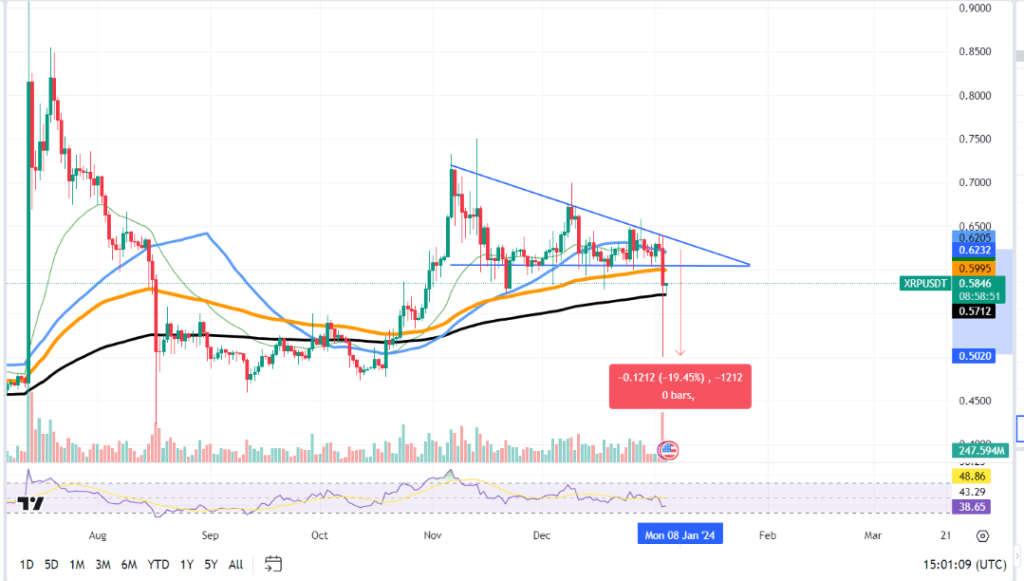
Over the past day, cryptocurrency prices have plummeted, with XRP being among the worst hit—it has lost 10% of its value while the market as a whole is reeling from extreme volatility.
The price of XRP has dropped significantly and abruptly, causing a seismic shift that is similar of the one that occurred in August of last year.
The price chart below shows a significant decline, signifying the liquidation of derivatives valued at millions of dollars in a very short amount of time.
This unanticipated decline has had a significant impact, upsetting many traders and disrupting a wide range of trading portfolios.
The severity of this price decline have brought an unexpected degree of volatility to the market, which has caused traders and risk managers to reevaluate their trading tactics.
The current upward trend of XRP has come to a halt. With Ripple releasing one billion XRP from its escrow accounts this week, the bearish attitude surrounding XRP seems to be growing.
To give the market a regulated level of liquidity, this regular process, which occurs on the first of every month, entails three distinct transactions.
Notwithstanding XRP’s present consolidation near the .6 mark, its prior January performance may have encouraged investors.
With the exception of 2022, XRP has typically demonstrated a positive trend in this month during the past four years. XRP has increased by 30% on average in January.
XRP Price Analysis
The chart analysis reveals an interesting trend in the XRP market, which is characterized by a consolidation phase inside a contracting price range.
The traders’ interpretation of this consolidation pattern as an accumulation period led to elevated anticipation of a possible bullish rise. This story was upset, nevertheless, by the rapid crash in XRP that followed.
The chart’s long downward wick suggests a sharp sell-off that caused prices to drop sharply and quickly.
A market where sellers have applied considerable pressure, overwhelming buyers and initiating a series of liquidations when stop-loss orders are executed in large quantities, is usually indicated by such price behavior.
The ramifications of this sudden decline are significant. The reversal of the previously noted accumulation phase casts doubt on the previously validated bullish setups and adds a degree of uncertainty.
This event suggests that there has been a shift in market sentiment, with a notable decline in confidence over XRP’s potential for immediate growth.
It will now be up to traders and investors to come to terms with this new reality, and it can take some time for the market to stabilize and sentiment to return.
Short-Term Recovery Prospects Uncertain
The cloud overhanging XRP’s recovery prospects in the near term points to a cautious and possibly pessimistic mood.
Because of the invalidated bullish settings, investors need to reevaluate their expectations and may become more cautious as they wait for more definite signs and proof of rekindled trust in the asset.
All things considered, the analysis suggests that the unanticipated price dynamics seen in XRP have resulted in a period of adjustment and uncertainty.
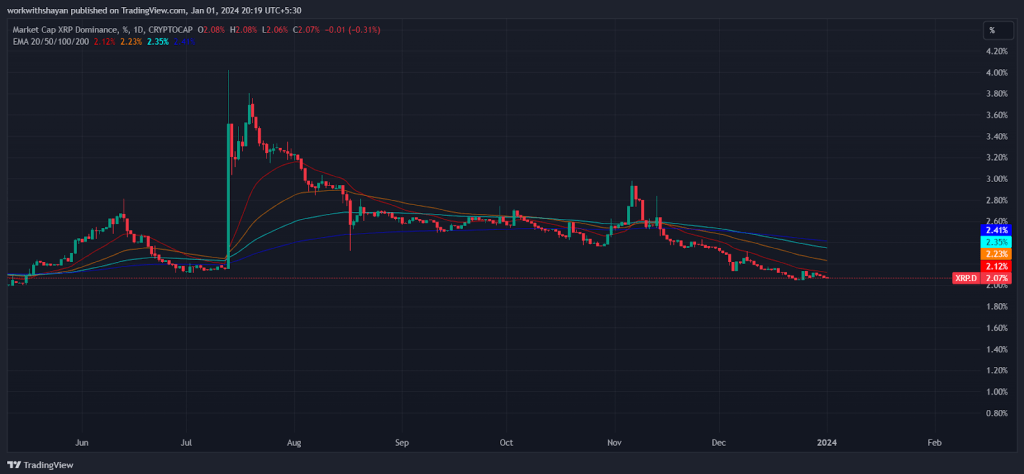
What About Market Dominance?
Meanwhile, since November, XRP’s market dominance has decreased; at 2.07%, it is currently trading below that level.
The long/short ratio, which is at 0.9771, indicates that there has been a discernible battle between bullish and bearish traders recently, particularly around the .6 level.
Currently, over 50% of holdings anticipate a bearish move, while 49% anticipate a price increase for XRP.
Featured image from Pixabay
XRP And XLM In Lockstep? Expert Sheds Light On Their Surprising Price Synchronization
Recently, a notable observation has been the significant correlation between XRP and XLM’s price action. This phenomenon has caught the attention of industry experts and investors alike, leading to a deeper examination of the factors driving this trend.
Ripple’s Chief Technology Officer (CTO), David Schwartz, has weighed in on this topic, addressing the liquidity aspects of XRP and XLM. However, despite the visible correlation, Schwartz argues that more liquidity is needed in the XRP/XLM market to cause a notable price correlation.
This statement is based on data from CoinmarketCap, which illustrates the parallel price movements of these two cryptocurrencies over the past year. Schwartz’s insights provoke a deeper analysis of the potential reasons behind the alignment in their price behaviors.
Coinmarketcap makes it easy to compare the charts of various tokens. Here’s XRP versus XLM over the past year: pic.twitter.com/qNzfIu2TTB
— David “JoelKatz” Schwartz (@JoelKatz) December 18, 2023
Unraveling The Factors Behind XRP And XLM’s Correlated Price Movements
David Schwartz has identified three key factors influencing the XRP-XLM price correlation. Firstly, he posits that the entire digital asset market is significantly interconnected.
The market is still determining cryptocurrencies’ long-term viability, so industry news tends to affect all tokens, not just specific ones. This broader market sentiment could drive the correlation observed in XRP and XLM.
Secondly, Schwartz suggests that the dominance of Bitcoin in the cryptocurrency market could play a role. Given Bitcoin’s substantial market share and its influence on liquidity within the crypto space, movements in Bitcoin’s price often result in ripple effects across other crypto, including XRP and XLM.
I think there are a variety of factors that might be at play and it’s hard to know which are real.
One thing is that all digital assets track each other significantly. I think that’s because the market is still trying to figure out if they’re going to be a thing and so industry…
— David “JoelKatz” Schwartz (@JoelKatz) December 18, 2023
The third factor revolves around the crypto community’s perception that XRP and XLM require similar market conditions to thrive. However, Schwartz noted that he is “not sure if he believes this.”
Developments within the broader crypto industry could prompt parallel reactions from users of both tokens, leading to correlated price patterns.
Diverse Perspectives: From Short-Term Volatility To Long-Term Convictions
On the other hand, Bill Morgan, a lawyer and digital asset enthusiast, brings a different viewpoint, mainly focusing on XRPL token. Addressing recent market volatility, Morgan emphasizes the importance of a long-term perspective when analyzing XRP’s price action.
Responding to crypto community concerns about XRP’s performance, especially during heightened market movements, Morgan argues that convictions about the token should go “beyond short-term price fluctuations.”
Morgan’s stance is echoed by Matt, the Moon Lambo YouTube channel host, who points out that XRP’s price drop was not as severe as some in the crypto community perceived. Matt’s analysis places XRP at a moderate position among the top 50 coins by market cap in terms of gains and losses.
This is correct but placed in the context of XRP’s price action over the last month it is not great. XRP is down over 2% over the last month. Many but not all top 50 coins are up over the last month. In that context the fall was harder comparatively than could have been expected… https://t.co/VrlD2k0mWu
— bill morgan (@Belisarius2020) December 19, 2023
However, Morgan notes that the token’s performance over the past month has been lackluster, falling by over 2% despite a market-wide rally. This observation suggests that XRP’s decline was more pronounced than that of some of its peers, warranting a closer examination of its market dynamics.
Featured image from Unsplash, Chart from TradingView
Grayscale Report Sheds Light on Bitcoin’s Broad Ownership and ‘Sticky Supply’ Dynamics
A new report from Grayscale Investments reveals that bitcoin ownership is more widely distributed than commonly believed, with 74% of addresses holding less than 0 worth. However, around 40% of bitcoin supply is concentrated among institutions like exchanges, miners, governments, public companies, and long-term holders.
Grayscale Research Team’s Bitcoin Analysis — Supply Dynamics Poised to Jolt Markets
Grayscale Investments, one of the largest digital asset managers in terms of assets under management (AUM), has published a study that discusses bitcoin (BTC) ownership. Grayscale delves into the “stickiness” of bitcoin’s supply, exploring why the firm believes this aspect is especially pertinent at present, and its potential implications for the asset going forward.
While the majority of bitcoin owners are small retail investors spread across the globe, sizable portions are held by large entities like crypto exchanges, representing millions of users, as well as governments. The report highlights how there are other major owners including mining companies securing the network, public companies like Microstrategy, exchange-traded funds (ETFs), trading platforms, and dormant addresses inactive for over ten years.
Grayscale’s study says that some ownership groups seem to represent “sticky supply” that resists selling during price swings. For example, the researchers highlight decade-long inactive supply recently hit an all-time high, while miner and exchange balances have remained steady despite bitcoin’s volatility.
This inelasticity could amplify the price impact of external events that drive new demand, like the 2024 halving or a potential U.S. spot bitcoin ETF approval. As Grayscale notes, “Given the various inactive or price inelastic bitcoin ownership groups, this dynamic could prove particularly relevant to bitcoin.” The study anticipates ownership dynamics increasingly affecting bitcoin’s price response as illiquid supply grows and short-term supply shrinks.
Grayscale’s analysis highlights how bitcoin’s widespread distribution among both individual and institutional investors signifies its growing mainstream acceptance and evolution. Concurrently, the report notes that a limited supply may enhance positive market forces, according to the researchers.
Concluding the report, it states, “If these trends continue, the Grayscale Research team anticipates that the dynamics of bitcoin’s ownership could increasingly amplify the impact of macro events.”
What do you think about Grayscale’s report about bitcoin’s distribution among different entities and the “sticky supply” scenario? Share your thoughts and opinions about this subject in the comments section below.
XRP Price Confirms Early Stages Of Bull Market? Data Sheds Light On Recent Rally
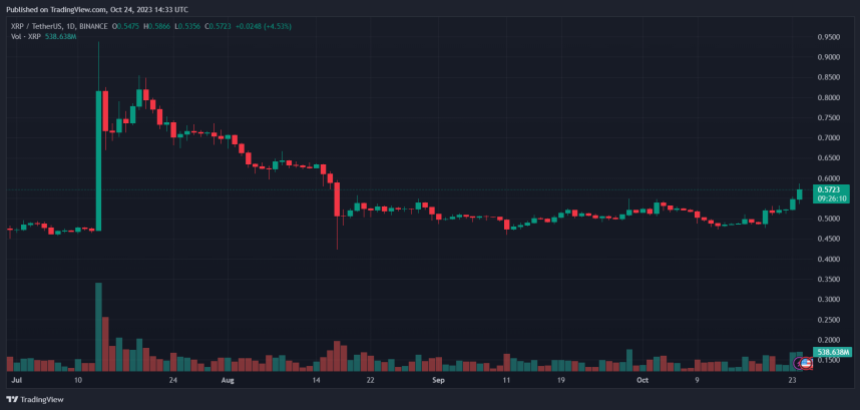
Volatility is back in the crypto market as the XRP price and the price of other major cryptocurrencies trend to the upside and into new year highs. The cryptocurrency is heading towards its next resistance level with a high chance of
As of this writing, the XRP price trades at .57, with a 9% increase in the last 24 hours. The cryptocurrency recorded a 16% spike in the previous seven days and closely followed Bitcoin and Ethereum’s price action, which recorded a 22% and 16% profit over the same period.
XRP Price On Its Way To Next Critical Level
According to an XRP trader on social media platform X, the token’s price exceeded the critical resistance level of .528. The analyst claims that there is a high chance that the XRP will rise close to .60 in the short term.
In that sense, the trader believes that .66 will operate as the next critical resistance level based on the chart below. The analyst compared the current XRP price with the 2017 bull run.
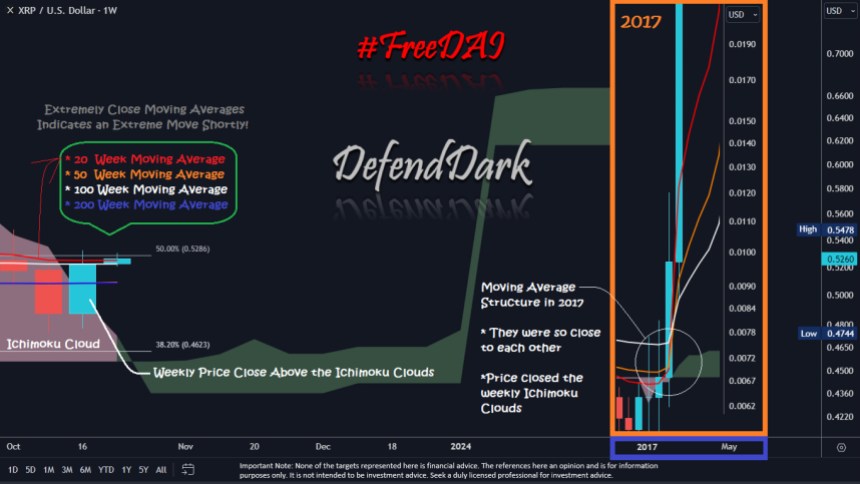
The chart shows that during the 2017 run, XRP closed above the weekly Ichimoku Cloud, a level used to gauge critical resistance and support levels. Once the token broke above that level, it could quickly fall into new highs and price discovery.
The analyst stated the following about the XRP price and its potential to continue its run:
This is not a warning or financial advice, but I would like to share it with you and emphasize how close we are after this weekly close. It seems the weekly Ichimoku close will be above the clouds, and it only happened before the 2017 run and 2021. When it happens, it happens. Be Ready.
Crypto Market Poised For Further Highs
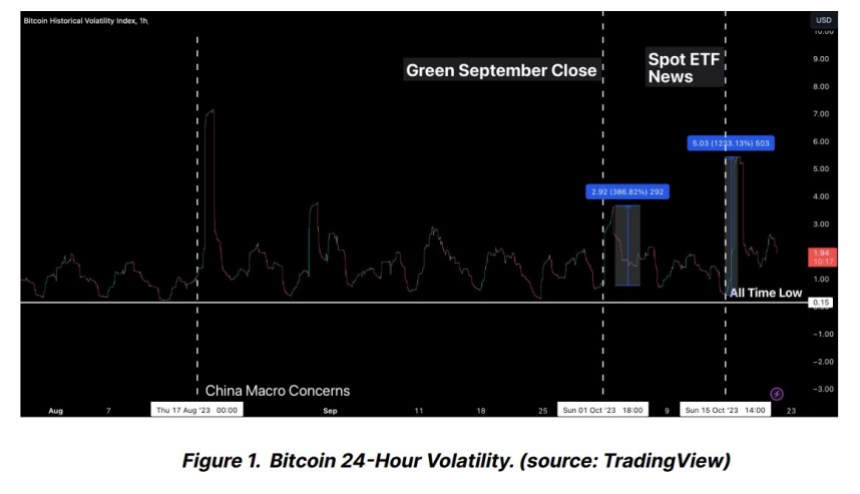
A report from Bitfinex Alpha corroborates the market susceptibility to “new narratives.” In particular, the potential approval of a spot Bitcoin Exchange Traded Fund (ETF) in the US.
As the XRP price and the market continue to rip higher, volatility in the sector is likely to remain high. As seen on the chart below, the crypto has been inching higher and higher with each volatility event (the potential approval of a Bitcoin ETF was the most recent.
In addition, the crypto research firm points to an increase in on-chain activity, which has historically supported higher prices for the sector:
On-chain activity also continues to support the conclusion that higher volatility is here to stay and that it will grow in the coming months. Our analysis of Spent Output Age Bands (SOAB), which track the age of coins when they’re spent, and in particular the “age bands” of UTXOs that are most active, we can discern which group of investors is predominantly influencing market changes. For instance, if the UTXOs aged between three and five years show significant activity, it implies that investors who have held their positions for that time span are the primary movers in the market at that juncture.
Cover image from Unsplash, charts from Bitfinex Alpha, Dark Defender, and Tradingview
Ex-General Counsel Sheds Light on FTX’s $7B Gap in Bankman-Fried Fraud Trial

FTX’s former general counsel Can Sun testified Thursday in federal court that he was shocked to learn FTX founder Sam Bankman-Fried (SBF) had secretly transferred billions in customer funds to his hedge fund Alameda Research. Sun told prosecutors he resigned the day after realizing the scope of customer money siphoned, following spreadsheets showing billion was missing.
‘Funds Had Been Misappropriated,’ Former FTX Lawyer Says
Can Sun, former general counsel of the failed crypto exchange FTX, took the stand Thursday in Sam Bankman-Fried‘s criminal fraud trial. Sun told federal prosecutors he was unaware FTX had secretly transferred customer funds to Bankman-Fried’s trading firm Alameda Research.
“I was shocked. There were billion missing,” testified Sun about learning the extent of fraudulent transfers. Prosecutors displayed FTX spreadsheets to Sun, who said he concluded “funds had been misappropriated.” Sun’s testimony was published by Matthew Russell Lee from the Inner City Press.
Sun outlined resigning as general counsel the day after his revelation, despite joining FTX from the law firm Fenwick & West. Sun claimed he approached SBF regarding the concerns, yet the response from the FTX leader was notably muted.
“I expected a bigger response. But all [SBF] said was, Got it. He didn’t seem surprised,” Sun remarked about Bankman-Fried’s calm reaction.
Sun recalled SBF asking him to provide a “legal justification” for the missing billions after a private equity firm inquired. “No. He did not tell me anything,” answered Sun when asked if SBF explained the transfers.
Under cross-examination, SBF’s attorney Mark Cohen discussed Sun’s FTX employment contract showing .5 million in loans and bonuses from Alameda Research. Questioned if connected, Sun stated, “Well they were both about my employment.”
Sun conceded to signing a non-prosecution agreement with prosecutors requiring truthful testimony. “You could be prosecuted if you don’t tell the truth?” Cohen inquired. Sun responded with a succinct “yes.” SBF’s attorney also pressed Sun on whether encrypted messaging apps were used by the legal department.
Sun’s testimony follows former FTX and Alameda executives Caroline Ellison, Gary Wang and Nishad Singh cooperating with prosecutors after pleading guilty. Bankman-Fried potentially faces over 100 years in prison if convicted of fraud and conspiracy charges, for which he has pleaded not guilty.
What do you think about the testimony from Sun and the billion missing? Share your thoughts and opinions about this subject in the comments section below.
Stablecoin Economy Sheds $1.52 Billion in September, Revisiting a 2-Year Low

Drawing from the latest figures, the stablecoin economy saw a notable .52 billion in redemptions unfold from September 1 through September 30, 2023. Within the top ten standings, two stablecoins notably bore the brunt of these redemptions: FRAX and BUSD. The two assets saw their supplies erode by 16.9% and 26.4% respectively, over the span of 30 days.
.52 Billion Evaporates from Stablecoin Realm in 30 Days
The realm of fiat-pegged cryptocurrencies, predominantly comprised of USD-backed stablecoins, has persevered in its trajectory of contraction, hovering just above the 3 billion benchmark as of September 30, 2023.
A glimpse at archived figures unveils that a mere 30 days earlier, on the first day of September, the stablecoin economy boasted a much larger valuation of 4.57 billion. This underscores that across the stretch of September, a cumulative value of .52 billion was wiped off the slate.
Tether’s supply nudged 0.5% upward in September, rounding off the month with an appraisal of .22 billion. As the largest stablecoin by market capitalization, tether (USDT) encapsulates 67.65% of the 3 billion stablecoin market.
The runner-up in the stablecoin arena, usd coin (USDC), documented a 4% reduction over the preceding 30 days, now boasting a market cap of .10 billion. Makerdao’s DAI experienced a 2% contraction, bringing the coin’s valuation to .81 billion.
Trueusd’s (TUSD) supply grew by 18.6% over the previous month, hitting the .44 billion mark, and among the five leading stablecoins, TUSD clinched the title of the largest riser.
Trailing next on the list, BUSD found itself on the flip side as a substantial 26.4% of its supply vanished, leaving it precariously perched just above the billion threshold with a valuation of .25 billion.
In September, Tron’s USDD inched up by 0.6%, with its market cap nestling just shy of the billion-dollar milestone at 6.87 million. Over the same span, Frax Dollar’s (FRAX) supply took a 16.9% tumble, dwindling to 9.65 million.
Pax Dollar (USDP) too felt the squeeze, shedding 3.8% of its supply. As the stablecoin economy cruises at 3 billion, the market finds itself at a low not seen since September 2021, rewinding the clock by two years.
What do you think about the stablecoin economy losing .52 billion in September? Share your thoughts and opinions about this subject in the comments section below.