 PRESS RELEASE. UXLINK, a leading Web3 social platform and infrastructure provider, has reported a significant increase in profits, driven by its innovative business model and expanding ecosystem. For Users: UXLINK offers a platform where users can socially discover, participate in, and trade crypto assets through group interactions. This approach enhances user engagement and community building. […]
Bitcoin News
Bitcoin Miner Rewards Shrink Below Pre-Halving Levels as Network Fees Fall Sharply
 After experiencing a period of high fees, onchain transfer costs on the Bitcoin network have decreased significantly. On Friday, the fees peaked at 0 per transaction, but by now they have fallen to just .06 each. Since reaching block height 840,179, miners are now earning less bitcoin in rewards compared to before the halving event […]
Bitcoin News
Grayscale’s Bitcoin Trust Discount to NAV Narrows Sharply to a 16.59% Gap

Grayscale’s Bitcoin Trust, known as GBTC, has witnessed a significant shift in its market dynamics. In January 2023, GBTC traded at a significant 48.31% discount to its net asset value (NAV). Today, that gap has narrowed to 16.59%, indicating changes in market sentiment and presenting potential implications for investors.
End of 2023 Sees GBTC’s Discount to NAV Tighten
The largest bitcoin (BTC) trust known as GBTC has seen a significant improvement in terms of its previous discount to NAV. Essentially, net asset value (NAV) serves as a financial barometer, indicating the per-share value of a fund’s underlying assets. In the context of GBTC, the NAV represents the value of BTC it holds, adjusted for liabilities, and divided by its outstanding shares. Simply put, it’s a measure of what each GBTC share should theoretically be worth based on bitcoin’s market value.

GBTC’s market price can deviate from its NAV, leading to either a discount or premium status. When GBTC trades at a higher price than its NAV, it’s at a premium. Conversely, if it trades lower than its NAV, it’s at a discount. This percentage difference provides insights into market perceptions and investor sentiment around GBTC. Since the end of February 2021, GBTC has traded at a discount to its NAV. Unlike traditional stocks, GBTC doesn’t offer an easy way to redeem shares for actual bitcoin, and shares are traded over-the-counter (OTC).
This structure can cause its market price to diverge from the underlying BTC value. External factors, such as investor sentiment, market speculation, regulatory news, and liquidity considerations, can further influence this price disparity. A 48.31% discount in January 2023 meant GBTC shares were trading significantly below the value of the bitcoin they represented. Investors could have been acquiring bitcoin exposure via GBTC at a bargain.
Fast forward to the present, and the discount has reduced to 16.59%, suggesting a change in market dynamics and a potential increase in demand for GBTC shares. The shrinking discount implies a potential positive shift in GBTC’s market sentiment. For investors, buying GBTC at a discount might seem like a lucrative deal, as they gain exposure to BTC at a reduced price. However, the future remains uncertain, and there’s no guarantee that the discount will continue to narrow at the same pace or even flip to a premium.
At the moment, Grayscale is fervently working to persuade the U.S. Securities and Exchange Commission (SEC) to transform GBTC into an exchange-traded fund (ETF). With a nudge from the judiciary, Grayscale has carved out a bit of wiggle room in this endeavor, but the outcome is still hanging in the balance. Simultaneously, the SEC is sifting through more than half a dozen spot bitcoin ETF proposals from industry giants such as Fidelity, Blackrock, and Franklin Templeton.
What do you think about GBTC’s discount tightening? Share your thoughts and opinions about this subject in the comments section below.
Bitcoin Price Corrects Sharply But This Support Might Spark Another Increase
Bitcoin price rallied and even spiked above the ,000 resistance. BTC corrected lower, but the bulls are active above the ,000 support zone.
- Bitcoin started a strong increase above the ,500 resistance zone.
- The price is trading above ,000 and the 100 hourly simple moving average.
- There is a key bullish trend line forming with support near ,750 on the hourly chart of the BTC/USD pair (data feed from Kraken).
- The pair could start a fresh increase if it stays above the ,000 support zone.
Bitcoin Price Rejects .5K
Bitcoin price started a strong increase above the ,000 resistance zone. BTC even surpassed the ,000 resistance to move further into a positive zone.
Finally, the price spiked above the ,000 and ,200 resistance levels. A high was formed near ,526 before there was a sharp downside correction. The price declined heavily below the ,000 and ,500 levels. It traded close to the ,000 support zone.
A low is formed near ,051 and the price is now rising. Bitcoin price is trading above ,000 and the 100 hourly simple moving average. There is also a key bullish trend line forming with support near ,750 on the hourly chart of the BTC/USD pair.
An immediate resistance is near the ,300 level. It is near the 50% Fib retracement level of the recent decline from the ,526 swing high to ,051 low.
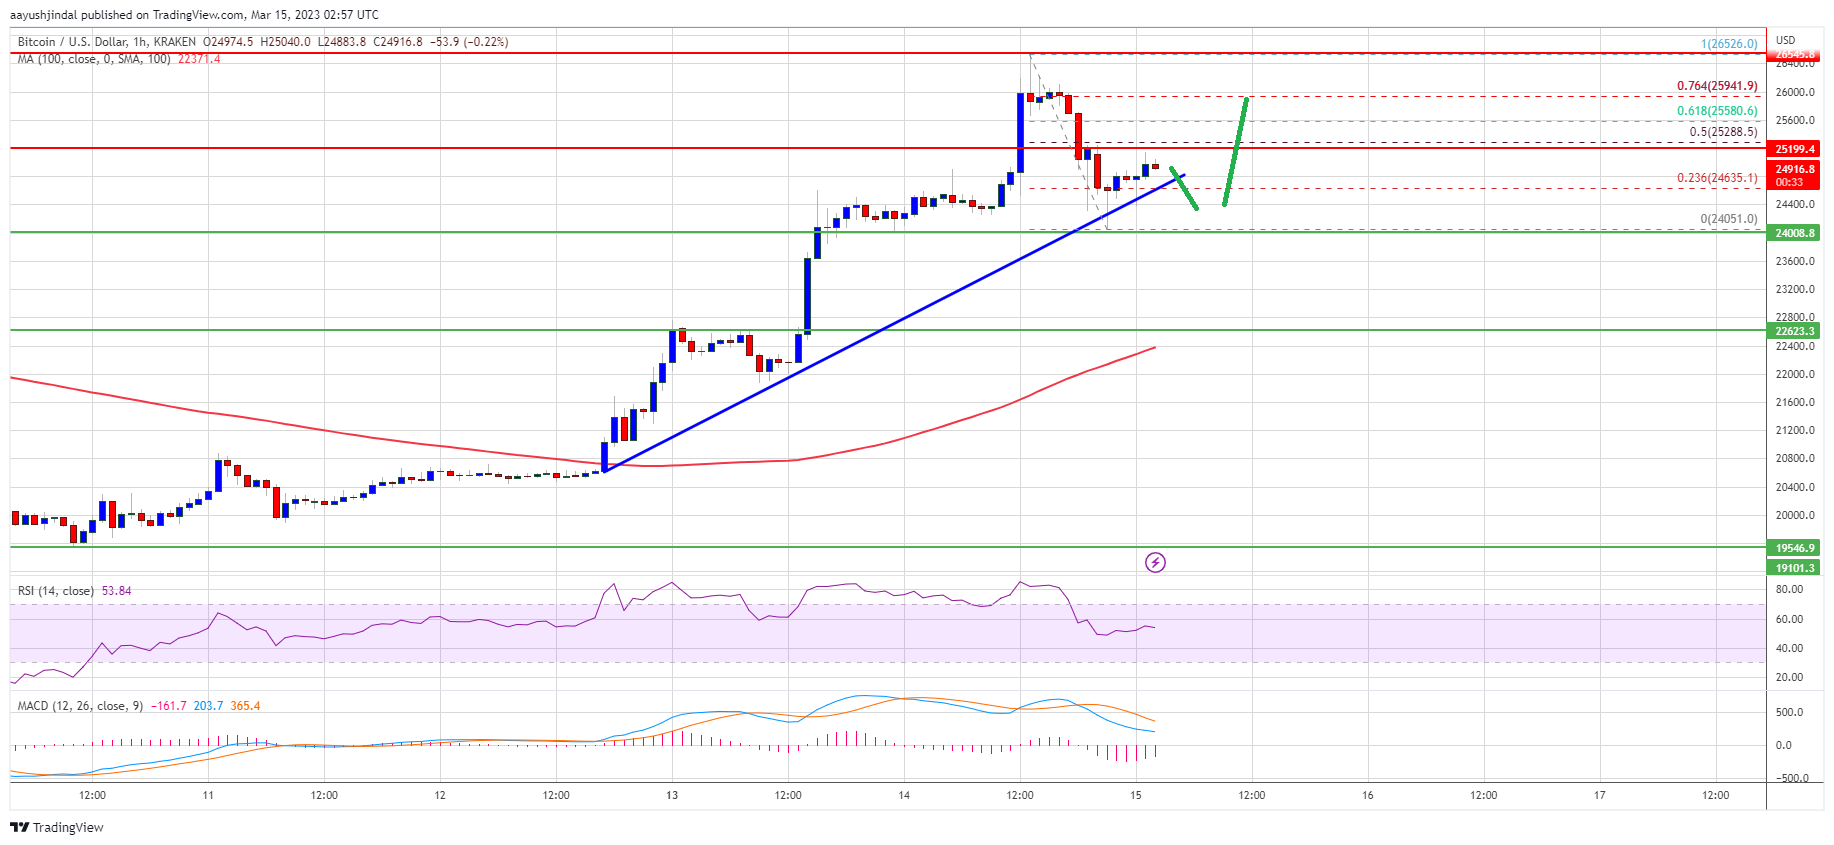
Source: BTCUSD on TradingView.com
The next major resistance is near the ,600 zone. It is near the 61.8% Fib retracement level of the recent decline from the ,526 swing high to ,051 low. A close above the ,600 resistance might start a fresh increase towards the ,000 resistance. The next key resistance is near the ,500 zone, above which the price might gain bullish momentum and test ,500.
Dips Limited in BTC?
If bitcoin price fails to clear the ,300 resistance, it could start another decline. An immediate support on the downside is near the ,750 zone and the trend line.
The next major support is near the ,000 zone, below which the price gain bearish momentum. The next major support is near the ,200 level. Any more losses might send the price towards the ,500 level and the 100 hourly simple moving average.
Technical indicators:
Hourly MACD – The MACD is now losing pace in the bearish zone.
Hourly RSI (Relative Strength Index) – The RSI for BTC/USD is now above the 50 level.
Major Support Levels – ,750, followed by ,000.
Major Resistance Levels – ,300, ,600 and ,200.
Argentine Peso Loses Almost 12% Against the Greenback During January; Inflation Projected to Rise Sharply
The Argentine peso has fallen consistently against the U.S. dollar this month, losing almost 12% since Jan. 1. The behavior of the exchange rate for the informal “blue” dollar keeps bringing concerns about a possible escalade in inflation rates, that are predicted to reach almost 100% this year, similar to the rates registered in 2022.
Argentine Peso Keeps Falling
Argentina is currently submerged in a devaluation scenario that has the possibility of causing an escalation in prices this year. The value of the Argentine peso against the U.S. dollar has fallen by almost 12%, reaching a record-high rate of 386 pesos per dollar on Jan. 27 in its ‘blue‘ variation.
The exchange rate has been constantly rising since December, when it reached 356 pesos per dollar, breaking a record low for the peso at that time. The government has made movements to maintain its stability, injecting dollars to satisfy the demand of registered importers into the market and announcing a purchase operation of more than billion of its own external debt.
However, this seems to have achieved just the opposite, and now local analysts are worried about the balance of the country’s reserves after this disbursement, which would affect the capabilities of the central bank. María Castiglioni Cotter, head of an economic counseling firm, criticized the measure, stating that it has no sense while the country is facing a budget deficit.
Inflation and the Coming Crises
This continued fall in the value of the Argentine peso is already affecting the prices that citizens have to pay for goods and services, even when the government has applied a series of measures to limit the price rise of several products. Calculations made by private firms predict an inflation rate of more than 5% in January, a high number when compared with countries like Brazil, which is projected to register a rise of less than half a point.
Salvador Di Stefano, another local analyst, believes that the debt purchase operation might accentuate the problems the state is currently facing. Di Stefano stated that this might affect the amount of foreign currency available for imports, causing the economy to slow down even more.
According to him, the dollar will keep falling as the government tries to inject dollars to stop the depreciation of the peso, a similar strategy that president Macri used back in 2018. Also, public spending would accentuate this devaluation, as the government is expected to ramp it up due to the proximity of the elections. Private analysts expect Argentine inflation to reach over 95% this year.
What do you think about the Argentine peso devaluation and its effect on inflation rates? Tell us in the comments section below.
Bitcoin Bullish Signal: Exchange Whale Ratio Sharply Declines
On-chain data shows the Bitcoin exchange whale ratio has sharply declined recently, a sign that may prove to be bullish for the price of the crypto.
Bitcoin 7-Day MA Exchange Whale Ratio Has Rapidly Gone Down Recently
As pointed out by an analyst in a CryptoQuant post, the metric also saw a similar decline during the end of 2018.
The “exchange whale ratio” is an indicator that measures the ratio between the sum of the top ten transactions going to exchanges, and the total exchange inflows.
The ten largest transfers to exchanges are assumed to be coming from the whales. So, this ratio tells us what part of the total exchange inflows is being contributed by these humongous holders right now.
When the value of this metric is high, it means the majority of the inflows are made up by whales currently. Since one of the main reasons investors deposit to exchanges is for selling purposes, such values could be a sign that whales are dumping large amounts, and might hence be bearish for the price of the crypto.
On the other hand, the indicator having low values suggests whales are making a healthier contribution to the inflows, and could thus be either neutral or bullish for the value of BTC.
Now, here is a chart that shows the trend in the 7-day moving average Bitcoin exchange whale ratio over the last few years:
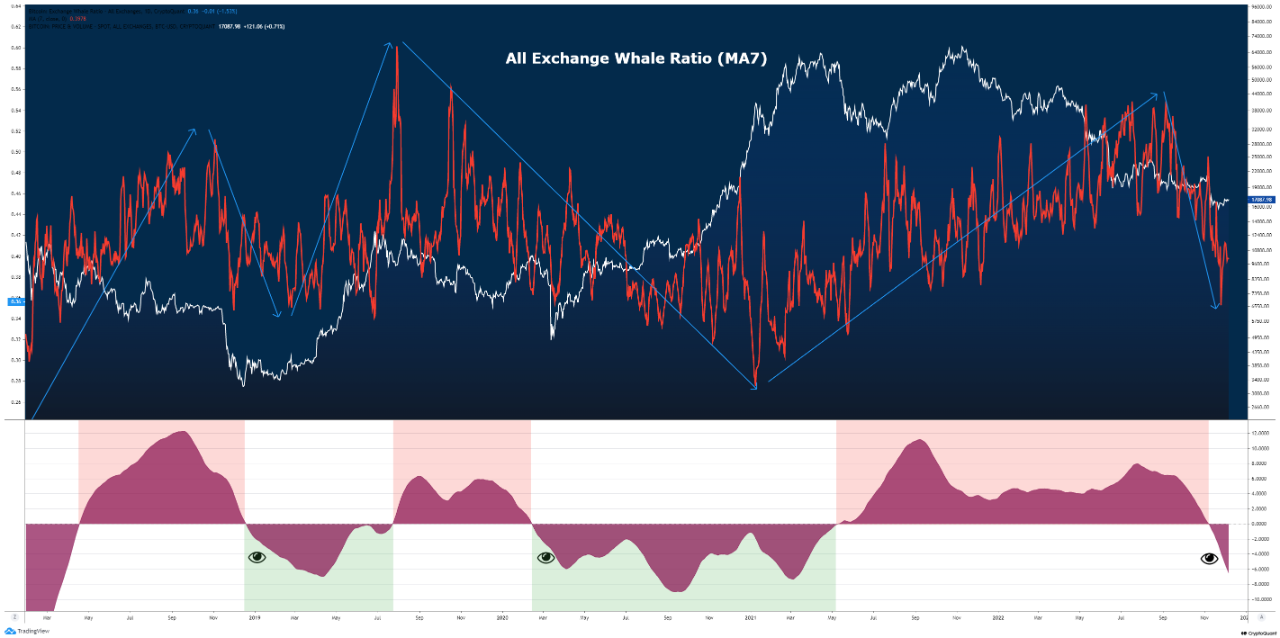
Looks like the 70-day MA value of the metric has been sharply falling off in recent weeks | Source: CryptoQuant
As you can see in the above graph, the Bitcoin exchange whale ratio had a pretty high value just a few months back.
However, since then, the indicator has been observing some rapid downtrend, and the ratio has now attained quite tame values.
This means that whales have been reducing their inflow volumes recently, suggesting that selling pressure from them may be getting exhausted.
The quant has also highlighted the trend in the exchange whale ratio during the previous Bitcoin cycle in the chart. It seems like a similar downtrend as now was also seen back in late 2018, when the bottom of that bear market formed.
The analyst notes that while it’s impossible to say if the current sharp decline in the whale ratio means the bottom is in for this cycle as well, it’s likely that at least the volatility will now begin to cool down.
BTC Price
At the time of writing, Bitcoin’s price floats around .8k, down 1% in the last week.

BTC has declined during the past day | Source: BTCUSD on TradingView
Featured image from Thomas Lipke on Unsplash.com, charts from TradingView.com, CryptoQuant.com
NewsBTC
Bitcoin Reserve On Binance Sharply Rises, Whales Preparing For More Dumping?
On-chain data shows the Bitcoin reserve on Binance has been sharply going up in the last couple of days, something that could be a sign of dumping.
Bitcoin Reserve On The Crypto Exchange Binance Has Observed Sharp Growth In Recent Days
As pointed out by an analyst in a CryptoQuant post, the funding rates have been negative while these inflows have been made.
The “exchange reserve” is an indicator that measures the total amount of Bitcoin currently stored in the wallets of a centralized exchange (which, in this case, is Binance).
When the value of this metric goes up, it means investors are depositing their coins to the exchange right now. As investors could be depositing to such a platform for selling purposes, this kind of trend can have bearish impacts on the price of the crypto.
On the other hand, decreasing value of the reserve suggests coins are exiting the exchange currently. Such a trend, when sustained, can be a sign of accumulation from investors, and could thus be bullish for the BTC value.
Now, here is a chart that shows the trend in the Bitcoin exchange reserve for the crypto exchange Binance during the past month:
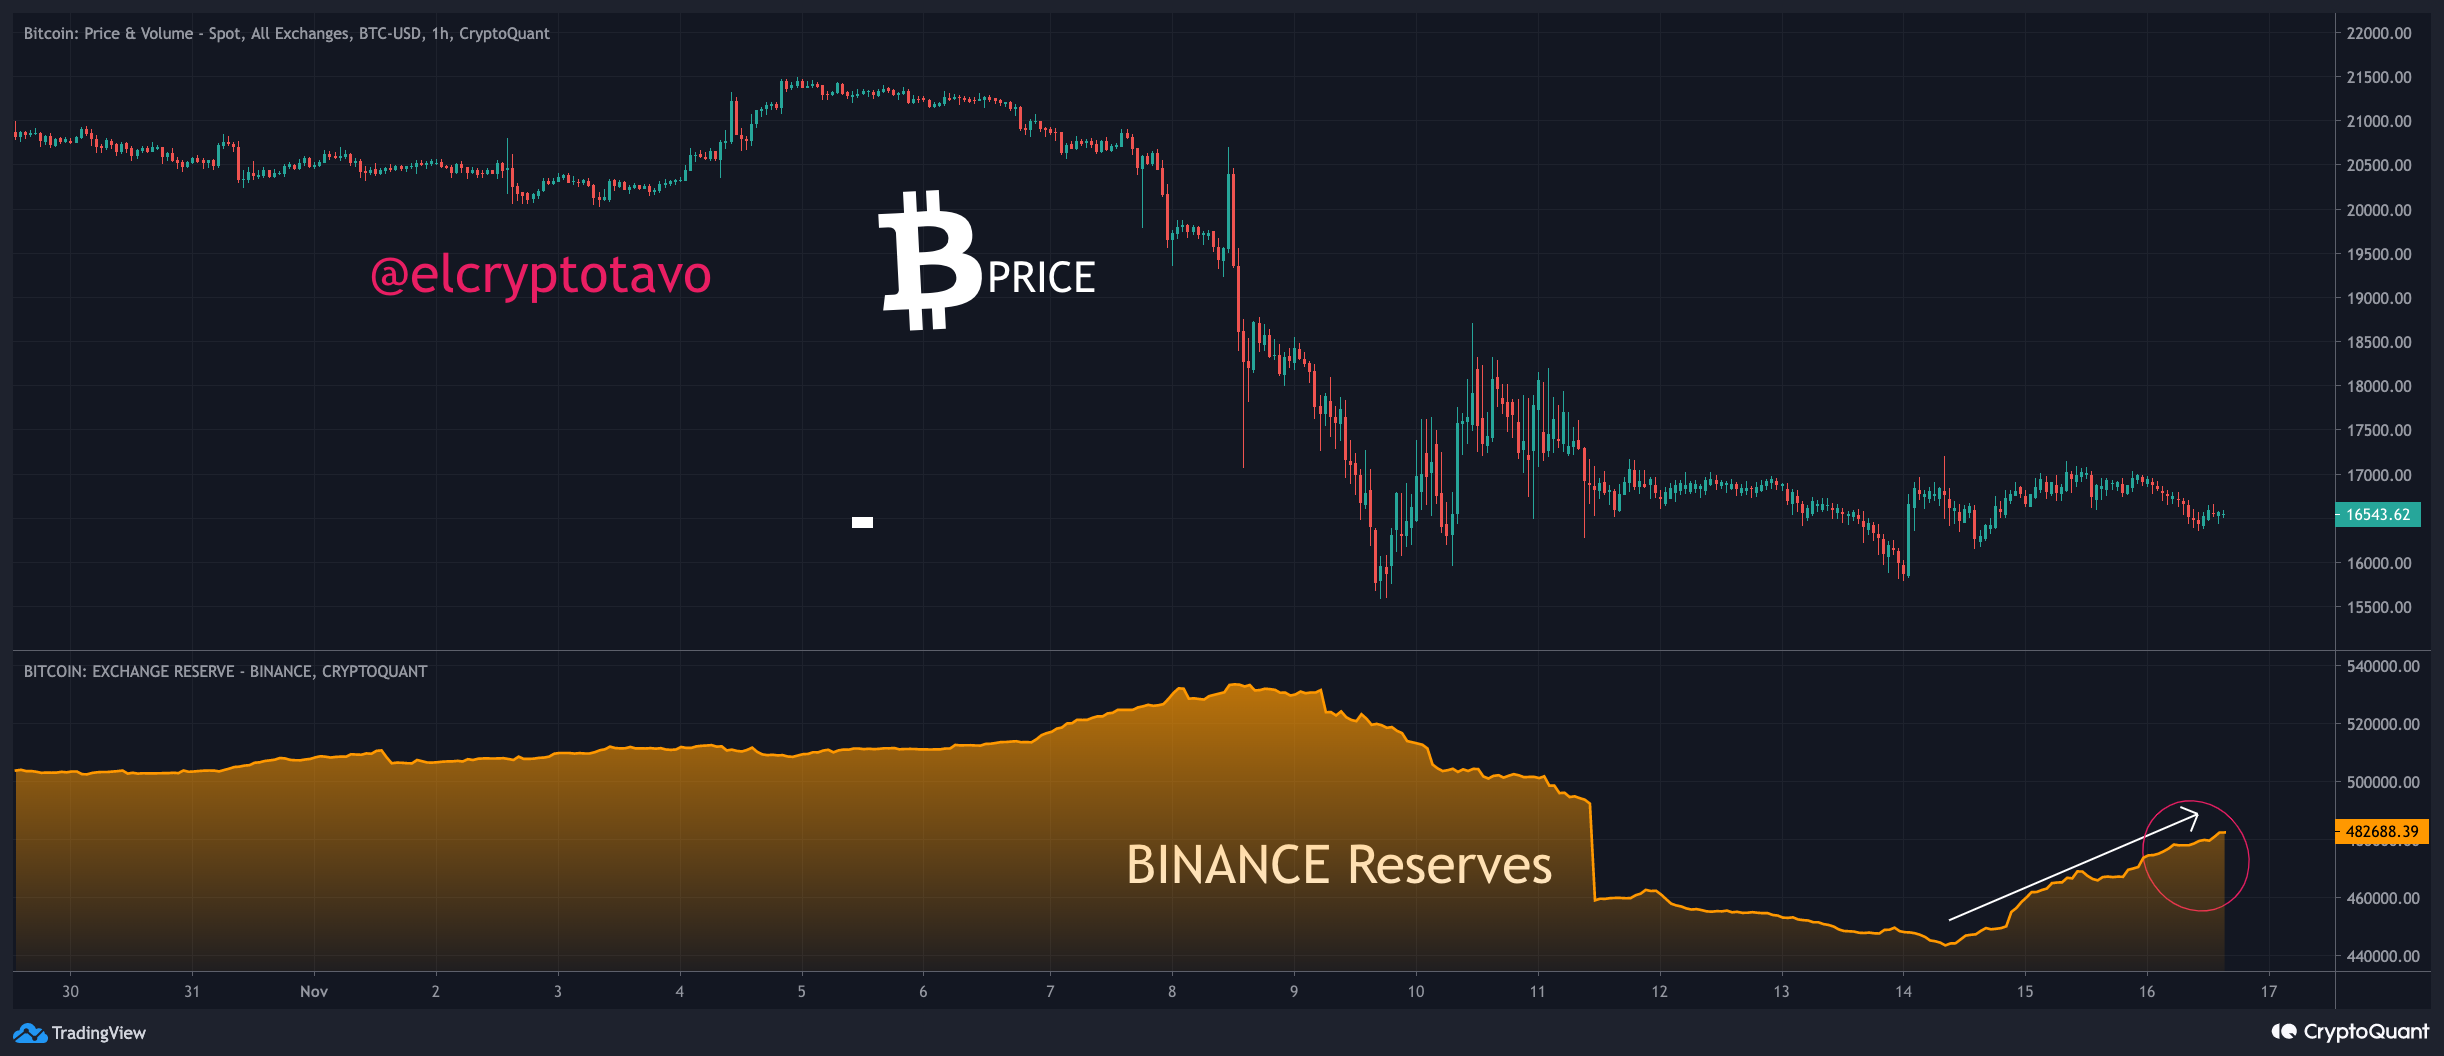
The value of the metric seems to have been riding an upwards momentum in recent days | Source: CryptoQuant
As you can see in the above graph, the Binance Bitcoin exchange reserve started to rapidly fall down around ten days ago as the crash started.
This happened because the collapse of FTX made investors more wary of crypto exchanges than ever before, and so they were withdrawing coins off centralized platforms in hordes.
After seeing a final sharp plunge a little less than a week ago, the indicator started moving sideways. In the past couple of days, however, this trend has changed.
The Binance Bitcoin exchange reserves are now climbing back up quickly, suggesting that investors have been depositing large amounts.
This could be a sign of activity from whales, and would imply that these humongous holders may be preparing to dump.
The quant has also talked about another indicator’s trend, the “Funding Rate,” which tells us whether the futures market is leaning towards shorts or longs right now. The below chart displays the trend in this metric.
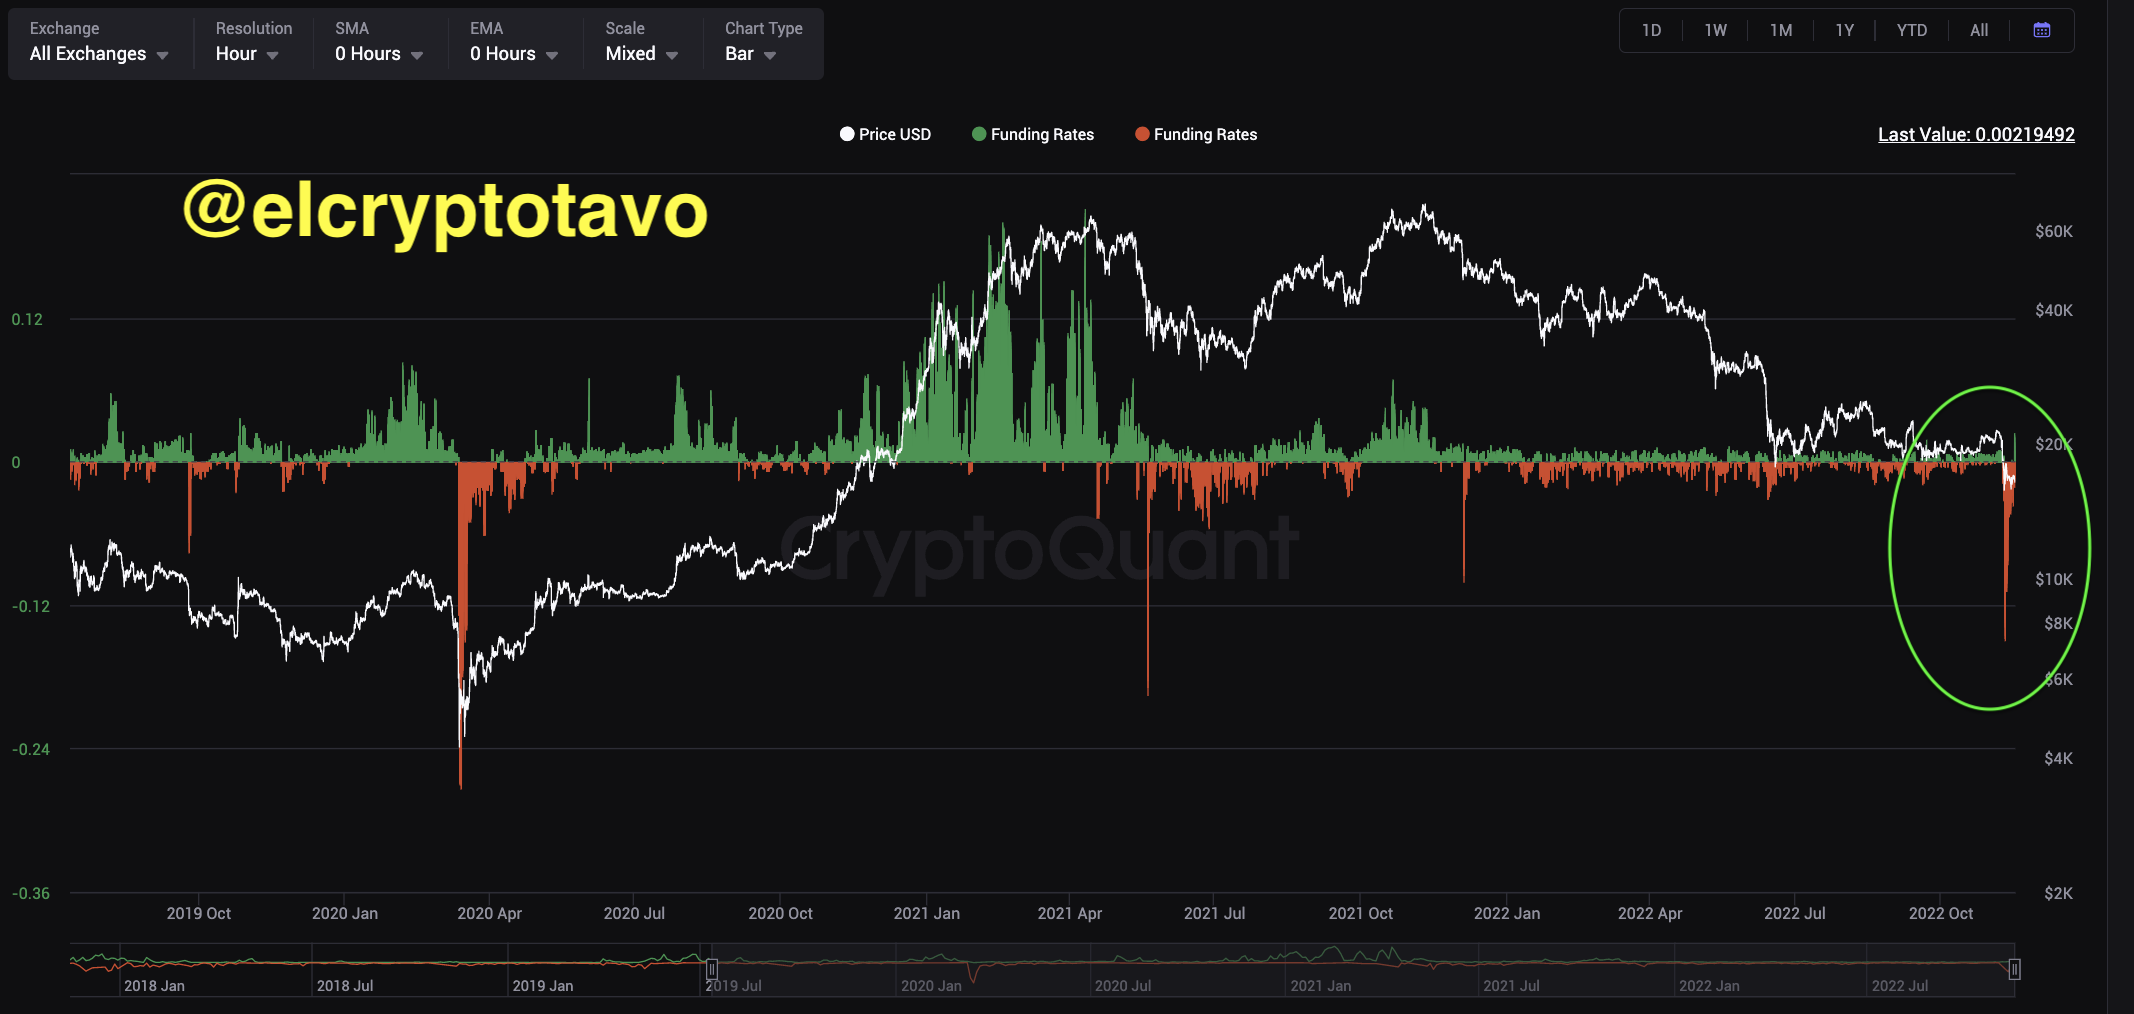
Looks like the metric has a red value currently | Source: CryptoQuant
The funding rates are highly negative at the moment, implying the majority of the contracts are shorts. Based on this the analyst thinks a short squeeze could possibly take place, which would propel the price in the short term.
However, the quant also believes that’s when the whales would potentially make their move, and dump the crypto.
BTC Price
At the time of writing, Bitcoin’s price floats around .5k, down 6% in the last week.

BTC continues to consolidate | Source: BTCUSD on TradingView
Featured image from Rémi Boudousquié on Unsplash.com, charts from TradingView.com, CryptoQuant.com
NewsBTC
TA: Bitcoin Recovers Sharply, Why BTC Could Still Struggle Above $20,500
Bitcoin declined towards the ,500 support zone against the US Dollar. BTC recovered sharply, but the bears are still active near the ,500 and ,650 levels.
- Bitcoin climbed higher sharply after there was a test of the ,500 zone.
- The price is now trading above the ,000 level and near the 100 hourly simple moving average.
- There is a major bearish trend line forming with resistance near ,400 on the hourly chart of the BTC/USD pair (data feed from Kraken).
- The pair could start a fresh decline unless there is a move above the ,500 resistance zone.
Bitcoin Price Eyes Upside Break
Bitcoin price started another decline below the ,000 support zone. The price even traded below the ,200 support zone and spiked below the ,800 level.
There was a test of the ,600 zone and the price traded as low as ,617. Recently, there was a sharp upward move and the price climbed above the ,500 resistance. There was a move above the 50% Fib retracement level of the key drop from the ,697 swing high to ,617 low.
However, the price is now facing a strong resistance near the ,500 zone and the 100 hourly simple moving average. There is also a major bearish trend line forming with resistance near ,400 on the hourly chart of the BTC/USD pair.
The trend line is close to the 61.8% Fib retracement level of the key drop from the ,697 swing high to ,617 low. An immediate resistance on the upside is near the ,500 level.
Source: BTCUSD on TradingView.com
The next key resistance is near the ,950 zone. A clear move above the trend line resistance and then ,950 could push the price further higher. In the stated case, the price could rise towards the ,650 level. The next major resistance sits near the ,500 level.
Fresh Decline in BTC?
If bitcoin fails to clear the ,500 resistance zone, it could start another decline. An immediate support on the downside is near the ,000 level.
The next major support now sits near the ,800 level, below which the price could decline heavily. In the stated case, the price may perhaps decline towards the ,500 level.
Technical indicators:
Hourly MACD – The MACD is now gaining pace in the bullish zone.
Hourly RSI (Relative Strength Index) – The RSI for BTC/USD is now above the 50 level.
Major Support Levels – ,000, followed by ,800.
Major Resistance Levels – ,500, ,950 and ,650.
Tron Falls Sharply As Sun Scrambles To Save Stablecoin
Tron price momentum faded over the weekend, and the price has dropped by more than 40% since then. The cryptocurrency is presently having difficulty gaining traction.
Tron Falls AS USDD Depegs
TRX has dropped 19% and is now trading at .05, its lowest level in 15 months. In the last 24 hours, the token has also been the worst performer among the top 50 cryptocurrencies.
The token’s weakness follows the loss of the USDD algorithmic stablecoin’s dollar peg, despite founder Justin Sun’s repeated efforts to keep the peg.
In the last 24 hours, the token’s entire market valuation has dropped by nearly 1% to 1.4 million. The token has garnered comparisons to Terra’s UST stablecoin, which vanished in May due to its algorithmic nature.
USDD/USDT breaks dollar peg. Source: TradingView
Fear began as soon as the USDD’s 1:1 peg to the dollar was lost. TRX hasn’t been able to reverse the downward trend since then, plummeting by more than 40% in less than a week. TRX may face tremendous sell pressure to close the gap as long as USDD is below one dollar.
TRX has found support at the .05 level, from which it has bounced higher. TRX’s resistance is at .057, and given the current fundamentals, it doesn’t appear likely that the trend will shift.
Related reading | TRON Has a Record-Setting Month
Justin Sun Scrambles To Save USDD
However, Tron, like Terra, is putting billions of dollars behind the coin. Because USDD is not as large as UST, which was worth roughly billion at its peak, crypto specialists think that it will not suffer the same fate.
USDD had recently been changed by Tron’s Sun to strengthen collateralization and make it less vulnerable to a crash like Terra.
This week, Tron spent over 0 million on the open market to sustain the USDD peg. Justin Sun also stated that a .5 billion fund would be set up to help TRX.
Tron has purchased TRX on multiple occasions to support the token, most notably withdrawing 8 million ( million) from Binance. The Tron DAO has made a number of withdrawals from Binance and has also used its USDC assets to purchase more tokens.
Tron has also announced a mining pool with Curve Finance and Convex Finance, which is intended to attract yield-hungry traders with an estimated APR of 96.25%.
Despite Justin Suns’ assertions that the USDD is unduly collateralized, the market does not appear to agree. The trend for TRX is likely to be negative as long as this continues, and the next significant support is identified at .040.
Related reading | Why TRON Has Seen a 45% Hike in Total Value Locked (TVL)
Featured image from Pixabay, chart from TradingView.com
NewsBTC
Ethereum Bearish Signal: Netflows Turn Sharply Positive
On-chain data shows the Ethereum netflows are sharply turning positive, a sign that could prove to be bearish for the crypto.
Ethereum Exchange Reserve Rises As Netflows Become Positive
As pointed out by an analyst in a CryptoQuant post, exchanges have observed net ETH inflows recently, swelling up their reserves.
The “all exchanges netflow” is an indicator that measures the net amount of Ethereum moving into or out of wallets of all exchanges. The metric’s value is calculated by taking the difference between the inflows and the outflows.
When the value of the indicator is positive, it means exchanges are getting more inflows right now than outflows. Such a trend can be bearish for the price of the coin as investors usually deposit their ETH to exchanges for selling purposes.
On the other hand, negative netflow values imply that outflows are currently overwhelming the inflows. Sustained such values can be bullish for Ethereum as it may be a sign of accumulation.
Related Reading | Here Are Two Scenarios For Bitcoin A Month Prior To FED Announcing Possible Interest Rate Hike
Now, here is a chart that shows the trend in the ETH netflows over the past year:
Looks like the indicator’s value has recently risen above zero | Source: CryptoQuant
As you can see in the above graph, the Ethereum netflows have sharply increased to positive values in the past couple of weeks.
The effect of these net inflows can be seen through the exchange reserve indicator, which measures the total amount of ETH sitting on exchanges. Below is the chart for it.
The indicator seems to have surged up recently | Source: CryptoQuant
As the graph shows, the Ethereum exchange reserve has sharply increased in value in the past week. Which is expected, as the netflows have been positive lately.
Related Reading | Bitcoin Option Traders Seem Doubtful At Entering Directional Trades
The exchange reserve is often called the “sell supply” of the crypto. If the trend continues and the reserve keeps on going up, the near term outlook may be bearish for the price of the coin.
ETH Price
At the time of writing, Ethereum’s price floats around k, down 6% in the last seven days. Over the past month, the coin has parted with 8% in value.
The below chart shows the trend in the price of the crypto over the last five days.
The price of ETH seems to have dipped down over the past twenty-four hours | Source: ETHUSD on TradingView
Ethereum’s price had surged up to almost .2k a couple of days back, but has since come back down a bit to the current levels. At the moment, it’s unclear when the coin may show further recovery.
Featured image from Unsplash.com, charts from TradingView.com, CryptoQuant.com
NewsBTC