 Fundstrat’s head of research, Thomas Lee, has doubled down on his bitcoin price prediction of 0K by year-end, post Mt. Gox distribution. He expects “a pretty sharp rebound” for bitcoin in the second half of this year, citing the resolution of the Mt. Gox overhang, potential easing of Federal Reserve policies, and the impact of […]
Bitcoin News
Shiba Inu Sees Sharp 100% Decline In Whale Activity, Is This Good Or Bad For Price?
On-chain data shows that Shiba Inu (SHIB) has witnessed a massive decline in whale activity. This is significant for the meme coin’s ecosystem, considering the impact these investors usually have on Shiba Inu’s price.
Shiba Inu’s Whale Activity Declines By Over 100%
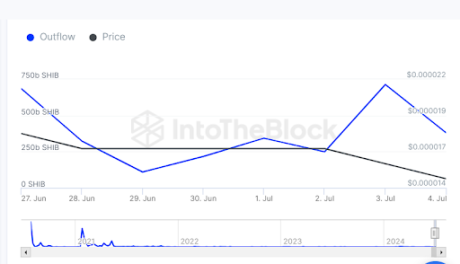
Data from the market intelligence platform IntoTheBlock shows that Shiba Inu’s whale activity has declined by over 100% in the last seven days. This is based on the large holders’ netflow metric, which indicates when these whales are adding to their positions or offloading their tokens.

The 100% decline in large holders’ netflow points to these whales opting against accumulating and selling their Shiba Inu tokens instead. The large holders’ outflow metric also points to these whales offloading their tokens, as there has been an 18% increase in the amount of Shiba Inu tokens leaving these whales’ addresses in the last seven days.
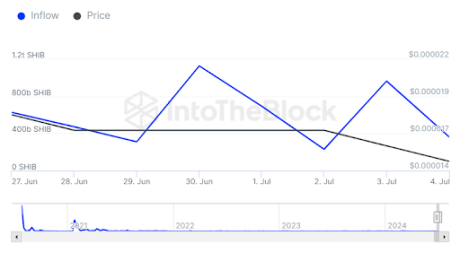
Meanwhile, in the same period, there has been an almost 23% drop in the large holder inflows, which suggests that more whales are opting against adding their Shiba Inu positions. This is evidently bad for the Shiba Inu ecosystem as significant selling pressure from these whales could further make the meme coin’s price tumble.
Other on-chain metrics also paint a bearish outlook for the meme coin. For instance, data from IntoTheBlock shows that the ‘In The Money’ metric is bearish, as 52.46% of Shiba Inu addresses are currently at a loss. This could pile more selling pressure on the meme coin as more investors look to cut their loss, fearing that Shiba Inu could further decline from its current price level.
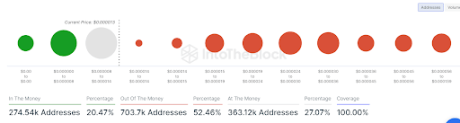
Shiba Inu also risks losing most of the gains it made earlier this year if it fails to hold above its current support level. The In the Money metric shows that most addresses currently invested in Shiba Inu bought the meme coin at its current price range. As such, a decline below this range could send the crypto token on a free fall to levels not seen in a while.
Bitcoin Making Matters Worse For Shiba Inu
Data from IntoTheBlock shows that Shiba Inu has a strong positive price correlation with Bitcoin. This has also significantly contributed to the downtrend that the meme coin is currently facing. SHIB’s price correlation with Bitcoin seems to be why the second-largest meme coin by market cap has been one of the most affected since the flagship crypto dropped below its crucial support level at ,000.
Shiba Inu’s price correlation with Bitcoin suggests that things could get worse for the meme coin. The flagship crypto is still facing intense selling pressure and is at risk of further price declines in the coming days.
SHIB is currently trading at around .00001327, down over 14% in the last 24 hours, according to data from CoinMarketCap.
Ethereum Faces Sharp Decline As ETH Targets $3,051 Support Level
Ethereum (ETH) is experiencing a significant downturn, with its price rapidly approaching the crucial support level of ,051. This sharp decline highlights increased selling pressure and growing bearish sentiment in the market.
As Ethereum nears this critical threshold, traders are closely monitoring its behavior for signs of either a stabilization or a further drop. The ,051 support level is now a focal point, determining the short-term direction of Ethereum’s price action and potentially setting the stage for future movements in the cryptocurrency market.
This article aims to analyze the sharp decline affecting the digital asset and its impact on the cryptocurrency’s price as it approaches the ,051 support level. It also seeks to provide traders and investors with a comprehensive understanding of the current situation, potential scenarios if the support level holds or breaks, and strategies for managing risk in this volatile environment.
ETH’s price is currently trading at around ,181 and down by 5.05% with a market capitalization of over 2 billion and a trading volume of over billion as of the time of writing. In the past 24 hours, there has been a decrease of 5.25% in ETH’s market capitalization and a 74.43% increase in trading volume.
Technical Indicators Pointing To A Decline For Ethereum
A technical analysis of ETH’s price action on the 4-hour chart reveals that the crypto asset is actively bearish and trading below the 100-day Simple Moving Average (SMA). Ethereum has been consistently bearish since after breaching the ,360 mark and is currently heading toward the ,051 support level.
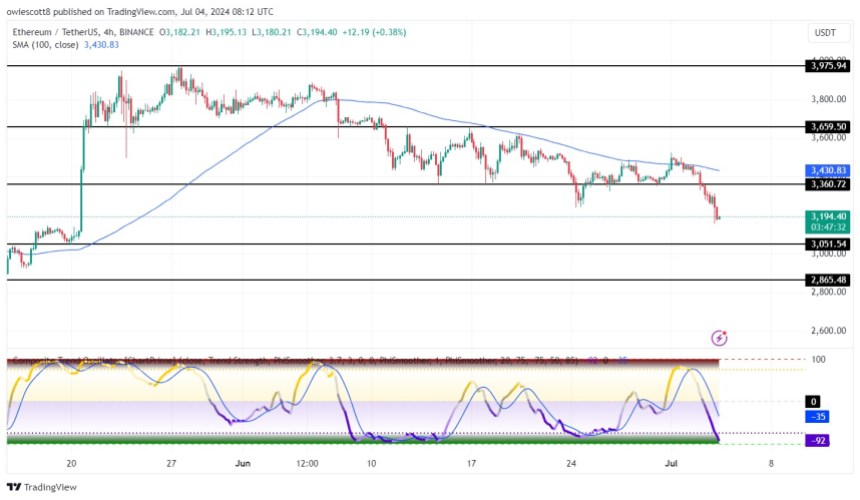
Also, an analytical view of the 4-hour Composite Trend Oscillator shows that the price of ETH may continue its bearishness as both the signal line and the SMA of the indicator have dropped below 50% and are attempting a move into the oversold zone.
On the 1-day chart, the crypto asset has made a sharp drop below the 100-day SMA and is attempting a break below the bullish trend line while dropping toward the ,051 support level.
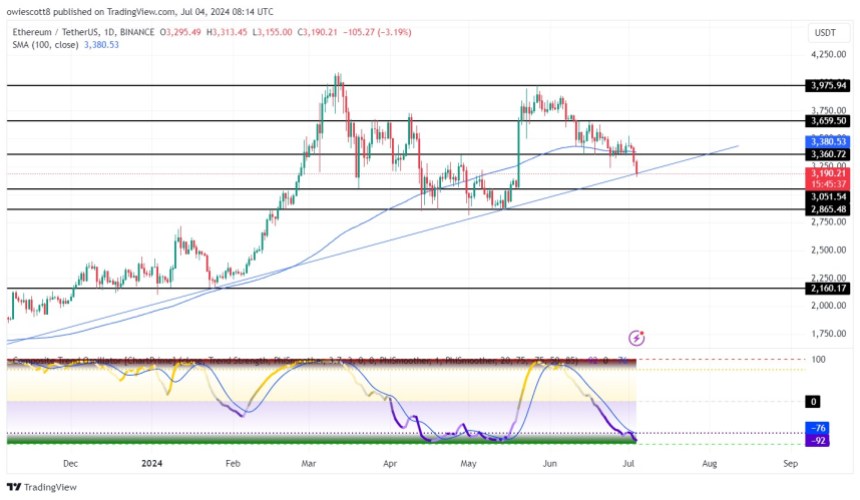
Finally, on the 1-day chart, the composite trend oscillator indicates a further bearish move of ETH as the signal and the SMA of the indicator are both trending in the oversold zone.
What If ,051 Support Fails?
Analyzing potential outcomes if Ethereum breaks through the ,051 support level reveals that if the digital asset breaks below this level, it may move lower to test the ,865 support level and probably move on to test the ,160 support level and other levels below if the price breaches this level.
However, if the price of Ethereum faces rejection at the ,051 support level, it will begin to ascend toward the ,360 resistance level. Should the asset breach this level, it may continue to climb to test the ,659 resistance level and possibly move on to test other higher levels if it breaches the ,659 level.
Bitcoin Dives, Breaks $60K: Market Reels From Sharp Decline
Bitcoin price gained bearish momentum and traded below ,000. BTC is signaling a short-term downtrend and might face hurdles near ,000.
- Bitcoin started a fresh decline from the ,550 resistance level.
- The price is trading below ,500 and the 100 hourly Simple moving average.
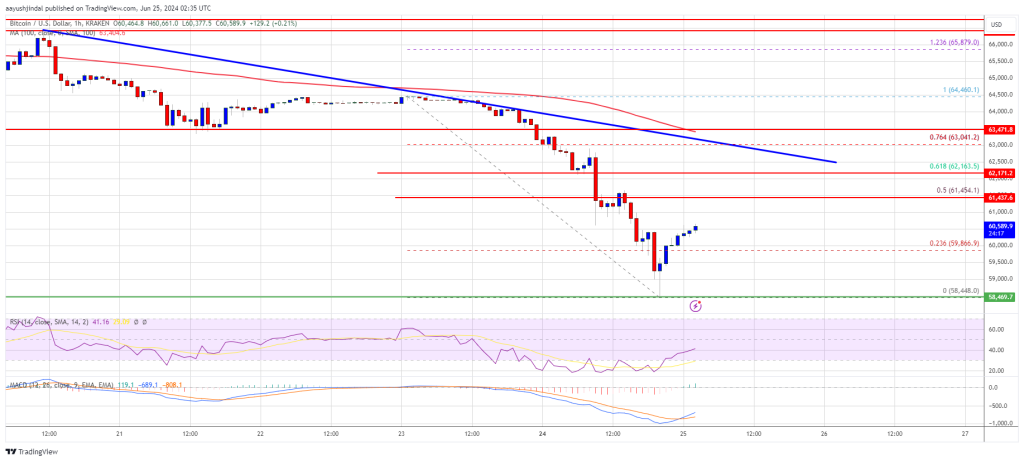
- There is a key bearish trend line forming with resistance at ,400 on the hourly chart of the BTC/USD pair (data feed from Kraken).
- The pair could correct higher, but upsides might be limited above the ,000 resistance zone.
Bitcoin Price Nosedives
Bitcoin price failed to recover above the ,500 level. BTC struggled above ,000 and started another decline. There was a strong decline below the ,000 and ,500 levels.
The price even declined below the ,000 level. A low was formed at ,448 and the price is now correcting losses. There was a minor increase above the ,800 level. The price climbed above the 23.6% Fib retracement level of the downward move from the ,460 swing high to the ,448 low.
Bitcoin price is now trading below ,500 and the 100 hourly Simple moving average. If there is a recovery wave, the price could face resistance near the ,500 level.
The first major resistance could be ,150 or the 50% Fib retracement level of the downward move from the ,460 swing high to the ,448 low. The next key resistance could be ,500. There is also a key bearish trend line forming with resistance at ,400 on the hourly chart of the BTC/USD pair.
A clear move above the ,500 resistance might start a steady increase and send the price higher. In the stated case, the price could rise and test the ,500 resistance. Any more gains might send BTC toward the ,000 resistance in the near term.
Another Drop In BTC?
If Bitcoin fails to climb above the ,500 resistance zone, it could continue to move down. Immediate support on the downside is near the ,200 level.
The first major support is ,000. The next support is now forming near ,500. Any more losses might send the price toward the ,000 support zone in the near term.
Technical indicators:
Hourly MACD – The MACD is now gaining pace in the bearish zone.
Hourly RSI (Relative Strength Index) – The RSI for BTC/USD is now below the 50 level.
Major Support Levels – ,200, followed by ,000.
Major Resistance Levels – ,150, and ,500.
Solana Sees Sharp Decline To $146, Will SOL Overcome Latest Hurdles?
SOL, the native token of Solana, a leading blockchain platform renowned for its high-speed transactions and innovative technology, is currently facing significant price hurdles. As the cryptocurrency market experiences volatility, Solana’s price has encountered resistance levels that pose challenges to its bullish trajectory. Investors and analysts are closely watching these developments, trying to gauge what lies ahead for SOL.
This article explores the current price hurdles facing Solana, delves into future outlooks, and offers predictions on how these obstacles could impact its market performance. Understanding these dynamics is crucial for investors seeking to navigate the uncertain terrain of Solana’s price movements.
As of the time of writing, SOL has a market capitalization of over billion, a trading volume of over .3 billion, and a price drop of 5.40%, trading at around 6 over the past 24 hours. Despite the price decline, its market capitalization and trading volume increased by 0.64% and 40.90%, respectively.
Current Market Analysis For Solana
Currently, on the 4-hour chart, the price of SOL after attempting to move upward has begun to drop again with two bearish candlesticks dropped. Also, Solana is trading below the 100-day Simple Moving Average (SMA) indicating that the price might remain bearish.
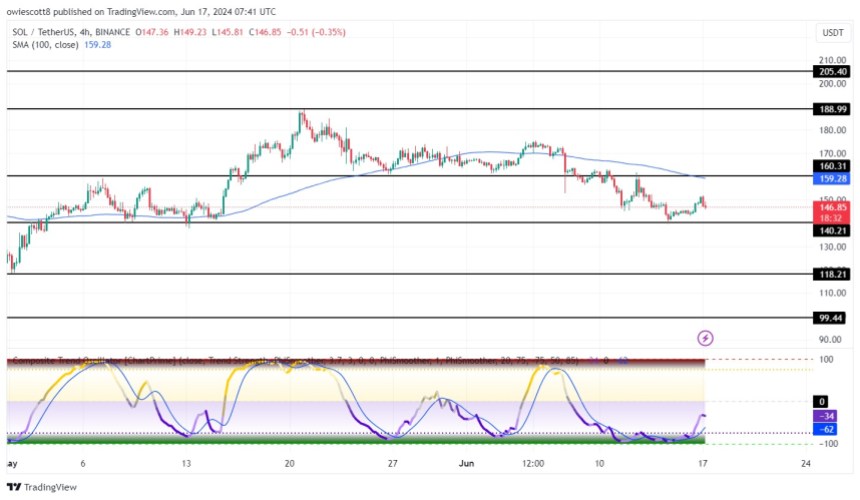
Although the composite trend oscillator indicator on the 4-hour chart indicates that SOL’s price may move upward as both the signal line and the SMA of the indicator are heading toward the zero line, it should be noted that this is only a short-term measure because the price will eventually drop even further.
Meanwhile, on the 1-day chart, it can be observed that Solana is bearish as it is trading below the 100-day SMA and also attempting to drop a bearish candlestick with strong momentum.
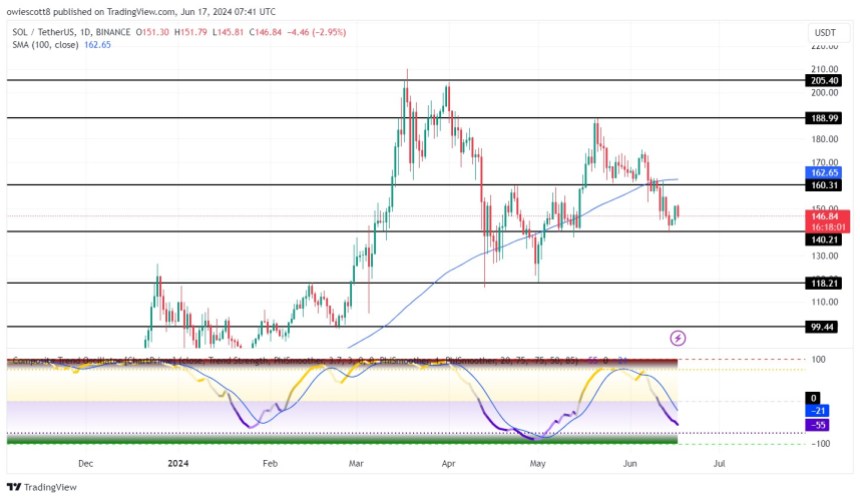
Also, the signal line and SMA of the 1-day composite trend oscillator have broken below the zero line and are moving toward the oversold zone, which suggests that the price of SOL may move very bearish.
Expert Opinions On SOL’s Price Outlook
As of right now, Solana’s price is moving downward toward the 0 support level. If SOL breaks below this level, it will continue to move downward to test the 8 support level and may move on to challenge the support level if it breaks below the 8 level.
Nonetheless, prices may begin to increase in the direction of the 0 resistance level if it is unable to cross any of the previously mentioned levels. If it breaks above this 0 level, it will continue to rise and challenge the resistance level at 8. Furthermore, should SOL break above this level, it can also see a higher price move to challenge the 5 resistance level on the chart.
Hulk Hogan’s X Posts Vanish After HULK Meme Token’s Sharp Rise and Fall
 A new meme token, hulkmania (HULK), has recently entered the dynamic world of meme coins. It appears to have garnered attention from the legendary wrestler Hulk Hogan’s X account, which referenced it on the social media platform. However, the post on the @hulkhogan X account has been deleted, raising the possibility that his account may […]
Bitcoin News
Bank of Canada Governor Warns of ‘Sharp Correction’ Risks in Markets and ‘System-Wide Stress’
 In his speech on the release of the Financial Stability Report, Tiff Macklem, Governor of the Bank of Canada, sought to emphasize the purported strength of Canada’s financial system while cautioning against ongoing risks that could precipitate a “sharp correction” in markets, potentially leading to widespread financial strain. “Some indicators of financial stress have risen,” […]
Bitcoin News
NFT Sales Dip Over 31% in April; Ethereum, Solana Experience Sharp Declines
 Sales of non-fungible tokens (NFTs) experienced a 31.26% decline in April from the revenues recorded in March. Last month, statistics show that NFT transactions across several markets totaled approximately .15 billion in sales. NFT Revenues Shrink in April, Certain Bitcoin Collections Buck the Trend As April concluded and May commenced, data reveals that NFT sales […]
Bitcoin News
DOT Price (Polkadot) Approaches Key Level: Should Traders Brace for Sharp Drop?
Polkadot (DOT) is showing bearish signs below the resistance against the US Dollar. The price could extend its decline if it fails to stay above .00.
- DOT is gaining pace below the .80 and .00 levels against the US Dollar.
- The price is trading below the .20 zone and the 100 simple moving average (4 hours).
- There is a key bearish trend line forming with resistance at .50 on the 4-hour chart of the DOT/USD pair (data source from Kraken).
- The pair could continue to decline toward the .00 support zone.
Polkadot Price Resumes Drop
After a steady increase, DOT price faced resistance near the .60 zone. It formed a short-term top and started a fresh decline below the .00 level, like Ethereum and Bitcoin.
There was a move below the .20 support zone. A low was formed near .03 and the price is now consolidating losses. It is slowly moving higher above the .35 level and the 23.6% Fib retracement level of the downward move from the .58 swing high to the .03 low.
DOT is now trading below the .00 zone and the 100 simple moving average (4 hours). Immediate resistance is near the .50 level. There is also a key bearish trend line forming with resistance at .50 on the 4-hour chart of the DOT/USD pair.
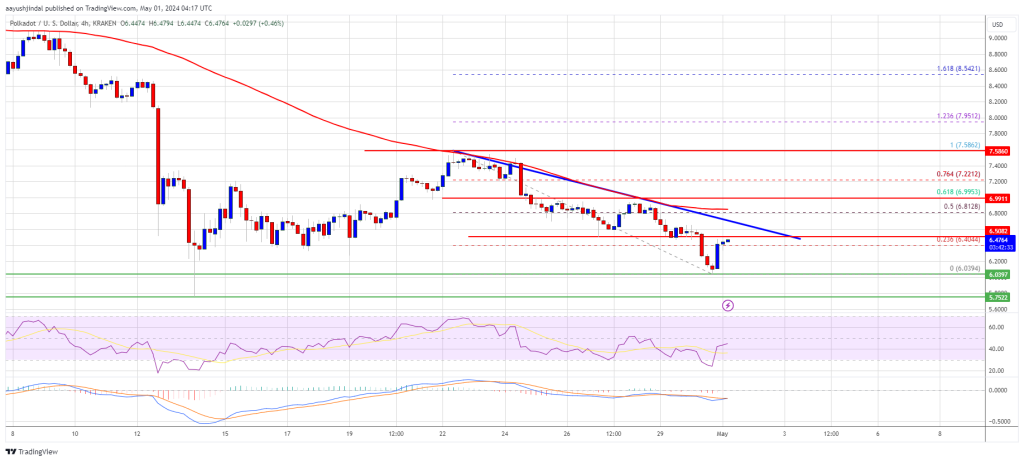
Source: DOTUSD on TradingView.com
The next major resistance is near .00 or the 61.8% Fib retracement level of the downward move from the .58 swing high to the .03 low. A successful break above .00 could start another strong rally. In the stated case, the price could easily rally toward .20 in the near term. The next major resistance is seen near the .00 zone.
More Downsides in DOT?
If DOT price fails to start a fresh increase above .00, it could continue to move down. The first key support is near the .00 level.
The next major support is near the .65 level, below which the price might decline to .00. Any more losses may perhaps open the doors for a move toward the .20 support zone or the trend line.
Technical Indicators
4-Hours MACD – The MACD for DOT/USD is now losing momentum in the bearish zone.
4-Hours RSI (Relative Strength Index) – The RSI for DOT/USD is now below the 50 level.
Major Support Levels – .00, .65 and .00.
Major Resistance Levels – .50, .00, and .50.
Bitcoin Technical Analysis: Sharp Downturns as Bearish Trends Dominate Price Movements
 Bitcoin witnessed a notable intraday swing from ,569 to ,794, reflecting a volatile market environment. Despite this turbulence, its market capitalization still holds strong at just over .3 trillion, supported by a substantial 24-hour trading volume of billion. Bitcoin The analysis of bitcoin’s (BTC) oscillators and moving averages (MAs) presents a mixed signal for […]
Bitcoin News