 Over the past seven days, data reveals that the German government has transferred 3,820 BTC to cryptocurrency exchanges, with around 2,165.49 BTC moved in the last eight hours. German Government’s Bitcoin Transfers Cause Stir A week ago, Bitcoin.com News reported that the German government’s wallet, containing bitcoins seized from a piracy website, held 47,179 BTC […]
Bitcoin News
Ethereum Technical Analysis: ETH Faces Bearish Sentiment Amidst Continued Downtrend
 Ethereum’s price stands at ,311, with a market capitalization of 4 billion. The 24-hour intraday trading range has fluctuated between ,277 and ,500, while the 24-hour trade volume has reached .82 billion. A technical analysis across various timeframes highlights significant bearish indicators. The confluence of oscillators and moving averages suggest a continuation of the downward […]
Bitcoin News
XRP Bears In Control: Understanding the Sustained Bearish Sentiment
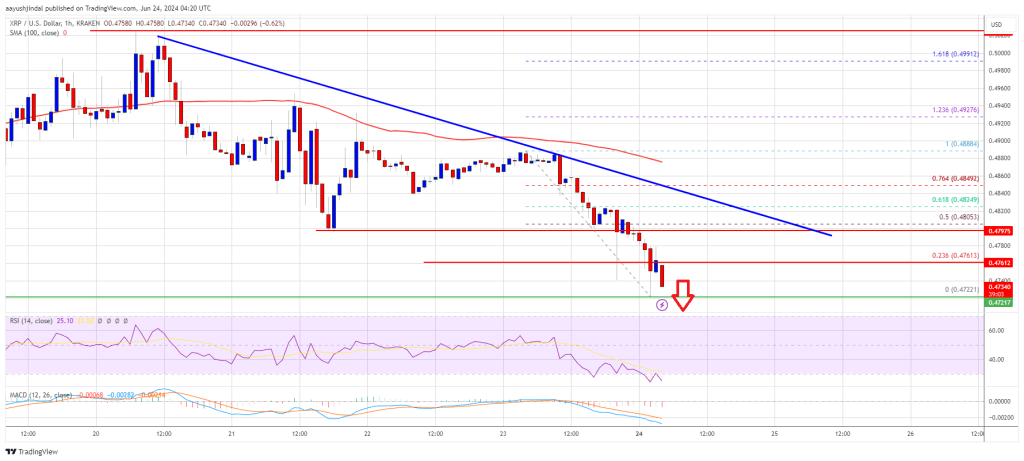
XRP price struggled to recover above the .4880 resistance zone. The price is moving lower and the bears might aim for a move toward .4550.
- XRP price faced another rejection near the .4880 resistance zone.
- The price is now trading below .4850 and the 100-hourly Simple Moving Average.
- There is a connecting bearish trend line forming with resistance at .4810 on the hourly chart of the XRP/USD pair (data source from Kraken).
- The pair could extend losses if there is a close below the .4720 support zone.
XRP Price Extends Losses
XRP price attempted a recovery wave above the .4820 resistance zone. However, the bears were active near the .4880 resistance zone. A high was formed at .4884 and the price started a fresh decline like Bitcoin and Ethereum.
There was a move below the .4850 and .4800 levels. There was even a test of the .4720 support. A low was formed at .4722 and the price is now consolidating losses. It is also trading below .4850 and the 100-hourly Simple Moving Average.
If there is a fresh increase, the price might face hurdles near the .4765 level or the 23.6% Fib retracement level of the downward move from the .4884 swing high to the .4722 low.
The first major resistance is near the .4810 and .4820 levels. There is also a connecting bearish trend line forming with resistance at .4810 on the hourly chart of the XRP/USD pair. The trend line is close to the 50% Fib retracement level of the downward move from the .4884 swing high to the .4722 low.
A clear move above the .4820 resistance might send the price toward the .4880 resistance. The next major resistance is near the .50 level. A close above the .50 resistance zone could send the price higher. The next key resistance is near .5120. Any more gains might send the price toward the .5250 resistance.
More Losses?
If XRP fails to clear the .4820 resistance zone, it could continue to move down. Initial support on the downside is near the .4720 level.
The next major support is at .4650. If there is a downside break and a close below the .4650 level, the price might decline heavily. In the stated case, the price could even trade below the .450 support in the near term.
Technical Indicators
Hourly MACD – The MACD for XRP/USD is now gaining pace in the bearish zone.
Hourly RSI (Relative Strength Index) – The RSI for XRP/USD is now below the 50 level.
Major Support Levels – .4720 and .4650.
Major Resistance Levels – .4820 and .4880.
Ethereum Price Retreats: Market Sentiment Slowly Shifts Bearish
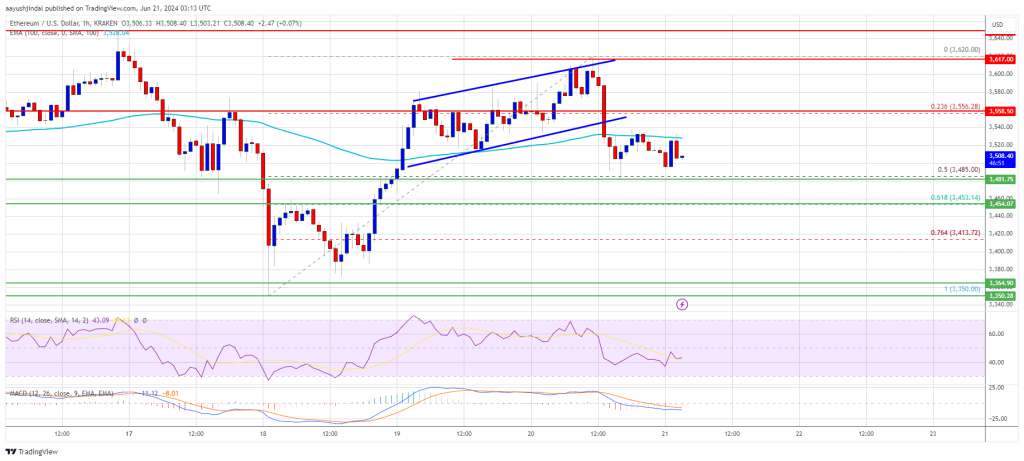
Ethereum price struggled to climb above the ,650 resistance and trimmed gains. ETH is now signaling a downside break and might decline below ,450.
- Ethereum is trimming gains from the ,620 resistance zone.
- The price is trading below ,550 and the 100-hourly Simple Moving Average.
- There was a break below a short-term rising channel forming with support at ,540 on the hourly chart of ETH/USD (data feed via Kraken).
- The pair could gain bearish momentum if it dips below the ,485 and ,450 support levels.
Ethereum Price Trims Gains
Ethereum price started a decent increase above the ,500 zone. ETH outperformed Bitcoin and broke the ,550 resistance. However, the price struggled to surpass the ,620 level and failed to test ,650.
A high was formed at ,620 and the price is now trimming gains. There was a minor decline below the ,550 level. The price dipped below the 23.6% Fib retracement level of the upward move from the ,351 swing low to the ,620 high.
There was a break below a short-term rising channel forming with support at ,540 on the hourly chart of ETH/USD. Ethereum is still trading below ,550 and the 100-hourly Simple Moving Average.
The bulls are now active near the ,485 support zone and the 50% Fib retracement level of the upward move from the ,351 swing low to the ,620 high. On the upside, the price might face resistance near the ,520 level. The first major resistance is near the ,560 level.
The main resistance sits at ,620 or ,650. An upside break above the ,650 resistance might send the price higher. The next key resistance sits at ,720, above which the price might gain traction and rise toward the ,750 level. Any more gains could send Ether toward the ,880 resistance zone in the coming days.
More Downsides In ETH?
If Ethereum fails to clear the ,560 resistance, it could start another decline. Initial support on the downside is near ,485. The first major support is ,450.
A clear move below the ,450 support might push the price toward ,420. Any more losses might send the price toward the ,350 level in the near term.
Technical Indicators
Hourly MACD – The MACD for ETH/USD is gaining momentum in the bearish zone.
Hourly RSI – The RSI for ETH/USD is now below the 50 zone.
Major Support Level – ,450
Major Resistance Level – ,560
Dogecoin Weighted Sentiment Drops To 2024 Lows, What Does This Mean For Price?
The crypto industry is now going through another turbulent period, as evidenced by price data in the past week. Dogecoin, the largest meme cryptocurrency, has particularly led the meme sector in price declines, with most meme coins failing to attract inflows. At the same time, the lacklustre price action has been reflected by a dip in enthusiasm from supporters, according to data analytics. Per data from Santiment, Dogecoin sentiment based on positive mentions across the internet has fallen to its lowest point in 2024. However, while the mood is sour, this could be the best time for traders to scoop up DOGE before the price eventually rebounds.
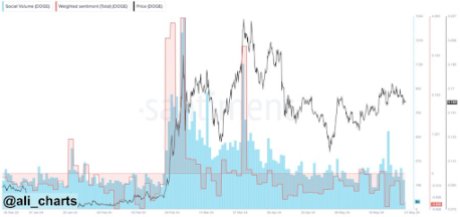
Dogecoin Weighted Sentiment Drops To 2024 Lows
Santiment’s data is based on the weighted sentiment for Dogecoin. Basically, the weighted sentiment tracks various social media mentions of cryptocurrencies and classifies them as either positive or negative. On account of its status as a meme coin, the price of Dogecoin is heavily impacted by the weighted sentiment.
Dogecoin’s weighted sentiment is a cycle of ups and downs and always has its moments. Sometimes, on-chain data points to sentiment shooting through the roof. Other times like this, the sentiment is on the downside, with interest waning among retail investors. As Santiment noted, Dogecoin’s weighted sentiment has been on the lower end in the past few days and is currently at its lowest point in 2024.
With Dogecoin sentiment hitting new lows, it’s likely the Dogecoin price will continue to slide lower in the short term. However, keeping in mind that the weighted sentiment is bound to reverse to the upside, this presents an opportunity for shrewd investors to buy in before another FOMO kicks in.
“Patient traders who have been waiting for the crowd to give up on these large cap altcoins may finally have their buy opportunity with FOMO at a 2024 low,” Santiment noted.
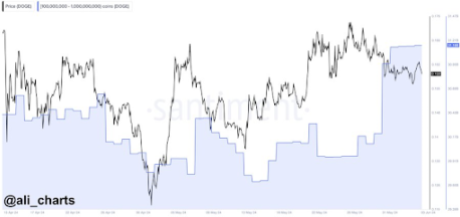
Interestingly, this smart investment strategy is further solidified by Dogecoin’s MVRV ratio. The MVRV ratio compares Dogecoin’s market capitalization to the realized value of all Dogecoins in circulation, essentially showing whether the asset is currently overvalued or undervalued. Notably, Santiment data shows that the Dogecoin MVRV ratio has declined steadily over the past 30 days and is currently less than negative -12%. This suggests that the crypto is currently undervalued and is at a price far below its potential.
What’s Next For DOGE Price?
Given Dogecoin’s history of extreme price volatility and momentum-driven rallies, a shift back to positive sentiment could send the meme coin surging once again.
At the time of writing, DOGE is trading at .1248. Notably, price action indicates that DOGE is starting to reverse seven days of declines with a 2.10% increase in the past 24 hours. Also, the relative strength index (RSI) indicator shows DOGE recently bouncing off the oversold threshold, suggesting that it could continue on an upward trajectory.
Bitcoin Technical Analysis: Bearish Sentiment Tightens Grip as BTC’s Downtrend Continues
 As of June 19, 2024, bitcoin’s price is ,283, fluctuating within an intraday range of ,149 to ,633. On Wednesday, the leading cryptocurrency saw a trade volume of around .28 billion, with a market capitalization of .28 trillion. Bitcoin Bitcoin’s oscillators reflect mixed sentiment. The relative strength index (RSI) is at 41, suggesting neutrality. Similarly, […]
Bitcoin News
XRP, Dogecoin, & Shiba Inu All See Negative Sentiment: Signal To Buy?
Data shows social media users have been showing a negative sentiment towards XRP, Dogecoin, and Shiba Inu after their plunges in the past day.
FUD Has Engulfed Traders Towards These Altcoins After The Latest Crash
According to data from the analytics firm Santiment, the sentiment around XRP (XRP), Dogecoin (DOGE), and Shiba Inu (SHIB) has seen a significant drop recently.
The indicator of interest here is the “Weighted Sentiment,” which derives its value from two other metrics: Sentiment Balance and Social Volume. The first of these, the Sentiment Balance, goes through posts/threads/messages related to a specific cryptocurrency on the major social media platforms and puts them through a machine-learning model.
This model is able to identify and separate between negative and positive posts. The Sentiment Balance then takes the difference of these posts to find a net sentiment for the market.
The other relevant indicator here, the Social Volume, basically keeps track of the degree of discussion that a given asset is receiving on social media. The metric’s value represents the unique number of posts that are making at least one mention of the coin.
While the Sentiment Balance on its own does tell us about what the majority sentiment on social media currently is, it doesn’t quite contain information about how many users actually share this sentiment.
Activity on these platforms can fluctuate and sometimes only a few posts around the given cryptocurrency may pop up. Even if all of these posts are bullish, it’s hard to say whether they represent what the entirety of the market thinks.
The Weighted Sentiment remedies this issue by taking the Sentiment Balance and weighing it against the Social Volume. With this adjustment, the indicator only reflects an overwhelming dominance in either direction when not only does the net sentiment have a high magnitude, but also a large amount of posts are circulating around the asset.
Now, here is a chart that shows the recent trend in this indicator for three altcoins: XRP, DOGE, and SHIB.
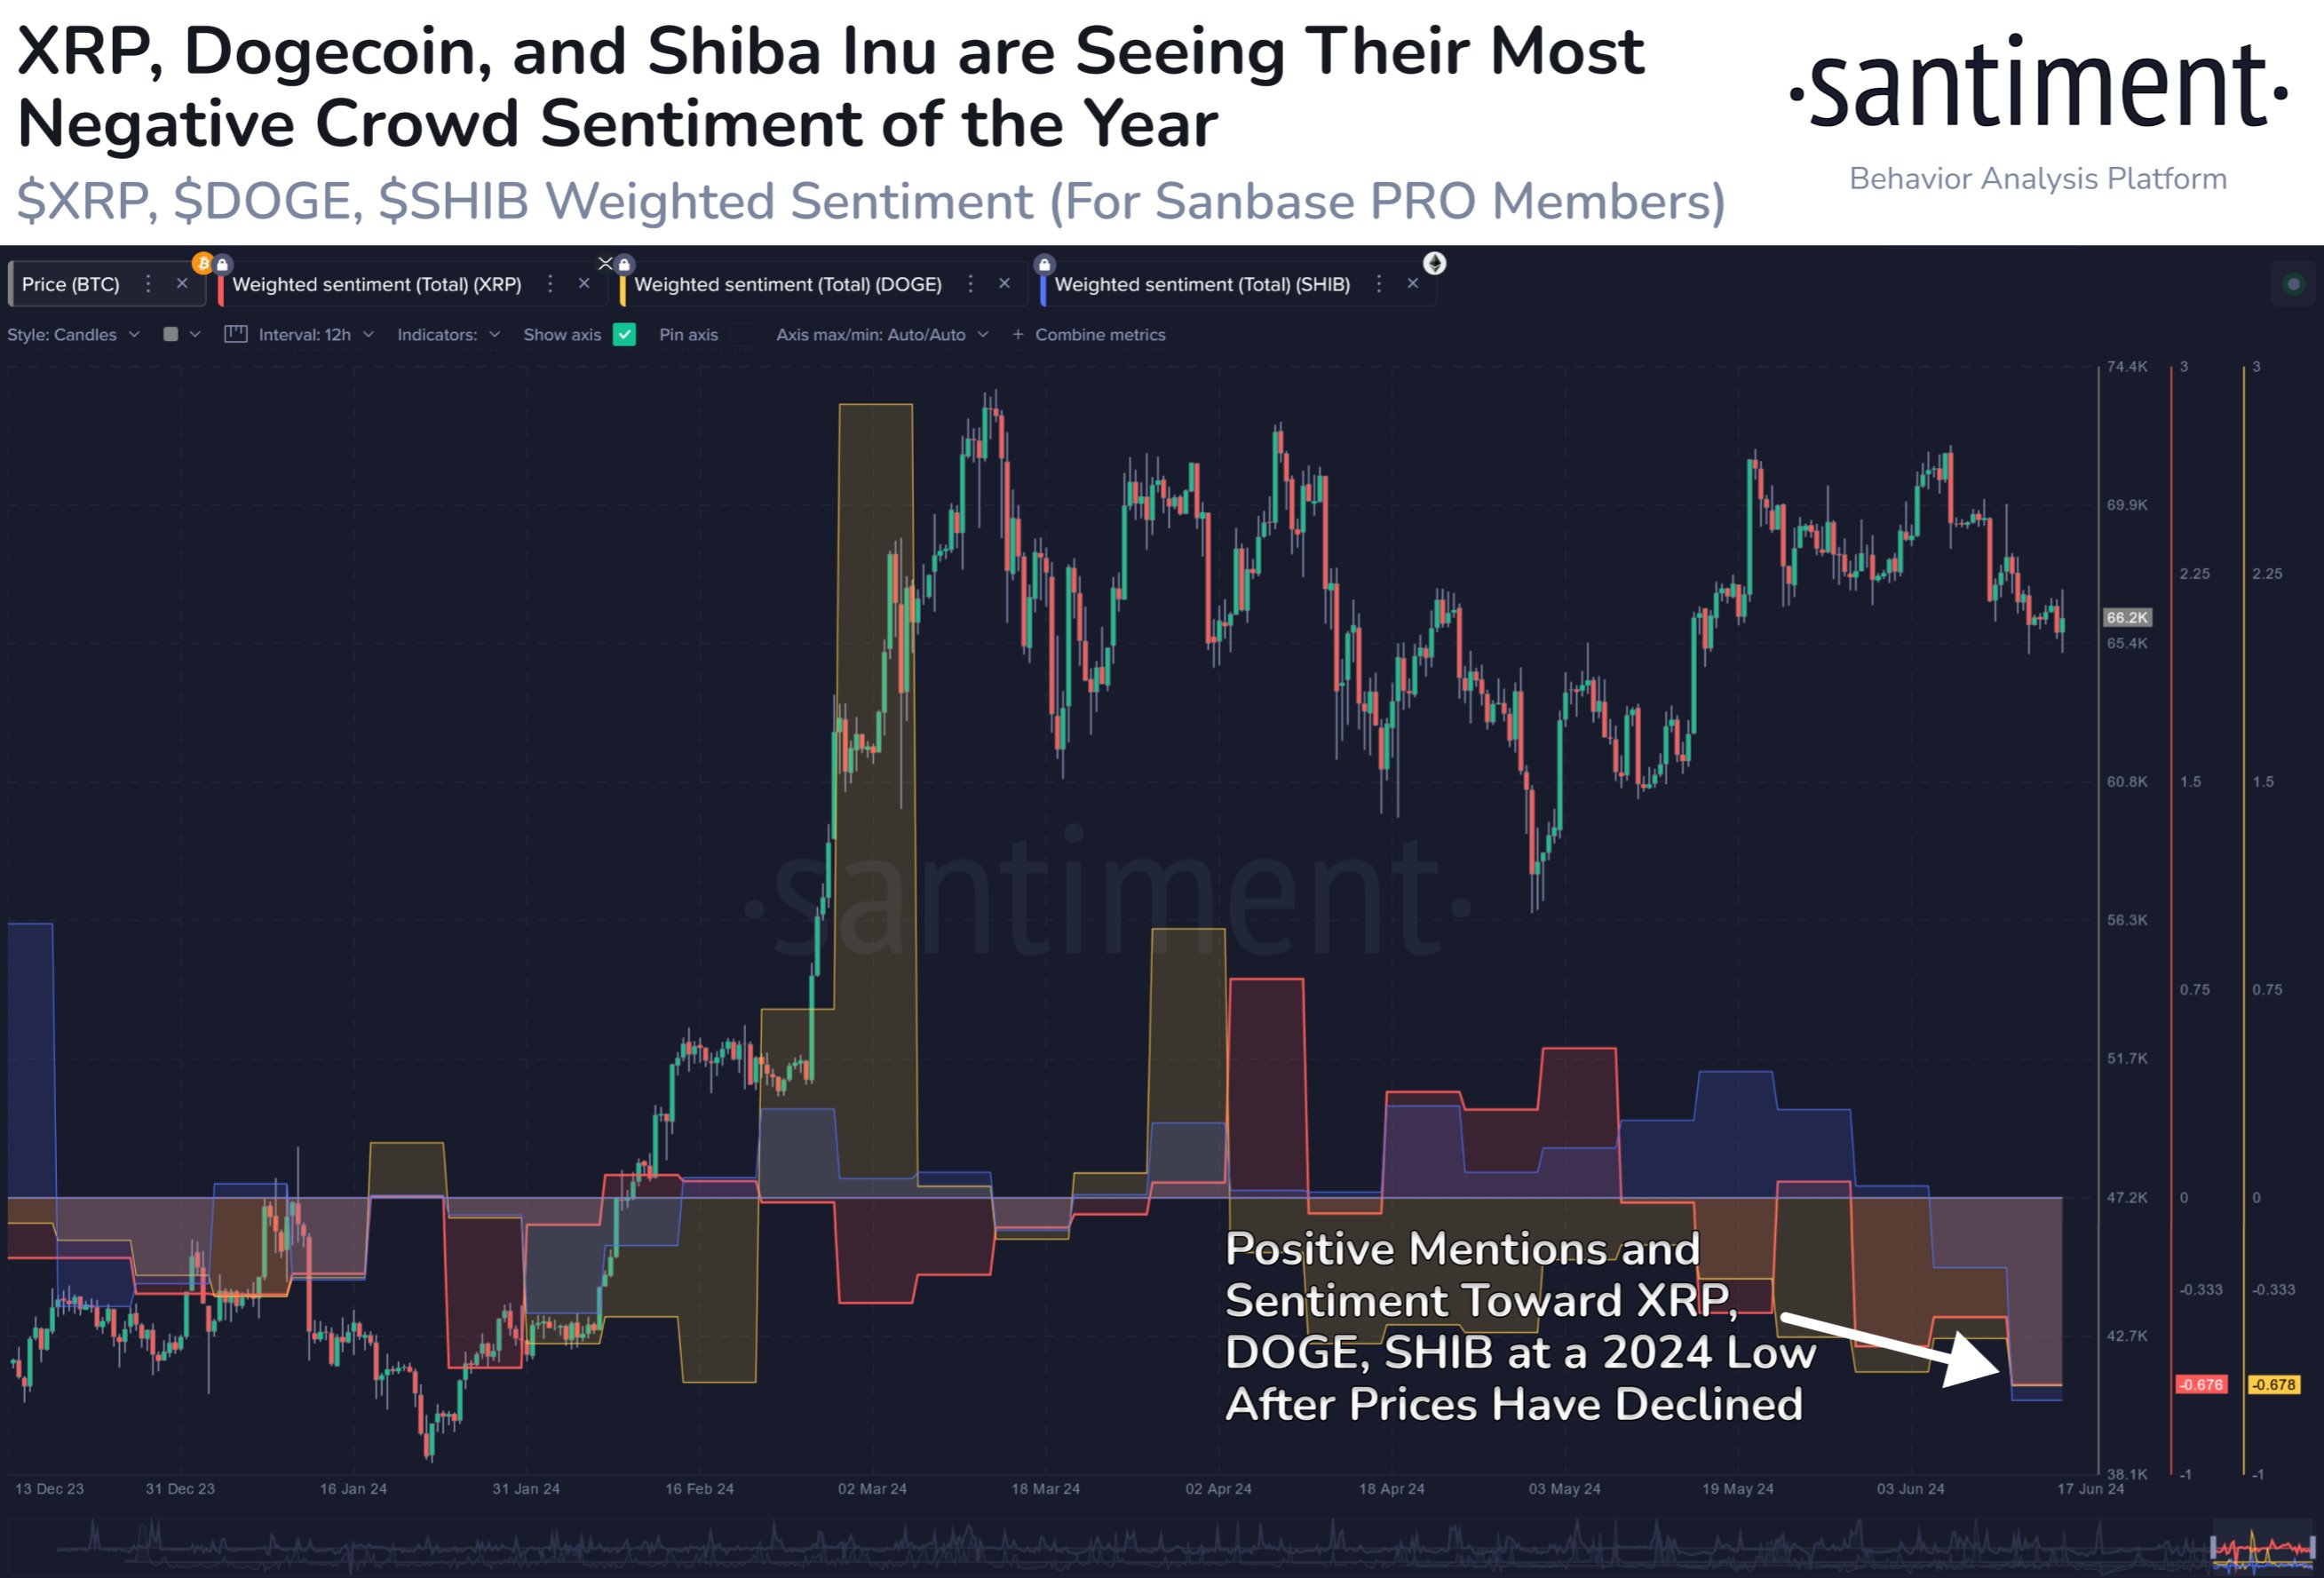
As displayed in the above graph, the Weighted Sentiment has recently plunged into the negative territory for all three of XRP, Dogecoin, and Shiba Inu. This decline in the indicator has come as the prices of these assets have gone through a drawdown.
Naturally, these negative values imply the traders on social media have become bearish towards these assets. This FUD, however, can actually turn out to be a boon for the coins.
Historically, cryptocurrencies have tended to move contrary to the expectations of the majority. As such, with the Weighted Sentiment at negative levels, XRP and others could be close to hitting a bottom.
“Patient traders who have been waiting for the crowd to give up on these large cap altcoins may finally have their buy opportunity with FOMO at a 2024 low,” notes Santiment.
XRP Price
XRP has seen its price drop to .49 after witnessing a plunge of 6% over the past couple of weeks.
Solana On-Chain Indicators Suggests A Return Of Bullish Sentiment, Is It Time To Buy SOL?
Certain on-chain indicators paint a bullish picture for Solana (SOL), suggesting this may be an excellent time to purchase the crypto token. This aligns with Solana’s price movement on the chart, with technical analysts predicting that an upward trend might be on the horizon.
Solana Enjoying Greater Adoption
Data from the market Intelligence platform IntoTheBlock shows that the number of daily addresses on the Solana network has been growing at an impressive rate. On June 11, over 1 million new addresses transacted on the Solana network. This development is significant as SOL could enjoy future price surges as more new users continue to trade on the network.
The massive growth enjoyed by the Solana network has also translated to greater trading volume on the network, which is also bullish for the crypto token. Data from DappRadar shows that there has been a 62% increase in transaction volume on the Solana chain in the last 24 hours, with over 8.83 million transactions processed during this period.
Interstingly, Solana stands tall in this metric, as no other chain has processed this many transactions during this period. Solana has also processed more transactions than every other chain in the last seven days, with over 59.55 million transactions processed within this timeframe.
The growing interest in SOL has been partly thanks to the meme coin ecosystem on the network. Solana has become the go-to platform for traders looking to make massive profits from meme coins, which have so far been the best-performing crypto assets in this bull run.
Solana’s reputation as the home for meme coins has even attracted celebrities like Australian rapper Iggy Azalea, Caitlyn Jenner, and Andrew Tate to the network. Bearing this in mind, it only seems like a matter of time before Solana’s price reacts positively to its network growth and ever-increasing network activity.
Time To Buy SOL?
Crypto analyst Altcoin Sherpa suggested that now might be a good time to buy Solana ahead of the meteoric price rally, which it could enjoy soon enough. The analyst said he expects “bigger things” for SOL later this year. For now, he expects Solana to keep chopping between 5 and 0 and just continue to witness a “prolonged period of consolidation.”
This period of consolidation is usually a good time for investors to accumulate the crypto token, considering that coins typically enjoy a parabolic uptrend after consolidating for a while. Meanwhile, Altcoin Sherpa claimed that this period of consolidation is healthy for Solana, given the huge run it has already had, rising to a yearly high of 9 on March 18. As to how Solana can rise, Altcoin Sherpa previously predicted that the crypto token will rise above 0 this year.
Bitcoin Set for Further Decline As Bearish Sentiment Intensifies
Bitcoin (BTC), the leading cryptocurrency by market capitalization, appears to be heading for further declines as market sentiment turns increasingly bearish. Recent analysis shows that BTC is struggling to maintain key support levels, and the overall mood among traders and investors is shifting towards caution. Several factors such as macroeconomic pressures, regulatory concerns, and technical indicators contribute to this negative outlook.
As Bitcoin continues to face selling pressure, the potential for additional downside becomes more pronounced. This article explores Bitcoin’s near-term price action for market participants looking to navigate the current volatility and make informed decisions about their BTC holdings.
Currently, the price of BTC is down by -2,50%, trading at about ,796, with a market capitalization of over .3 trillion and a trading volume of over billion as of the time of writing. Although its market capitalization is down by 2.44%, its trading volume is up by 94,43% in the past day.
Technical Analysis Points Further Decline In Bitcoin Price
BTC on the 4-hour timeframe has dropped below the 100-day Simple Moving Average (SMA) with strong momentum by dropping two bearish candlesticks. With such momentum, the price of BTC may decline more.

The 4-hour RSI has also experienced a huge drop below 50% trending close to the oversold zone. This confirms that BTC may still witness more price declines.
On the daily timeframe, BTC’s price with a strong momentum is making a significant drop toward the 100-day SMA with a huge bearish candlestick. Based on the above price action, it can be suggested that BTC may remain bearish for the rest of the day.

Finally, the 1-day Relative Strength Index (RSI) also suggests that the price of Bitcoin is likely to decline more, as the RSI line has dropped slightly below 50% and might trend there for a while.
More Losses For BTC?
Based on price analysis and what the RSI indicator suggests, if Bitcoin continues to decline, it will move toward the ,736 support level. If it breaks this level, it will decline further to test the ,515 support level. There is a possibility that it might even drop more to test the ,158 if the aforementioned level cannot hold the price.
However, suppose BTC decides to reverse course at any of the previously suggested support levels, it will start to ascend toward the direction of the ,909 resistance level. If the price breaks above this resistance level, it may move to test the ,811 level and possibly move further to create a new all-time high.
Dogecoin Social Sentiment Turns Bearish And Drops To March Levels, What This Means For Price
Crypto analyst Ali Martinez recently revealed the bearish sentiment surrounding Dogecoin (DOGE). Interestingly, he suggested this might be a good opportunity to invest in the foremost meme coin as things could soon turn bullish.
The Bearish Sentiment Around Dogecoin
Martinez mentioned in an X (formerly Twitter) post that the market sentiment for Dogecoin is as bearish as it was in early February. Specifically, the crypto analyst was referring to Dogecoin’s social volume and weighted sentiment, which were currently signaling a negative sentiment towards the meme coin.
This social volume metric refers to how much the crypto token is discussed across social media platforms. Therefore, the decline in Dogecoin’s social volume suggests that traders are currently paying more attention to other meme coins. This is expected given how Dogecoin’s price has lagged for a while now, with other meme coins like Dogwifhat (WIF) and Pepe (PEPE) recording significant gains.
However, Martinez suggested that Dogecoin could enjoy a bullish reversal soon enough, revealing that Dogecoin’s price skyrocketed by over 200% back in February when it was plagued with such bearish sentiment. Dogecoin whales seem to have taken the hint and used this opportunity to accumulate more of the meme coin.
Martinez revealed that these investors have already purchased 700 million (2 million). The crypto analyst also mentioned that these whales have bought an additional 200 million DOGE since May 30. This is undoubtedly in anticipation of the significant price gains that Dogecoin could make soon enough.
Crypto analyst Altcoin Sherpa also recently raised the possibility of Dogecoin rising to as high as .40 soon enough. He claimed that this would happen as retail investors accumulate the meme coin. He further alluded to Elon Musk’s influence on the meme coin and stated that “all it takes is one retarded Elon tweet to blow it (Dogecoin) up.” He added that Dogecoin has “great liquidity/low downside” compared to other meme coins.
DOGE Season Around The Corner
Crypto analyst Crypto Kaleo recently predicted that Dogecoin’s season might be around the corner. He alluded to the fact that Dogecoin rose significantly in 2021 after GameStop’s stock hit its peak in early 2021. He believes that Dogecoin could again rally once GameStop hits its market top.
In another X post, Kaleo revealed that he is confident that Dogecoin can outpace Bitcoin in this cycle. He suggested that Dogecoin’s current price action is normal, claiming that the meme coin “moves sideways for extended periods, followed by rapid vertical growth.” The crypto analyst also noted that the market is in a meme supercycle and remarked that the “king of memes won’t be left behind.”
At the time of writing, Dogecoin is trading at around .15, down over 2% in the last 24 hours, according to data from CoinMarketCap.